Statistiques de base
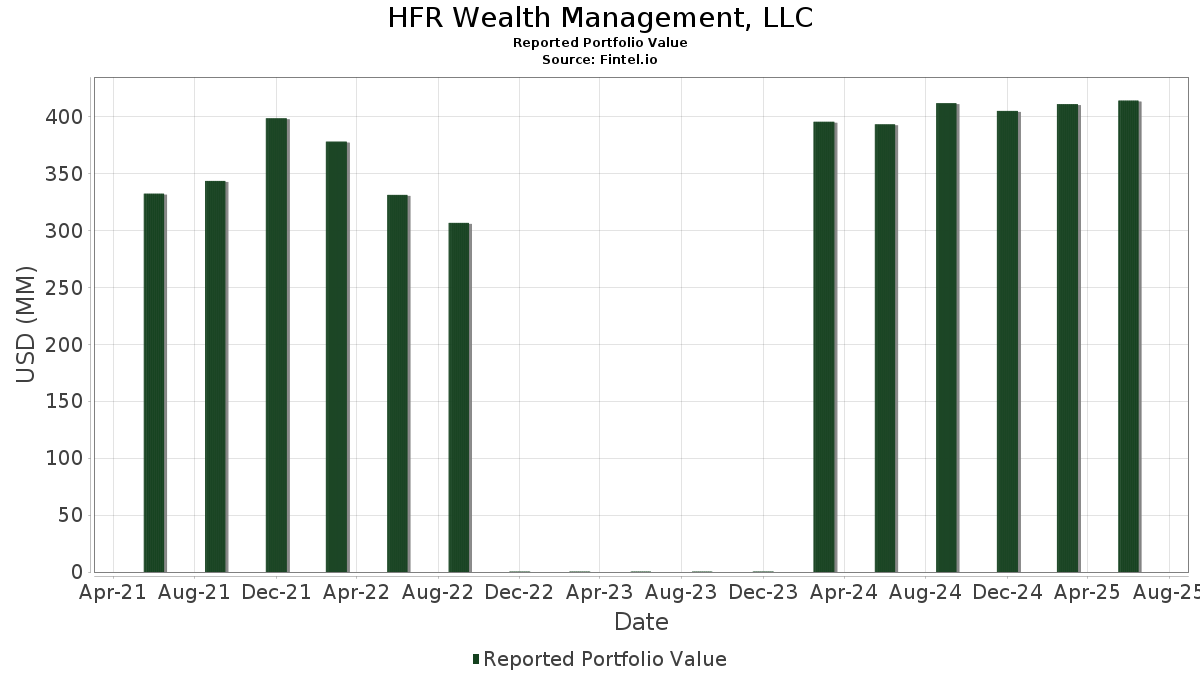
| Valeur du portefeuille | $ 413 966 121 |
| Positions actuelles | 51 |
Dernières positions, performances, ASG (à partir des dépôts 13F, 13D)
HFR Wealth Management, LLC a déclaré un total de 51 positions dans ses derniers dépôts auprès de la SEC. La valeur la plus récente du portefeuille est calculée à 413 966 121 USD. Les actifs sous gestion réels (ASG) sont cette valeur plus les liquidités (qui ne sont pas divulguées). Les principales positions de HFR Wealth Management, LLC sont Amphenol Corporation (US:APH) , Cintas Corporation (US:CTAS) , Amazon.com, Inc. (US:AMZN) , Costco Wholesale Corporation (US:COST) , and Intuit Inc. (US:INTU) . Les nouvelles positions de HFR Wealth Management, LLC incluent Barrick Mining Corporation (US:B) , .
Meilleures augmentations ce trimestre
Nous utilisons la variation de l'allocation du portefeuille car il s'agit de l'indicateur le plus significatif. Les changements peuvent être dus à des transactions ou à des variations de prix des actions.
| Titre | Actions (en millions) |
Valeur ($ en millions) |
% du portefeuille | ΔPortefeuille % |
|---|---|---|---|---|
| 0,23 | 22,86 | 5,5211 | 1,8178 | |
| 0,02 | 18,45 | 4,4573 | 0,9657 | |
| 0,10 | 21,29 | 5,1429 | 0,6564 | |
| 0,18 | 15,98 | 3,8604 | 0,5395 | |
| 0,10 | 22,16 | 5,3537 | 0,3713 | |
| 0,29 | 9,80 | 2,3673 | 0,1755 | |
| 0,02 | 18,63 | 4,4999 | 0,1648 | |
| 0,12 | 8,47 | 2,0449 | 0,1546 | |
| 0,04 | 9,88 | 2,3862 | 0,1471 | |
| 0,27 | 15,45 | 3,7316 | 0,1425 |
Principales baisses ce trimestre
Nous utilisons la variation de l'allocation du portefeuille car il s'agit de l'indicateur le plus significatif. Les changements peuvent être dus à des transactions ou à des variations de prix des actions.
| Titre | Actions (en millions) |
Valeur ($ en millions) |
% du portefeuille | ΔPortefeuille % |
|---|---|---|---|---|
| 0,00 | 0,45 | 0,1089 | -2,0952 | |
| 0,09 | 18,38 | 4,4395 | -0,6288 | |
| 0,03 | 5,92 | 1,4297 | -0,4255 | |
| 0,03 | 12,22 | 2,9512 | -0,2939 | |
| 0,04 | 10,64 | 2,5705 | -0,2854 | |
| 0,13 | 10,15 | 2,4530 | -0,2060 | |
| 0,07 | 11,33 | 2,7378 | -0,1816 | |
| 0,26 | 13,79 | 3,3311 | -0,1463 | |
| 0,10 | 10,88 | 2,6275 | -0,1248 | |
| 0,05 | 10,30 | 2,4874 | -0,1138 |
Déclarations 13F et dépôts de fonds
Ce formulaire a été déposé le 2025-08-12 pour la période de déclaration 2025-06-30. Cliquez sur l'icône du lien pour voir l'historique complet des transactions.
Mettre à niveau pour débloquer les données premium et exporter vers Excel ![]() .
.
| Titre | Type | Prix moyen de l'action | Actions (en millions) |
ΔActions (%) |
ΔActions (%) |
Valeur ($ en millions) |
Portefeuille (%) |
ΔPortefeuille (%) |
|
|---|---|---|---|---|---|---|---|---|---|
| APH / Amphenol Corporation | 0,23 | -0,23 | 22,86 | 50,21 | 5,5211 | 1,8178 | |||
| CTAS / Cintas Corporation | 0,10 | -0,16 | 22,16 | 8,27 | 5,3537 | 0,3713 | |||
| AMZN / Amazon.com, Inc. | 0,10 | 0,16 | 21,29 | 15,50 | 5,1429 | 0,6564 | |||
| COST / Costco Wholesale Corporation | 0,02 | -0,08 | 18,63 | 4,59 | 4,4999 | 0,1648 | |||
| INTU / Intuit Inc. | 0,02 | 0,27 | 18,45 | 28,62 | 4,4573 | 0,9657 | |||
| AAPL / Apple Inc. | 0,09 | -4,45 | 18,38 | -11,75 | 4,4395 | -0,6288 | |||
| TJX / The TJX Companies, Inc. | 0,14 | -0,51 | 17,37 | 0,88 | 4,1950 | 0,0049 | |||
| V / Visa Inc. | 0,05 | 0,05 | 16,28 | 1,36 | 3,9327 | 0,0234 | |||
| SCHW / The Charles Schwab Corporation | 0,18 | 0,49 | 15,98 | 17,13 | 3,8604 | 0,5395 | |||
| ROL / Rollins, Inc. | 0,27 | 0,32 | 15,45 | 4,76 | 3,7316 | 0,1425 | |||
| LII / Lennox International Inc. | 0,03 | 0,72 | 15,16 | 2,95 | 3,6629 | 0,0780 | |||
| ADP / Automatic Data Processing, Inc. | 0,05 | 0,61 | 14,78 | 1,55 | 3,5708 | 0,0281 | |||
| TSCO / Tractor Supply Company | 0,26 | 0,78 | 13,79 | -3,49 | 3,3311 | -0,1463 | |||
| WM / Waste Management, Inc. | 0,06 | 0,65 | 13,17 | -0,52 | 3,1822 | -0,0408 | |||
| BRK.B / Berkshire Hathaway Inc. | 0,03 | 0,46 | 12,22 | -8,37 | 2,9512 | -0,2939 | |||
| DOV / Dover Corporation | 0,06 | 1,26 | 11,58 | 5,61 | 2,7983 | 0,1287 | |||
| PG / The Procter & Gamble Company | 0,07 | 1,07 | 11,33 | -5,51 | 2,7378 | -0,1816 | |||
| RPM / RPM International Inc. | 0,10 | 1,30 | 10,88 | -3,81 | 2,6275 | -0,1248 | |||
| UNP / Union Pacific Corporation | 0,05 | 1,29 | 10,68 | -1,35 | 2,5808 | -0,0551 | |||
| AMGN / Amgen Inc. | 0,04 | 1,19 | 10,64 | -9,31 | 2,5705 | -0,2854 | |||
| WEC / WEC Energy Group, Inc. | 0,10 | 1,21 | 10,61 | -3,23 | 2,5639 | -0,1055 | |||
| APD / Air Products and Chemicals, Inc. | 0,04 | 1,41 | 10,30 | -3,00 | 2,4877 | -0,0965 | |||
| PKG / Packaging Corporation of America | 0,05 | 1,24 | 10,30 | -3,65 | 2,4874 | -0,1138 | |||
| MKC / McCormick & Company, Incorporated | 0,13 | 0,91 | 10,15 | -7,05 | 2,4530 | -0,2060 | |||
| STE / STERIS plc | 0,04 | 1,31 | 9,88 | 7,38 | 2,3862 | 0,1471 | |||
| TR / Tootsie Roll Industries, Inc. | 0,29 | 2,42 | 9,80 | 8,82 | 2,3673 | 0,1755 | |||
| NEE / NextEra Energy, Inc. | 0,13 | 1,72 | 9,09 | -0,38 | 2,1946 | -0,0253 | |||
| HSIC / Henry Schein, Inc. | 0,12 | 2,19 | 8,47 | 9,00 | 2,0449 | 0,1546 | |||
| DHR / Danaher Corporation | 0,04 | 2,18 | 8,24 | -1,53 | 1,9914 | -0,0463 | |||
| BDX / Becton, Dickinson and Company | 0,03 | 3,25 | 5,92 | -22,36 | 1,4297 | -0,4255 | |||
| BRK.A / Berkshire Hathaway Inc. | 0,00 | 0,00 | 2,19 | -8,73 | 0,5282 | -0,0548 | |||
| VLTO / Veralto Corporation | 0,01 | -0,56 | 1,18 | 2,98 | 0,2841 | 0,0062 | |||
| RTX / RTX Corporation | 0,00 | 0,00 | 0,72 | 10,24 | 0,1743 | 0,0150 | |||
| JPM / JPMorgan Chase & Co. | 0,00 | 0,53 | 0,55 | 18,66 | 0,1324 | 0,0201 | |||
| HD / The Home Depot, Inc. | 0,00 | -8,98 | 0,49 | -8,92 | 0,1185 | -0,0126 | |||
| ETN / Eaton Corporation plc | 0,00 | -8,94 | 0,46 | 19,58 | 0,1106 | 0,0174 | |||
| JNJ / Johnson & Johnson | 0,00 | -94,59 | 0,45 | -95,03 | 0,1089 | -2,0952 | |||
| B / Barrick Mining Corporation | 0,02 | 0,43 | 0,1027 | 0,1027 | |||||
| CVX / Chevron Corporation | 0,00 | -11,73 | 0,37 | -24,54 | 0,0901 | -0,0300 | |||
| XOM / Exxon Mobil Corporation | 0,00 | 0,00 | 0,35 | -9,46 | 0,0858 | -0,0096 | |||
| SXI / Standex International Corporation | 0,00 | -2,24 | 0,34 | -5,28 | 0,0824 | -0,0052 | |||
| UNH / UnitedHealth Group Incorporated | 0,00 | 0,00 | 0,34 | -40,35 | 0,0821 | -0,0568 | |||
| IJH / iShares Trust - iShares Core S&P Mid-Cap ETF | 0,00 | 0,00 | 0,31 | 6,25 | 0,0740 | 0,0039 | |||
| DE / Deere & Company | 0,00 | 0,00 | 0,28 | 8,40 | 0,0687 | 0,0048 | |||
| PM / Philip Morris International Inc. | 0,00 | 0,00 | 0,27 | 14,89 | 0,0652 | 0,0080 | |||
| CLX / The Clorox Company | 0,00 | 0,00 | 0,27 | -18,40 | 0,0643 | -0,0152 | |||
| ABBV / AbbVie Inc. | 0,00 | 0,00 | 0,27 | -11,67 | 0,0643 | -0,0088 | |||
| IBM / International Business Machines Corporation | 0,00 | 0,23 | 0,0558 | 0,0558 | |||||
| SR / Spire Inc. | 0,00 | 0,00 | 0,22 | -6,72 | 0,0537 | -0,0043 | |||
| VZ / Verizon Communications Inc. | 0,00 | 0,00 | 0,22 | -4,42 | 0,0522 | -0,0029 | |||
| HON / Honeywell International Inc. | 0,00 | 0,20 | 0,0484 | 0,0484 | |||||
| GOLD / Barrick Mining Corporation | 0,00 | -100,00 | 0,00 | 0,0000 | |||||
| XLK / The Select Sector SPDR Trust - The Technology Select Sector SPDR Fund | 0,00 | -100,00 | 0,00 | 0,0000 | |||||
| GOOG / Alphabet Inc. | 0,00 | -100,00 | 0,00 | 0,0000 | |||||
| IHI / iShares Trust - iShares U.S. Medical Devices ETF | 0,00 | -100,00 | 0,00 | 0,0000 | |||||
| GOOG / Alphabet Inc. | 0,00 | -100,00 | 0,00 | 0,0000 |