Statistiques de base
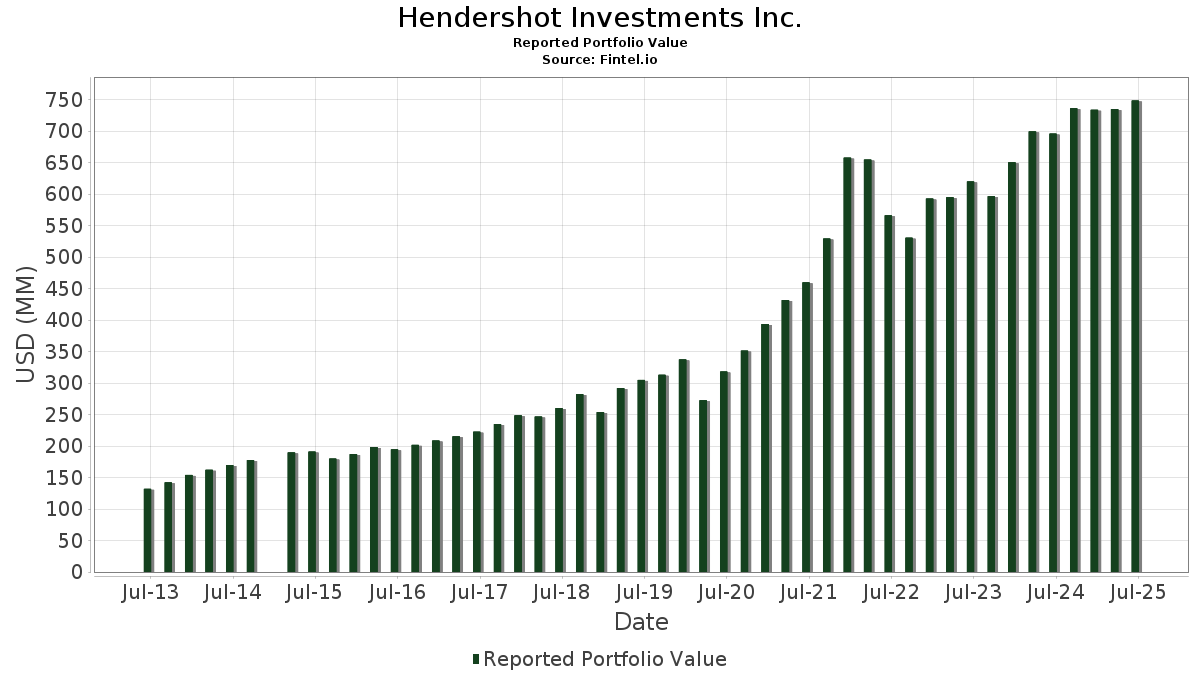
| Valeur du portefeuille | $ 748 389 875 |
| Positions actuelles | 129 |
Dernières positions, performances, ASG (à partir des dépôts 13F, 13D)
Hendershot Investments Inc. a déclaré un total de 129 positions dans ses derniers dépôts auprès de la SEC. La valeur la plus récente du portefeuille est calculée à 748 389 875 USD. Les actifs sous gestion réels (ASG) sont cette valeur plus les liquidités (qui ne sont pas divulguées). Les principales positions de Hendershot Investments Inc. sont Berkshire Hathaway Inc. (US:BRK.B) , Booking Holdings Inc. (US:BKNG) , Alphabet Inc. (US:GOOGL) , Apple Inc. (US:AAPL) , and The TJX Companies, Inc. (US:TJX) . Les nouvelles positions de Hendershot Investments Inc. incluent Union Pacific Corporation (US:UNP) , Atlantic Union Bankshares Corporation (US:AUB) , VanEck ETF Trust - VanEck Semiconductor ETF (US:SMH) , iShares Trust - iShares Russell Mid-Cap Growth ETF (US:IWP) , and The Goldman Sachs Group, Inc. (US:GS) .
Meilleures augmentations ce trimestre
Nous utilisons la variation de l'allocation du portefeuille car il s'agit de l'indicateur le plus significatif. Les changements peuvent être dus à des transactions ou à des variations de prix des actions.
| Titre | Actions (en millions) |
Valeur ($ en millions) |
% du portefeuille | ΔPortefeuille % |
|---|---|---|---|---|
| 0,11 | 16,84 | 2,2501 | 1,5110 | |
| 0,06 | 30,13 | 4,0256 | 0,9595 | |
| 0,01 | 37,98 | 5,0753 | 0,9576 | |
| 0,08 | 16,64 | 2,2228 | 0,8470 | |
| 0,21 | 36,78 | 4,9147 | 0,5877 | |
| 0,02 | 11,63 | 1,5536 | 0,3288 | |
| 0,11 | 11,69 | 1,5619 | 0,3248 | |
| 0,07 | 16,27 | 2,1742 | 0,3141 | |
| 0,02 | 8,74 | 1,1678 | 0,2996 | |
| 0,07 | 19,59 | 2,6180 | 0,2719 |
Principales baisses ce trimestre
Nous utilisons la variation de l'allocation du portefeuille car il s'agit de l'indicateur le plus significatif. Les changements peuvent être dus à des transactions ou à des variations de prix des actions.
| Titre | Actions (en millions) |
Valeur ($ en millions) |
% du portefeuille | ΔPortefeuille % |
|---|---|---|---|---|
| 0,21 | 104,41 | 13,9514 | -1,8876 | |
| 0,04 | 11,56 | 1,5451 | -1,6511 | |
| 0,16 | 33,52 | 4,4787 | -0,5772 | |
| 0,45 | 9,96 | 1,3310 | -0,5665 | |
| 0,12 | 15,69 | 2,0964 | -0,3712 | |
| 0,05 | 7,78 | 1,0400 | -0,3396 | |
| 0,16 | 24,55 | 3,2798 | -0,2268 | |
| 0,05 | 5,50 | 0,7352 | -0,1818 | |
| 0,09 | 12,94 | 1,7296 | -0,1203 | |
| 0,18 | 9,45 | 1,2629 | -0,0711 |
Déclarations 13F et dépôts de fonds
Ce formulaire a été déposé le 2025-08-13 pour la période de déclaration 2025-06-30. Cliquez sur l'icône du lien pour voir l'historique complet des transactions.
Mettre à niveau pour débloquer les données premium et exporter vers Excel ![]() .
.
| Titre | Type | Prix moyen de l'action | Actions (en millions) |
ΔActions (%) |
ΔActions (%) |
Valeur ($ en millions) |
Portefeuille (%) |
ΔPortefeuille (%) |
|
|---|---|---|---|---|---|---|---|---|---|
| BRK.B / Berkshire Hathaway Inc. | 0,21 | -1,63 | 104,41 | -10,28 | 13,9514 | -1,8876 | |||
| BKNG / Booking Holdings Inc. | 0,01 | -0,09 | 37,98 | 25,55 | 5,0753 | 0,9576 | |||
| GOOGL / Alphabet Inc. | 0,21 | 1,52 | 36,78 | 15,70 | 4,9147 | 0,5877 | |||
| AAPL / Apple Inc. | 0,16 | -2,31 | 33,52 | -9,77 | 4,4787 | -0,5772 | |||
| TJX / The TJX Companies, Inc. | 0,25 | 0,49 | 31,20 | 1,89 | 4,1686 | 0,0011 | |||
| MSFT / Microsoft Corporation | 0,06 | 0,93 | 30,13 | 33,74 | 4,0256 | 0,9595 | |||
| JNJ / Johnson & Johnson | 0,16 | 3,44 | 24,55 | -4,73 | 3,2798 | -0,2268 | |||
| V / Visa Inc. | 0,07 | -0,35 | 23,76 | 0,96 | 3,1751 | -0,0285 | |||
| ADP / Automatic Data Processing, Inc. | 0,07 | -0,36 | 21,06 | 0,57 | 2,8145 | -0,0360 | |||
| MA / Mastercard Incorporated | 0,04 | 1,72 | 20,33 | 4,29 | 2,7166 | 0,0632 | |||
| GD / General Dynamics Corporation | 0,07 | 6,23 | 19,59 | 13,67 | 2,6180 | 0,2719 | |||
| CTSH / Cognizant Technology Solutions Corporation | 0,23 | 1,46 | 17,71 | 3,49 | 2,3663 | 0,0373 | |||
| NVDA / NVIDIA Corporation | 0,11 | 112,73 | 16,84 | 210,11 | 2,2501 | 1,5110 | |||
| ORCL / Oracle Corporation | 0,08 | 5,24 | 16,64 | 64,57 | 2,2228 | 0,8470 | |||
| AMZN / Amazon.com, Inc. | 0,07 | 3,25 | 16,27 | 19,06 | 2,1742 | 0,3141 | |||
| PEP / PepsiCo, Inc. | 0,12 | -1,73 | 15,69 | -13,46 | 2,0964 | -0,3712 | |||
| GPC / Genuine Parts Company | 0,12 | 0,78 | 14,95 | 2,62 | 1,9970 | 0,0148 | |||
| RTX / RTX Corporation | 0,09 | -13,61 | 12,94 | -4,76 | 1,7296 | -0,1203 | |||
| CPAY / Corpay, Inc. | 0,04 | 11,79 | 12,49 | 6,37 | 1,6694 | 0,0708 | |||
| RMD / ResMed Inc. | 0,05 | 2,02 | 12,33 | 17,58 | 1,6470 | 0,2202 | |||
| TXRH / Texas Roadhouse, Inc. | 0,06 | 3,16 | 11,95 | 16,03 | 1,5962 | 0,1948 | |||
| CNI / Canadian National Railway Company | 0,11 | 20,47 | 11,69 | 28,61 | 1,5619 | 0,3248 | |||
| META / Meta Platforms, Inc. | 0,02 | 0,89 | 11,63 | 29,21 | 1,5536 | 0,3288 | |||
| UNH / UnitedHealth Group Incorporated | 0,04 | -17,33 | 11,56 | -50,76 | 1,5451 | -1,6511 | |||
| GNTX / Gentex Corporation | 0,45 | -24,29 | 9,96 | -28,55 | 1,3310 | -0,5665 | |||
| ROST / Ross Stores, Inc. | 0,08 | 4,38 | 9,94 | 4,20 | 1,3283 | 0,0299 | |||
| TSCO / Tractor Supply Company | 0,18 | 0,69 | 9,45 | -3,57 | 1,2629 | -0,0711 | |||
| ACN / Accenture plc | 0,03 | 2,01 | 9,09 | -2,29 | 1,2142 | -0,0515 | |||
| MOH / Molina Healthcare, Inc. | 0,03 | 8,49 | 8,77 | -1,88 | 1,1723 | -0,0447 | |||
| ADBE / Adobe Inc. | 0,02 | 35,82 | 8,74 | 37,02 | 1,1678 | 0,2996 | |||
| KNSL / Kinsale Capital Group, Inc. | 0,02 | 12,42 | 8,49 | 11,77 | 1,1348 | 0,1006 | |||
| FAST / Fastenal Company | 0,20 | 97,41 | 8,49 | 6,92 | 1,1343 | 0,0536 | |||
| PAYX / Paychex, Inc. | 0,05 | -18,56 | 7,78 | -23,21 | 1,0400 | -0,3396 | |||
| AXP / American Express Company | 0,02 | -1,36 | 7,66 | 16,94 | 1,0242 | 0,1321 | |||
| FDS / FactSet Research Systems Inc. | 0,02 | 26,18 | 6,83 | 24,14 | 0,9132 | 0,1639 | |||
| GOOG / Alphabet Inc. | 0,03 | -0,17 | 6,18 | 13,35 | 0,8262 | 0,0837 | |||
| SYK / Stryker Corporation | 0,01 | 7,77 | 5,66 | 14,55 | 0,7563 | 0,0837 | |||
| UPS / United Parcel Service, Inc. | 0,05 | -11,02 | 5,50 | -18,35 | 0,7352 | -0,1818 | |||
| VTI / Vanguard Index Funds - Vanguard Total Stock Market ETF | 0,01 | 0,00 | 3,74 | 10,57 | 0,4993 | 0,0394 | |||
| VSEC / VSE Corporation | 0,02 | 0,00 | 3,15 | 9,15 | 0,4210 | 0,0281 | |||
| BRK.A / Berkshire Hathaway Inc. | 0,00 | 0,00 | 2,92 | -8,71 | 0,3895 | -0,0452 | |||
| SCHR / Schwab Strategic Trust - Schwab Intermediate-Term U.S. Treasury ETF | 0,11 | 0,62 | 2,79 | 1,31 | 0,3732 | -0,0020 | |||
| PG / The Procter & Gamble Company | 0,02 | -4,12 | 2,59 | -10,37 | 0,3455 | -0,0471 | |||
| JPM / JPMorgan Chase & Co. | 0,01 | -6,56 | 2,30 | 10,46 | 0,3078 | 0,0239 | |||
| DIS / The Walt Disney Company | 0,02 | 0,00 | 2,04 | 25,63 | 0,2732 | 0,0517 | |||
| SCHB / Schwab Strategic Trust - Schwab U.S. Broad Market ETF | 0,09 | 2,00 | 2,04 | 12,94 | 0,2730 | 0,0267 | |||
| LLY / Eli Lilly and Company | 0,00 | -7,90 | 1,98 | -13,08 | 0,2646 | -0,0455 | |||
| CEG / Constellation Energy Corporation | 0,01 | -4,95 | 1,85 | 52,18 | 0,2467 | 0,0816 | |||
| CVX / Chevron Corporation | 0,01 | 1,44 | 1,81 | -13,18 | 0,2422 | -0,0419 | |||
| PM / Philip Morris International Inc. | 0,01 | -4,49 | 1,46 | 9,56 | 0,1945 | 0,0137 | |||
| ABBV / AbbVie Inc. | 0,01 | 0,00 | 1,43 | -11,41 | 0,1910 | -0,0286 | |||
| BN / Brookfield Corporation | 0,02 | -0,50 | 1,37 | 17,45 | 0,1825 | 0,0242 | |||
| BAC / Bank of America Corporation | 0,03 | 0,00 | 1,30 | 13,40 | 0,1731 | 0,0176 | |||
| WMT / Walmart Inc. | 0,01 | 1,08 | 1,27 | 12,64 | 0,1703 | 0,0162 | |||
| TPL / Texas Pacific Land Corporation | 0,00 | 0,00 | 1,20 | -20,25 | 0,1605 | -0,0446 | |||
| MRK / Merck & Co., Inc. | 0,01 | -1,94 | 1,13 | -13,52 | 0,1513 | -0,0269 | |||
| ABT / Abbott Laboratories | 0,01 | -6,33 | 1,11 | -3,91 | 0,1478 | -0,0090 | |||
| MCD / McDonald's Corporation | 0,00 | 0,00 | 1,08 | -6,40 | 0,1446 | -0,0129 | |||
| HRL / Hormel Foods Corporation | 0,03 | -10,41 | 1,03 | -12,43 | 0,1375 | -0,0224 | |||
| BND / Vanguard Bond Index Funds - Vanguard Total Bond Market ETF | 0,01 | -3,24 | 1,02 | -2,95 | 0,1365 | -0,0068 | |||
| TT / Trane Technologies plc | 0,00 | 0,00 | 0,99 | 29,84 | 0,1327 | 0,0286 | |||
| WEC / WEC Energy Group, Inc. | 0,01 | -1,61 | 0,96 | -5,97 | 0,1283 | -0,0106 | |||
| OKE / ONEOK, Inc. | 0,01 | 6,50 | 0,88 | -12,43 | 0,1178 | -0,0192 | |||
| XOM / Exxon Mobil Corporation | 0,01 | -0,85 | 0,88 | -10,15 | 0,1171 | -0,0156 | |||
| ED / Consolidated Edison, Inc. | 0,01 | -1,36 | 0,86 | -10,51 | 0,1150 | -0,0159 | |||
| KO / The Coca-Cola Company | 0,01 | 0,00 | 0,85 | -1,17 | 0,1129 | -0,0035 | |||
| PSA / Public Storage | 0,00 | 0,00 | 0,82 | -2,03 | 0,1098 | -0,0043 | |||
| PLTR / Palantir Technologies Inc. | 0,01 | 0,00 | 0,82 | 61,46 | 0,1093 | 0,0404 | |||
| VIGI / Vanguard Whitehall Funds - Vanguard International Dividend Appreciation ETF | 0,01 | 1,68 | 0,80 | 10,59 | 0,1074 | 0,0084 | |||
| MDLZ / Mondelez International, Inc. | 0,01 | -1,00 | 0,80 | -1,59 | 0,1073 | -0,0038 | |||
| ITW / Illinois Tool Works Inc. | 0,00 | 0,00 | 0,75 | -0,27 | 0,0996 | -0,0022 | |||
| BK / The Bank of New York Mellon Corporation | 0,01 | 0,00 | 0,72 | 8,64 | 0,0959 | 0,0060 | |||
| COST / Costco Wholesale Corporation | 0,00 | -6,69 | 0,69 | -2,41 | 0,0922 | -0,0040 | |||
| PLD / Prologis, Inc. | 0,01 | -1,04 | 0,66 | -6,93 | 0,0879 | -0,0083 | |||
| D / Dominion Energy, Inc. | 0,01 | -1,30 | 0,65 | -0,46 | 0,0863 | -0,0021 | |||
| DUK / Duke Energy Corporation | 0,01 | 13,09 | 0,64 | 9,37 | 0,0858 | 0,0059 | |||
| SCHM / Schwab Strategic Trust - Schwab U.S. Mid-Cap ETF | 0,02 | 3,17 | 0,64 | 10,43 | 0,0849 | 0,0066 | |||
| NSC / Norfolk Southern Corporation | 0,00 | 0,00 | 0,63 | 8,01 | 0,0848 | 0,0049 | |||
| SCHA / Schwab Strategic Trust - Schwab U.S. Small-Cap ETF | 0,02 | 3,94 | 0,62 | 12,30 | 0,0831 | 0,0077 | |||
| HD / The Home Depot, Inc. | 0,00 | 0,00 | 0,59 | 0,00 | 0,0782 | -0,0014 | |||
| PFE / Pfizer Inc. | 0,02 | -6,37 | 0,56 | -10,47 | 0,0744 | -0,0102 | |||
| MO / Altria Group, Inc. | 0,01 | -1,02 | 0,53 | -3,31 | 0,0702 | -0,0037 | |||
| GLD / SPDR Gold Trust | 0,00 | 0,00 | 0,52 | 5,70 | 0,0694 | 0,0026 | |||
| APAM / Artisan Partners Asset Management Inc. | 0,01 | 0,00 | 0,51 | 13,39 | 0,0680 | 0,0069 | |||
| WELL / Welltower Inc. | 0,00 | -20,30 | 0,50 | -20,03 | 0,0667 | -0,0183 | |||
| TTE / TotalEnergies SE - Depositary Receipt (Common Stock) | 0,01 | -17,88 | 0,49 | -22,08 | 0,0652 | -0,0200 | |||
| NVS / Novartis AG - Depositary Receipt (Common Stock) | 0,00 | 0,00 | 0,40 | 8,63 | 0,0539 | 0,0033 | |||
| BAM / Brookfield Asset Management Ltd. | 0,01 | 0,00 | 0,40 | 14,16 | 0,0529 | 0,0057 | |||
| USB / U.S. Bancorp | 0,01 | -1,13 | 0,39 | 5,91 | 0,0527 | 0,0020 | |||
| PECO / Phillips Edison & Company, Inc. | 0,01 | 0,00 | 0,39 | -3,98 | 0,0516 | -0,0031 | |||
| OTTR / Otter Tail Corporation | 0,01 | 0,00 | 0,39 | -3,99 | 0,0515 | -0,0032 | |||
| LHX / L3Harris Technologies, Inc. | 0,00 | -6,38 | 0,37 | 12,20 | 0,0492 | 0,0045 | |||
| EXC / Exelon Corporation | 0,01 | -2,50 | 0,34 | -8,15 | 0,0452 | -0,0049 | |||
| QQQ / Invesco QQQ Trust, Series 1 | 0,00 | 0,00 | 0,33 | 17,67 | 0,0446 | 0,0060 | |||
| O / Realty Income Corporation | 0,01 | 0,00 | 0,33 | -0,91 | 0,0437 | -0,0011 | |||
| XLK / The Select Sector SPDR Trust - The Technology Select Sector SPDR Fund | 0,00 | 0,00 | 0,31 | 22,66 | 0,0420 | 0,0071 | |||
| AVGO / Broadcom Inc. | 0,00 | -8,34 | 0,31 | 51,47 | 0,0413 | 0,0134 | |||
| VIG / Vanguard Specialized Funds - Vanguard Dividend Appreciation ETF | 0,00 | 1,02 | 0,30 | 6,34 | 0,0404 | 0,0018 | |||
| YUM / Yum! Brands, Inc. | 0,00 | 0,00 | 0,30 | -5,70 | 0,0398 | -0,0033 | |||
| SPGI / S&P Global Inc. | 0,00 | 0,00 | 0,28 | 3,75 | 0,0371 | 0,0007 | |||
| FDX / FedEx Corporation | 0,00 | 0,00 | 0,27 | -6,80 | 0,0367 | -0,0034 | |||
| OGE / OGE Energy Corp. | 0,01 | 0,00 | 0,27 | -3,27 | 0,0356 | -0,0020 | |||
| CSW / CSW Industrials, Inc. | 0,00 | 0,00 | 0,26 | -1,53 | 0,0344 | -0,0012 | |||
| MKC / McCormick & Company, Incorporated | 0,00 | 0,00 | 0,26 | -7,91 | 0,0343 | -0,0036 | |||
| UNP / Union Pacific Corporation | 0,00 | 0,26 | 0,0342 | 0,0342 | |||||
| JNPR / Juniper Networks, Inc. | 0,01 | 0,00 | 0,25 | 10,27 | 0,0331 | 0,0025 | |||
| SPY / SPDR S&P 500 ETF | 0,00 | -11,24 | 0,24 | -1,61 | 0,0326 | -0,0013 | |||
| MWA / Mueller Water Products, Inc. | 0,01 | 0,00 | 0,24 | -5,56 | 0,0319 | -0,0025 | |||
| AUB / Atlantic Union Bankshares Corporation | 0,01 | 0,23 | 0,0311 | 0,0311 | |||||
| UVSP / Univest Financial Corporation | 0,01 | 0,00 | 0,23 | 5,99 | 0,0308 | 0,0012 | |||
| SMH / VanEck ETF Trust - VanEck Semiconductor ETF | 0,00 | 0,22 | 0,0298 | 0,0298 | |||||
| HON / Honeywell International Inc. | 0,00 | -3,29 | 0,22 | 6,31 | 0,0293 | 0,0012 | |||
| ISRG / Intuitive Surgical, Inc. | 0,00 | -29,77 | 0,22 | -23,05 | 0,0291 | -0,0094 | |||
| IWP / iShares Trust - iShares Russell Mid-Cap Growth ETF | 0,00 | 0,21 | 0,0282 | 0,0282 | |||||
| IBDX / iShares Trust - iShares iBonds Dec 2032 Term Corporate ETF | 0,01 | 0,00 | 0,21 | 1,48 | 0,0276 | -0,0002 | |||
| IBDY / iShares Trust - iShares iBonds Dec 2033 Term Corporate ETF | 0,01 | 0,00 | 0,21 | 1,48 | 0,0275 | -0,0001 | |||
| GS / The Goldman Sachs Group, Inc. | 0,00 | 0,21 | 0,0274 | 0,0274 | |||||
| MTG / MGIC Investment Corporation | 0,01 | 0,20 | 0,0269 | 0,0269 | |||||
| TSLA / Tesla, Inc. | 0,00 | 22,09 | 0,20 | 50,38 | 0,0267 | 0,0085 | |||
| MFC / Manulife Financial Corporation | 0,01 | -20,11 | 0,19 | -18,10 | 0,0255 | -0,0062 | |||
| BFB / Brown-Forman Corp. - Class B | 0,01 | -1,42 | 0,19 | -21,85 | 0,0250 | -0,0076 | |||
| MAR / Marriott International, Inc. | 0,00 | -23,34 | 0,18 | -12,25 | 0,0240 | -0,0038 | |||
| SCHD / Schwab Strategic Trust - Schwab U.S. Dividend Equity ETF | 0,01 | 0,00 | 0,18 | -5,32 | 0,0239 | -0,0018 | |||
| FMAO / Farmers & Merchants Bancorp, Inc. | 0,00 | 0,00 | 0,17 | -4,07 | 0,0221 | -0,0014 | |||
| BMY / Bristol-Myers Squibb Company | 0,00 | -22,91 | 0,16 | -41,73 | 0,0208 | -0,0154 | |||
| CMCSA / Comcast Corporation | 0,00 | 0,00 | 0,16 | -3,12 | 0,0208 | -0,0011 | |||
| KMB / Kimberly-Clark Corporation | 0,00 | 0,00 | 0,15 | -9,41 | 0,0206 | -0,0026 | |||
| EW / Edwards Lifesciences Corporation | 0,00 | 0,00 | 0,15 | 7,91 | 0,0202 | 0,0011 | |||
| BAH / Booz Allen Hamilton Holding Corporation | 0,00 | 0,00 | 0,15 | -0,68 | 0,0195 | -0,0004 | |||
| SASR / Sandy Spring Bancorp, Inc. | 0,00 | -100,00 | 0,00 | 0,0000 | |||||
| ULTA / Ulta Beauty, Inc. | 0,00 | -100,00 | 0,00 | 0,0000 | |||||
| BP / BP p.l.c. - Depositary Receipt (Common Stock) | 0,00 | -100,00 | 0,00 | 0,0000 | |||||
| BHRB / Burke & Herbert Financial Services Corp. | 0,00 | -100,00 | 0,00 | 0,0000 | |||||
| PHM / PulteGroup, Inc. | 0,00 | -100,00 | 0,00 | 0,0000 | |||||
| VTEB / Vanguard Municipal Bond Funds - Vanguard Tax-Exempt Bond ETF | 0,00 | -100,00 | 0,00 | 0,0000 |