Statistiques de base
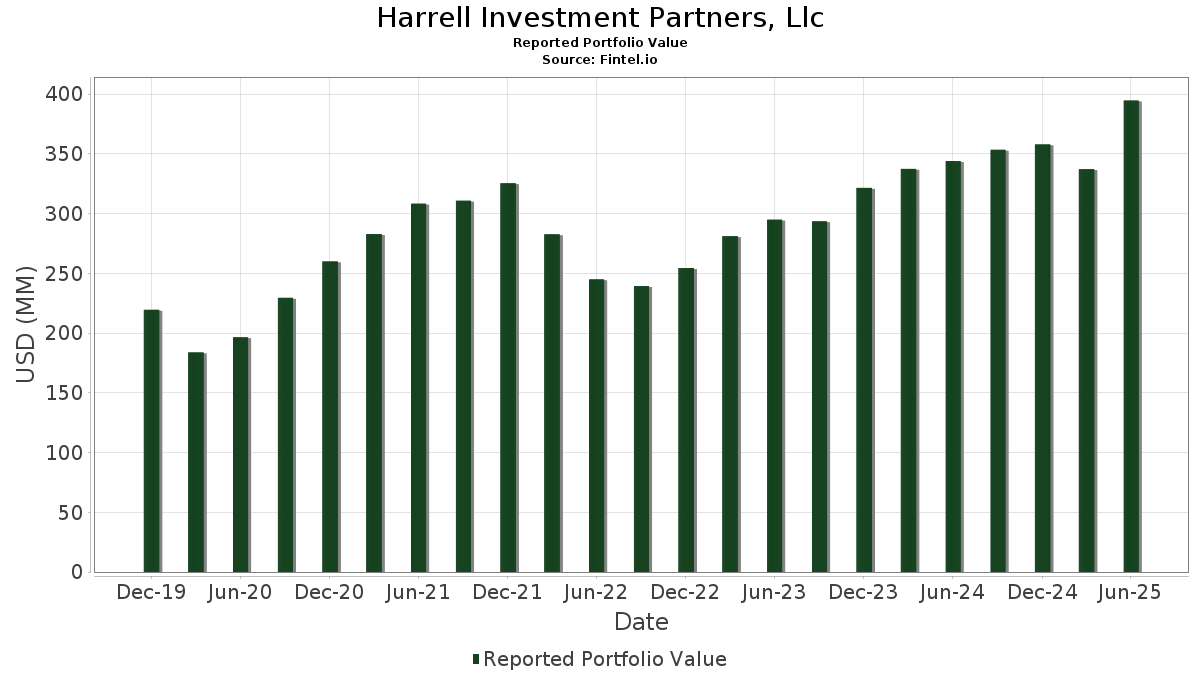
| Valeur du portefeuille | $ 394 604 208 |
| Positions actuelles | 124 |
Dernières positions, performances, ASG (à partir des dépôts 13F, 13D)
Harrell Investment Partners, Llc a déclaré un total de 124 positions dans ses derniers dépôts auprès de la SEC. La valeur la plus récente du portefeuille est calculée à 394 604 208 USD. Les actifs sous gestion réels (ASG) sont cette valeur plus les liquidités (qui ne sont pas divulguées). Les principales positions de Harrell Investment Partners, Llc sont Broadcom Inc. (US:AVGO) , NVIDIA Corporation (US:NVDA) , Apple Inc. (US:AAPL) , Microsoft Corporation (US:MSFT) , and JPMorgan Chase & Co. (US:JPM) . Les nouvelles positions de Harrell Investment Partners, Llc incluent Netflix, Inc. (US:NFLX) , Oracle Corporation (US:ORCL) , Vertex Pharmaceuticals Incorporated (US:VRTX) , Monster Beverage Corporation (US:MNST) , and Autodesk, Inc. (US:ADSK) .
Meilleures augmentations ce trimestre
Nous utilisons la variation de l'allocation du portefeuille car il s'agit de l'indicateur le plus significatif. Les changements peuvent être dus à des transactions ou à des variations de prix des actions.
| Titre | Actions (en millions) |
Valeur ($ en millions) |
% du portefeuille | ΔPortefeuille % |
|---|---|---|---|---|
| 0,14 | 22,59 | 5,7250 | 2,9441 | |
| 0,11 | 29,19 | 7,3977 | 2,7577 | |
| 0,03 | 6,07 | 1,5381 | 1,4427 | |
| 0,00 | 5,43 | 1,3754 | 1,3754 | |
| 0,04 | 19,54 | 4,9530 | 1,0687 | |
| 0,01 | 4,66 | 1,1812 | 1,0179 | |
| 0,02 | 3,79 | 0,9611 | 0,9611 | |
| 0,01 | 2,91 | 0,7385 | 0,7385 | |
| 0,04 | 9,47 | 2,4000 | 0,6109 | |
| 0,01 | 8,37 | 2,1204 | 0,5642 |
Principales baisses ce trimestre
Nous utilisons la variation de l'allocation du portefeuille car il s'agit de l'indicateur le plus significatif. Les changements peuvent être dus à des transactions ou à des variations de prix des actions.
| Titre | Actions (en millions) |
Valeur ($ en millions) |
% du portefeuille | ΔPortefeuille % |
|---|---|---|---|---|
| 0,06 | 2,88 | 0,7302 | -2,3033 | |
| 0,03 | 4,04 | 1,0227 | -2,0326 | |
| 0,02 | 6,19 | 1,5687 | -1,5749 | |
| 0,00 | 0,30 | 0,0754 | -1,5082 | |
| 0,02 | 1,92 | 0,4860 | -1,3880 | |
| 0,01 | 3,36 | 0,8515 | -1,2622 | |
| 0,11 | 22,53 | 5,7097 | -1,2219 | |
| 0,01 | 2,62 | 0,6646 | -1,0784 | |
| 0,02 | 1,76 | 0,4471 | -0,9667 | |
| 0,04 | 3,97 | 1,0071 | -0,8009 |
Déclarations 13F et dépôts de fonds
Ce formulaire a été déposé le 2025-07-15 pour la période de déclaration 2025-06-30. Cliquez sur l'icône du lien pour voir l'historique complet des transactions.
Mettre à niveau pour débloquer les données premium et exporter vers Excel ![]() .
.
| Titre | Type | Prix moyen de l'action | Actions (en millions) |
ΔActions (%) |
ΔActions (%) |
Valeur ($ en millions) |
Portefeuille (%) |
ΔPortefeuille (%) |
|
|---|---|---|---|---|---|---|---|---|---|
| AVGO / Broadcom Inc. | 0,11 | 13,34 | 29,19 | 86,60 | 7,3977 | 2,7577 | |||
| NVDA / NVIDIA Corporation | 0,14 | 65,28 | 22,59 | 140,94 | 5,7250 | 2,9441 | |||
| AAPL / Apple Inc. | 0,11 | 4,37 | 22,53 | -3,60 | 5,7097 | -1,2219 | |||
| MSFT / Microsoft Corporation | 0,04 | 12,63 | 19,54 | 49,24 | 4,9530 | 1,0687 | |||
| JPM / JPMorgan Chase & Co. | 0,06 | 3,18 | 16,03 | 21,96 | 4,0611 | 0,1637 | |||
| MSI / Motorola Solutions, Inc. | 0,03 | 10,31 | 11,73 | 5,93 | 2,9728 | -0,3115 | |||
| WMT / Walmart Inc. | 0,12 | 11,59 | 11,43 | 24,28 | 2,8970 | 0,1690 | |||
| ETN / Eaton Corporation plc | 0,03 | 8,25 | 10,68 | 42,16 | 2,7075 | 0,4786 | |||
| AMZN / Amazon.com, Inc. | 0,04 | 36,15 | 9,47 | 57,00 | 2,4000 | 0,6109 | |||
| META / Meta Platforms, Inc. | 0,01 | 24,52 | 8,37 | 59,46 | 2,1204 | 0,5642 | |||
| HD / The Home Depot, Inc. | 0,02 | 3,55 | 7,90 | 3,58 | 2,0014 | -0,2598 | |||
| GOOGL / Alphabet Inc. | 0,04 | 0,06 | 7,53 | 14,03 | 1,9094 | -0,0503 | |||
| CME / CME Group Inc. | 0,02 | 13,33 | 6,69 | 17,75 | 1,6949 | 0,0102 | |||
| V / Visa Inc. | 0,02 | 22,43 | 6,35 | 24,03 | 1,6104 | 0,0909 | |||
| XLK / The Select Sector SPDR Trust - The Technology Select Sector SPDR Fund | 0,02 | -52,38 | 6,19 | -41,60 | 1,5687 | -1,5749 | |||
| CB / Chubb Limited | 0,02 | 11,07 | 6,11 | 6,55 | 1,5496 | -0,1524 | |||
| VTI / Vanguard Index Funds - Vanguard Total Stock Market ETF | 0,02 | 3,51 | 6,11 | 14,47 | 1,5483 | -0,0347 | |||
| ABBV / AbbVie Inc. | 0,03 | 2 028,84 | 6,07 | 1 790,65 | 1,5381 | 1,4427 | |||
| JNJ / Johnson & Johnson | 0,04 | 8,21 | 5,87 | -0,32 | 1,4864 | -0,2590 | |||
| MPC / Marathon Petroleum Corporation | 0,04 | 8,74 | 5,82 | 23,98 | 1,4743 | 0,0826 | |||
| DRI / Darden Restaurants, Inc. | 0,03 | 15,63 | 5,81 | 21,32 | 1,4712 | 0,0519 | |||
| SLAB / Silicon Laboratories Inc. | 0,04 | 0,00 | 5,76 | 30,93 | 1,4589 | 0,1546 | |||
| NFLX / Netflix, Inc. | 0,00 | 5,43 | 1,3754 | 1,3754 | |||||
| JCI / Johnson Controls International plc | 0,05 | 9,76 | 5,39 | 44,74 | 1,3660 | 0,2613 | |||
| TT / Trane Technologies plc | 0,01 | -31,19 | 5,07 | -10,68 | 1,2848 | -0,3985 | |||
| ADI / Analog Devices, Inc. | 0,02 | 10,54 | 4,93 | 30,47 | 1,2504 | 0,1287 | |||
| APD / Air Products and Chemicals, Inc. | 0,02 | 3,62 | 4,84 | -0,90 | 1,2262 | -0,2219 | |||
| O / Realty Income Corporation | 0,08 | 13,89 | 4,67 | 13,09 | 1,1824 | -0,0410 | |||
| TSLA / Tesla, Inc. | 0,01 | 590,49 | 4,66 | 747,27 | 1,1812 | 1,0179 | |||
| XOM / Exxon Mobil Corporation | 0,04 | 45,98 | 4,51 | 32,31 | 1,1428 | 0,1320 | |||
| XLV / The Select Sector SPDR Trust - The Health Care Select Sector SPDR Fund | 0,03 | -57,57 | 4,04 | -60,83 | 1,0227 | -2,0326 | |||
| FIS / Fidelity National Information Services, Inc. | 0,05 | 14,04 | 4,03 | 24,35 | 1,0223 | 0,0599 | |||
| XLC / The Select Sector SPDR Trust - The Communication Services Select Sector SPDR Fund | 0,04 | -42,07 | 3,97 | -34,83 | 1,0071 | -0,8009 | |||
| MDT / Medtronic plc | 0,04 | -0,39 | 3,89 | -3,36 | 0,9849 | -0,2080 | |||
| VZ / Verizon Communications Inc. | 0,09 | 4,22 | 3,83 | -0,60 | 0,9695 | -0,1718 | |||
| ORCL / Oracle Corporation | 0,02 | 3,79 | 0,9611 | 0,9611 | |||||
| UNP / Union Pacific Corporation | 0,02 | 10,18 | 3,58 | 7,28 | 0,9072 | -0,0822 | |||
| CRM / Salesforce, Inc. | 0,01 | 4,55 | 3,48 | 6,24 | 0,8808 | -0,0895 | |||
| UNH / UnitedHealth Group Incorporated | 0,01 | -20,85 | 3,36 | -52,85 | 0,8515 | -1,2622 | |||
| CMI / Cummins Inc. | 0,01 | 18,60 | 3,28 | 23,96 | 0,8312 | 0,0463 | |||
| PEG / Public Service Enterprise Group Incorporated | 0,04 | 19,41 | 3,09 | 22,12 | 0,7823 | 0,0327 | |||
| CMCSA / Comcast Corporation | 0,08 | -11,11 | 3,03 | -14,02 | 0,7676 | -0,2774 | |||
| ANET / Arista Networks Inc | 0,03 | 117,09 | 2,94 | 186,74 | 0,7457 | 0,4412 | |||
| BA / The Boeing Company | 0,01 | 2,91 | 0,7385 | 0,7385 | |||||
| XLF / The Select Sector SPDR Trust - The Financial Select Sector SPDR Fund | 0,06 | -73,21 | 2,88 | -71,83 | 0,7302 | -2,3033 | |||
| XLY / The Select Sector SPDR Trust - The Consumer Discretionary Select Sector SPDR Fund | 0,01 | -59,46 | 2,62 | -55,38 | 0,6646 | -1,0784 | |||
| GOOG / Alphabet Inc. | 0,01 | 160,00 | 2,60 | 195,11 | 0,6584 | 0,3974 | |||
| NEE / NextEra Energy, Inc. | 0,04 | 13,35 | 2,46 | 11,01 | 0,6236 | -0,0339 | |||
| TXN / Texas Instruments Incorporated | 0,01 | 28,03 | 2,11 | 47,90 | 0,5354 | 0,1118 | |||
| VRTX / Vertex Pharmaceuticals Incorporated | 0,00 | 1,94 | 0,4910 | 0,4910 | |||||
| XLP / The Select Sector SPDR Trust - The Consumer Staples Select Sector SPDR Fund | 0,02 | -69,39 | 1,92 | -69,66 | 0,4860 | -1,3880 | |||
| MNST / Monster Beverage Corporation | 0,03 | 1,90 | 0,4813 | 0,4813 | |||||
| BBY / Best Buy Co., Inc. | 0,03 | -17,71 | 1,89 | -24,97 | 0,4783 | -0,2676 | |||
| ADSK / Autodesk, Inc. | 0,01 | 1,84 | 0,4661 | 0,4661 | |||||
| IGV / iShares Trust - iShares Expanded Tech-Software Sector ETF | 0,02 | -69,92 | 1,76 | -62,99 | 0,4471 | -0,9667 | |||
| KO / The Coca-Cola Company | 0,02 | -12,41 | 1,76 | -13,45 | 0,4450 | -0,1569 | |||
| DIS / The Walt Disney Company | 0,01 | 1,67 | 0,4243 | 0,4243 | |||||
| SHOP / Shopify Inc. | 0,01 | 1,62 | 0,4114 | 0,4114 | |||||
| TJX / The TJX Companies, Inc. | 0,01 | -50,46 | 1,52 | -49,79 | 0,3856 | -0,5129 | |||
| CVX / Chevron Corporation | 0,01 | -27,30 | 1,44 | -37,80 | 0,3651 | -0,3215 | |||
| LRCX / Lam Research Corporation | 0,01 | 133,20 | 1,13 | 212,40 | 0,2876 | 0,1798 | |||
| NXPI / NXP Semiconductors N.V. | 0,01 | -60,28 | 1,13 | -54,34 | 0,2867 | -0,4481 | |||
| REGN / Regeneron Pharmaceuticals, Inc. | 0,00 | 1,06 | 0,2674 | 0,2674 | |||||
| SBUX / Starbucks Corporation | 0,01 | 1,02 | 0,2584 | 0,2584 | |||||
| ISRG / Intuitive Surgical, Inc. | 0,00 | 0,98 | 0,2483 | 0,2483 | |||||
| EPD / Enterprise Products Partners L.P. - Limited Partnership | 0,03 | 0,93 | 0,2363 | 0,2363 | |||||
| NVO / Novo Nordisk A/S - Depositary Receipt (Common Stock) | 0,01 | 0,92 | 0,2342 | 0,2342 | |||||
| ICE / Intercontinental Exchange, Inc. | 0,01 | -2,12 | 0,92 | 4,06 | 0,2341 | -0,0291 | |||
| PG / The Procter & Gamble Company | 0,01 | 33,20 | 0,87 | 24,50 | 0,2204 | 0,0133 | |||
| VEU / Vanguard International Equity Index Funds - Vanguard FTSE All-World ex-US ETF | 0,01 | -8,05 | 0,85 | 1,91 | 0,2165 | -0,0321 | |||
| SEIC / SEI Investments Company | 0,01 | 0,81 | 0,2057 | 0,2057 | |||||
| IVV / iShares Trust - iShares Core S&P 500 ETF | 0,00 | -7,93 | 0,80 | 1,65 | 0,2026 | -0,0305 | |||
| VST / Vistra Corp. | 0,00 | 0,79 | 0,2008 | 0,2008 | |||||
| COP / ConocoPhillips | 0,01 | 162,53 | 0,78 | 124,28 | 0,1968 | 0,0941 | |||
| QCOM / QUALCOMM Incorporated | 0,00 | 0,77 | 0,1949 | 0,1949 | |||||
| NVS / Novartis AG - Depositary Receipt (Common Stock) | 0,01 | 0,76 | 0,1926 | 0,1926 | |||||
| VFH / Vanguard World Fund - Vanguard Financials ETF | 0,01 | 0,75 | 0,1889 | 0,1889 | |||||
| FDS / FactSet Research Systems Inc. | 0,00 | 0,74 | 0,1874 | 0,1874 | |||||
| XSW / SPDR Series Trust - SPDR S&P Software & Services ETF | 0,00 | 0,70 | 0,1786 | 0,1786 | |||||
| DE / Deere & Company | 0,00 | 0,70 | 0,1778 | 0,1778 | |||||
| HCA / HCA Healthcare, Inc. | 0,00 | 176,26 | 0,70 | 206,17 | 0,1762 | 0,1088 | |||
| EXPD / Expeditors International of Washington, Inc. | 0,01 | 0,69 | 0,1752 | 0,1752 | |||||
| SCHB / Schwab Strategic Trust - Schwab U.S. Broad Market ETF | 0,03 | 0,69 | 0,1747 | 0,1747 | |||||
| TMO / Thermo Fisher Scientific Inc. | 0,00 | 0,69 | 0,1738 | 0,1738 | |||||
| PYPL / PayPal Holdings, Inc. | 0,01 | 0,67 | 0,1695 | 0,1695 | |||||
| SPY / SPDR S&P 500 ETF | 0,00 | 0,00 | 0,65 | 10,56 | 0,1645 | -0,0098 | |||
| RJF / Raymond James Financial, Inc. | 0,00 | 0,39 | 0,64 | 10,94 | 0,1620 | -0,0091 | |||
| T / AT&T Inc. | 0,02 | -23,53 | 0,60 | -21,82 | 0,1528 | -0,0757 | |||
| PLTR / Palantir Technologies Inc. | 0,00 | 0,23 | 0,60 | 62,06 | 0,1518 | 0,0420 | |||
| SHEL / Shell plc - Depositary Receipt (Common Stock) | 0,01 | -9,50 | 0,58 | -12,95 | 0,1465 | -0,0507 | |||
| YUM / Yum! Brands, Inc. | 0,00 | 0,56 | 0,1412 | 0,1412 | |||||
| SPGI / S&P Global Inc. | 0,00 | -78,63 | 0,56 | -77,81 | 0,1412 | -0,6035 | |||
| WDAY / Workday, Inc. | 0,00 | 0,54 | 0,1381 | 0,1381 | |||||
| WM / Waste Management, Inc. | 0,00 | 0,53 | 0,1344 | 0,1344 | |||||
| SQ / Block, Inc. | 0,01 | 0,53 | 0,1341 | 0,1341 | |||||
| INTC / Intel Corporation | 0,02 | 3,24 | 0,52 | 1,96 | 0,1316 | -0,0196 | |||
| VPL / Vanguard International Equity Index Funds - Vanguard FTSE Pacific ETF | 0,01 | -52,83 | 0,51 | -46,56 | 0,1299 | -0,1543 | |||
| AMAT / Applied Materials, Inc. | 0,00 | 62,24 | 0,49 | 105,02 | 0,1242 | 0,0532 | |||
| EEMA / iShares, Inc. - iShares MSCI Emerging Markets Asia ETF | 0,01 | 0,48 | 0,1212 | 0,1212 | |||||
| LLY / Eli Lilly and Company | 0,00 | -17,97 | 0,46 | -22,77 | 0,1163 | -0,0597 | |||
| NKE / NIKE, Inc. | 0,01 | 0,45 | 0,1147 | 0,1147 | |||||
| FI / Fiserv, Inc. | 0,00 | -80,46 | 0,43 | -84,77 | 0,1097 | -0,7315 | |||
| BRK.B / Berkshire Hathaway Inc. | 0,00 | 0,00 | 0,39 | -8,82 | 0,0997 | -0,0282 | |||
| MU / Micron Technology, Inc. | 0,00 | 0,38 | 0,0968 | 0,0968 | |||||
| ILMN / Illumina, Inc. | 0,00 | 0,37 | 0,0948 | 0,0948 | |||||
| BABA / Alibaba Group Holding Limited - Depositary Receipt (Common Stock) | 0,00 | 0,37 | 0,0931 | 0,0931 | |||||
| STEL / Stellar Bancorp, Inc. | 0,01 | 0,00 | 0,36 | 1,13 | 0,0910 | -0,0143 | |||
| CSCO / Cisco Systems, Inc. | 0,00 | 0,34 | 0,0860 | 0,0860 | |||||
| PSX / Phillips 66 | 0,00 | 63,27 | 0,32 | 57,71 | 0,0804 | 0,0207 | |||
| PM / Philip Morris International Inc. | 0,00 | -68,13 | 0,31 | -63,51 | 0,0782 | -0,1722 | |||
| ALL / The Allstate Corporation | 0,00 | -80,52 | 0,31 | -81,07 | 0,0779 | -0,4034 | |||
| MRK / Merck & Co., Inc. | 0,00 | -93,68 | 0,30 | -94,44 | 0,0754 | -1,5082 | |||
| HON / Honeywell International Inc. | 0,00 | 0,30 | 0,0750 | 0,0750 | |||||
| IVE / iShares Trust - iShares S&P 500 Value ETF | 0,00 | 29,21 | 0,29 | 33,02 | 0,0725 | 0,0085 | |||
| AZO / AutoZone, Inc. | 0,00 | 0,29 | 0,0724 | 0,0724 | |||||
| ELF / e.l.f. Beauty, Inc. | 0,00 | 0,27 | 0,0687 | 0,0687 | |||||
| GS / The Goldman Sachs Group, Inc. | 0,00 | 0,25 | 0,0623 | 0,0623 | |||||
| SAH / Sonic Automotive, Inc. | 0,00 | 0,24 | 0,0608 | 0,0608 | |||||
| AMD / Advanced Micro Devices, Inc. | 0,00 | -76,93 | 0,23 | -68,25 | 0,0580 | -0,1550 | |||
| TRGP / Targa Resources Corp. | 0,00 | -1,62 | 0,22 | -14,67 | 0,0561 | -0,0208 | |||
| VT / Vanguard International Equity Index Funds - Vanguard Total World Stock ETF | 0,00 | 0,22 | 0,0545 | 0,0545 | |||||
| MS / Morgan Stanley | 0,00 | 0,21 | 0,0528 | 0,0528 | |||||
| YUMC / Yum China Holdings, Inc. | 0,00 | 0,21 | 0,0520 | 0,0520 | |||||
| LPRO / Open Lending Corporation | 0,02 | 0,00 | 0,04 | -29,51 | 0,0110 | -0,0073 | |||
| LHX / L3Harris Technologies, Inc. | 0,00 | -100,00 | 0,00 | 0,0000 | |||||
| FANG / Diamondback Energy, Inc. | 0,00 | -100,00 | 0,00 | 0,0000 | |||||
| VCSA / Vacasa, Inc. | 0,00 | -100,00 | 0,00 | 0,0000 | |||||
| AEP / American Electric Power Company, Inc. | 0,00 | -100,00 | 0,00 | 0,0000 | |||||
| EW / Edwards Lifesciences Corporation | 0,00 | -100,00 | 0,00 | 0,0000 | |||||
| EL / The Estée Lauder Companies Inc. | 0,00 | -100,00 | 0,00 | 0,0000 | |||||
| ABT / Abbott Laboratories | 0,00 | -100,00 | 0,00 | 0,0000 | |||||
| IQV / IQVIA Holdings Inc. | 0,00 | -100,00 | 0,00 | 0,0000 | |||||
| PGR / The Progressive Corporation | 0,00 | -100,00 | 0,00 | 0,0000 | |||||
| DXCM / DexCom, Inc. | 0,00 | -100,00 | 0,00 | 0,0000 | |||||
| APH / Amphenol Corporation | 0,00 | -100,00 | 0,00 | 0,0000 | |||||
| AIG / American International Group, Inc. | 0,00 | -100,00 | 0,00 | 0,0000 | |||||
| STE / STERIS plc | 0,00 | -100,00 | 0,00 | 0,0000 | |||||
| CDNS / Cadence Design Systems, Inc. | 0,00 | -100,00 | 0,00 | 0,0000 | |||||
| SNPS / Synopsys, Inc. | 0,00 | -100,00 | 0,00 | -100,00 | -0,0661 | ||||
| CMG / Chipotle Mexican Grill, Inc. | 0,00 | -100,00 | 0,00 | 0,0000 |