Statistiques de base
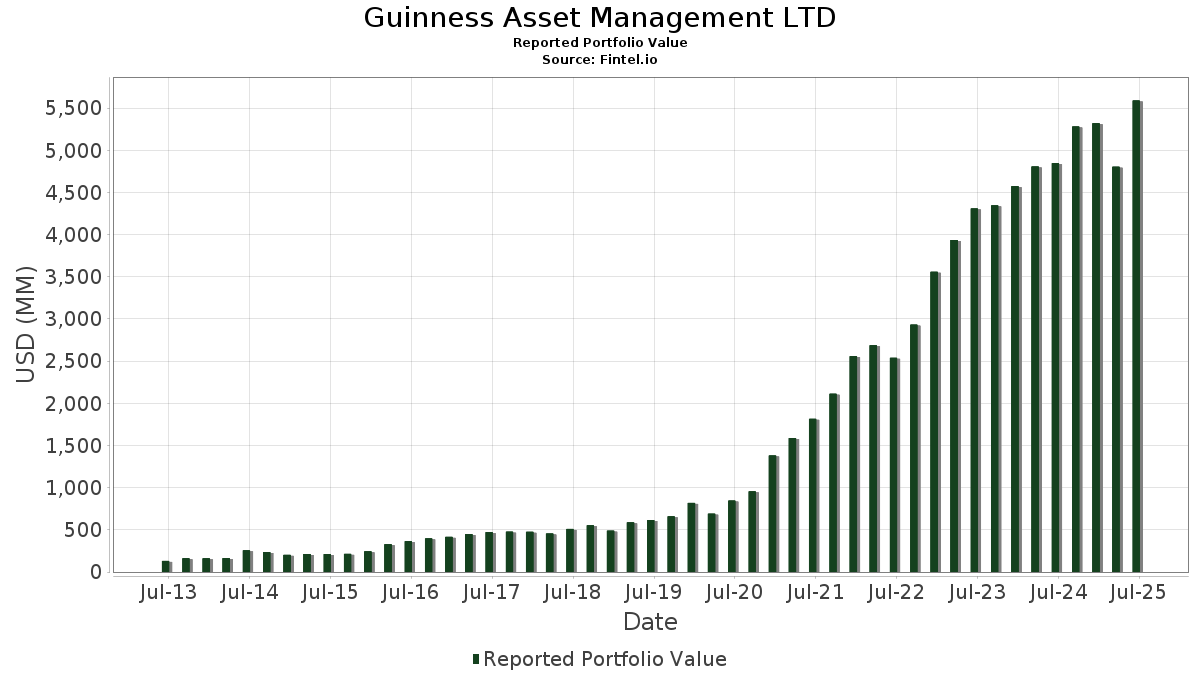
| Valeur du portefeuille | $ 5 588 618 413 |
| Positions actuelles | 103 |
Dernières positions, performances, ASG (à partir des dépôts 13F, 13D)
Guinness Asset Management LTD a déclaré un total de 103 positions dans ses derniers dépôts auprès de la SEC. La valeur la plus récente du portefeuille est calculée à 5 588 618 413 USD. Les actifs sous gestion réels (ASG) sont cette valeur plus les liquidités (qui ne sont pas divulguées). Les principales positions de Guinness Asset Management LTD sont Broadcom Inc. (US:AVGO) , Cisco Systems, Inc. (US:CSCO) , CME Group Inc. (US:CME) , Microsoft Corporation (US:MSFT) , and BlackRock, Inc. (US:BLK) . Les nouvelles positions de Guinness Asset Management LTD incluent MSCI Inc. (US:MSCI) , Ralliant Corporation (US:RAL) , .
Meilleures augmentations ce trimestre
Nous utilisons la variation de l'allocation du portefeuille car il s'agit de l'indicateur le plus significatif. Les changements peuvent être dus à des transactions ou à des variations de prix des actions.
| Titre | Actions (en millions) |
Valeur ($ en millions) |
% du portefeuille | ΔPortefeuille % |
|---|---|---|---|---|
| 1,12 | 309,67 | 5,5412 | 1,6564 | |
| 0,55 | 274,53 | 4,9123 | 0,6342 | |
| 1,90 | 253,55 | 4,5369 | 0,2620 | |
| 0,39 | 88,77 | 1,5885 | 0,2271 | |
| 0,36 | 57,66 | 1,0318 | 0,1914 | |
| 0,72 | 71,51 | 1,2796 | 0,1149 | |
| 0,50 | 48,42 | 0,8664 | 0,0982 | |
| 0,06 | 52,43 | 0,9382 | 0,0929 | |
| 0,04 | 59,69 | 1,0681 | 0,0755 | |
| 0,07 | 54,72 | 0,9791 | 0,0731 |
Principales baisses ce trimestre
Nous utilisons la variation de l'allocation du portefeuille car il s'agit de l'indicateur le plus significatif. Les changements peuvent être dus à des transactions ou à des variations de prix des actions.
| Titre | Actions (en millions) |
Valeur ($ en millions) |
% du portefeuille | ΔPortefeuille % |
|---|---|---|---|---|
| 4,39 | 304,45 | 5,4477 | -45,9539 | |
| 2,37 | 250,19 | 4,4767 | -44,1217 | |
| 1,21 | 223,72 | 4,0032 | -1,1756 | |
| 0,83 | 266,02 | 4,7600 | -1,1229 | |
| 1,38 | 210,36 | 3,7642 | -0,9180 | |
| 1,63 | 237,09 | 4,2424 | -0,9128 | |
| 1,22 | 161,36 | 2,8873 | -0,8713 | |
| 1,23 | 196,54 | 3,5168 | -0,7920 | |
| 1,93 | 190,51 | 3,4089 | -0,6641 | |
| 3,18 | 225,29 | 4,0312 | -0,6440 |
Déclarations 13F et dépôts de fonds
Ce formulaire a été déposé le 2025-08-01 pour la période de déclaration 2025-06-30. Cliquez sur l'icône du lien pour voir l'historique complet des transactions.
Mettre à niveau pour débloquer les données premium et exporter vers Excel ![]() .
.
| Titre | Type | Prix moyen de l'action | Actions (en millions) |
ΔActions (%) |
ΔActions (%) |
Valeur ($ en millions) |
Portefeuille (%) |
ΔPortefeuille (%) |
|
|---|---|---|---|---|---|---|---|---|---|
| AVGO / Broadcom Inc. | 1,12 | 0,91 | 309,67 | 65,94 | 5,5412 | 1,6564 | |||
| CSCO / Cisco Systems, Inc. | 4,39 | 15,93 | 304,45 | 30,29 | 5,4477 | -45,9539 | |||
| CME / CME Group Inc. | 1,02 | 1,48 | 281,98 | 5,48 | 5,0456 | -0,5191 | |||
| MSFT / Microsoft Corporation | 0,55 | 0,84 | 274,53 | 33,58 | 4,9123 | 0,6342 | |||
| BLK / BlackRock, Inc. | 0,26 | 1,48 | 273,58 | 12,51 | 4,8952 | -0,1665 | |||
| AJG / Arthur J. Gallagher & Co. | 0,83 | 1,48 | 266,02 | -5,87 | 4,7600 | -1,1229 | |||
| EMR / Emerson Electric Co. | 1,90 | 1,48 | 253,55 | 23,47 | 4,5369 | 0,2620 | |||
| AFL / Aflac Incorporated | 2,37 | 19,40 | 250,19 | 13,24 | 4,4767 | -44,1217 | |||
| PAYX / Paychex, Inc. | 1,63 | 1,48 | 237,09 | -4,26 | 4,2424 | -0,9128 | |||
| KO / The Coca-Cola Company | 3,18 | 1,48 | 225,29 | 0,31 | 4,0312 | -0,6440 | |||
| ABBV / AbbVie Inc. | 1,21 | 1,48 | 223,72 | -10,07 | 4,0032 | -1,1756 | |||
| JNJ / Johnson & Johnson | 1,38 | 1,48 | 210,36 | -6,47 | 3,7642 | -0,9180 | |||
| TXN / Texas Instruments Incorporated | 1,01 | 1,48 | 208,95 | 17,35 | 3,7389 | 0,0322 | |||
| ITW / Illinois Tool Works Inc. | 0,84 | 1,48 | 206,52 | 1,23 | 3,6953 | -0,5516 | |||
| MDLZ / Mondelez International, Inc. | 3,03 | 1,48 | 204,38 | 0,91 | 3,6571 | -0,5589 | |||
| PG / The Procter & Gamble Company | 1,23 | 1,48 | 196,54 | -5,05 | 3,5168 | -0,7920 | |||
| OTIS / Otis Worldwide Corporation | 1,93 | 1,48 | 190,51 | -2,63 | 3,4089 | -0,6641 | |||
| PEP / PepsiCo, Inc. | 1,22 | 1,48 | 161,36 | -10,63 | 2,8873 | -0,8713 | |||
| TSM / Taiwan Semiconductor Manufacturing Company Limited - Depositary Receipt (Common Stock) | 0,39 | -0,74 | 88,77 | 35,75 | 1,5885 | 0,2271 | |||
| APH / Amphenol Corporation | 0,72 | -15,07 | 71,51 | 27,81 | 1,2796 | 0,1149 | |||
| NFLX / Netflix, Inc. | 0,04 | -12,81 | 59,69 | 25,18 | 1,0681 | 0,0755 | |||
| NVDA / NVIDIA Corporation | 0,36 | -2,01 | 57,66 | 42,83 | 1,0318 | 0,1914 | |||
| INTU / Intuit Inc. | 0,07 | -2,01 | 54,72 | 25,73 | 0,9791 | 0,0731 | |||
| META / Meta Platforms, Inc. | 0,07 | -2,01 | 54,62 | 25,48 | 0,9774 | 0,0712 | |||
| MA / Mastercard Incorporated | 0,09 | -2,01 | 52,55 | 0,46 | 0,9404 | -0,1487 | |||
| FTXP / Foothills Exploration, Inc. | 0,06 | -2,01 | 52,43 | 29,13 | 0,9382 | 0,0929 | |||
| ICE / Intercontinental Exchange, Inc. | 0,28 | -2,01 | 51,72 | 4,19 | 0,9255 | -0,1079 | |||
| V / Visa Inc. | 0,15 | -2,01 | 51,70 | -0,72 | 0,9252 | -0,1589 | |||
| LRCX / Lam Research Corporation | 0,50 | -2,01 | 48,42 | 31,21 | 0,8664 | 0,0982 | |||
| AMZN / Amazon.com, Inc. | 0,22 | -2,01 | 48,07 | 13,01 | 0,8602 | -0,0253 | |||
| AME / AMETEK, Inc. | 0,26 | -2,01 | 47,39 | 3,03 | 0,8480 | -0,1095 | |||
| GOOGL / Alphabet Inc. | 0,24 | -2,01 | 42,64 | 11,71 | 0,7630 | -0,0316 | |||
| ROP / Roper Technologies, Inc. | 0,07 | -1,05 | 41,51 | -4,85 | 0,7427 | -0,1654 | |||
| AMAT / Applied Materials, Inc. | 0,22 | -2,00 | 41,14 | 23,64 | 0,7361 | 0,0435 | |||
| DHR / Danaher Corporation | 0,20 | 14,37 | 38,86 | 10,22 | 0,6953 | -0,0386 | |||
| AAPL / Apple Inc. | 0,17 | -2,01 | 35,89 | -9,49 | 0,6421 | -0,1832 | |||
| CRM / Salesforce, Inc. | 0,13 | -2,01 | 35,60 | -0,43 | 0,6371 | -0,1073 | |||
| ADBE / Adobe Inc. | 0,09 | -2,01 | 33,36 | -1,16 | 0,5970 | -0,1057 | |||
| TMO / Thermo Fisher Scientific Inc. | 0,07 | -2,01 | 30,02 | -20,15 | 0,5372 | -0,2454 | |||
| HUBB / Hubbell Incorporated | 0,04 | -20,09 | 15,64 | -1,39 | 0,2798 | -0,0503 | |||
| NEE / NextEra Energy, Inc. | 0,20 | -25,39 | 13,92 | -26,85 | 0,2491 | -0,1470 | |||
| ITRI / Itron, Inc. | 0,10 | -28,19 | 12,97 | -9,71 | 0,2321 | -0,0670 | |||
| ORA / Ormat Technologies, Inc. | 0,15 | -25,21 | 12,20 | -11,45 | 0,2183 | -0,0685 | |||
| CVX / Chevron Corporation | 0,08 | -9,62 | 11,64 | -22,32 | 0,2082 | -0,1036 | |||
| XOM / Exxon Mobil Corporation | 0,11 | -9,90 | 11,57 | -17,71 | 0,2071 | -0,0856 | |||
| KMI / Kinder Morgan, Inc. | 0,34 | -9,85 | 9,88 | -7,27 | 0,1767 | -0,0450 | |||
| IMO / Imperial Oil Limited | 0,12 | -9,88 | 9,54 | -0,54 | 0,1708 | -0,0290 | |||
| NTES / NetEase, Inc. - Depositary Receipt (Common Stock) | 0,07 | -25,85 | 9,49 | -3,05 | 0,1698 | -0,0339 | |||
| FSLR / First Solar, Inc. | 0,06 | -20,28 | 9,44 | 4,04 | 0,1689 | -0,0200 | |||
| VLO / Valero Energy Corporation | 0,07 | -9,84 | 9,20 | -8,00 | 0,1646 | -0,0435 | |||
| SU / Suncor Energy Inc. | 0,25 | -9,84 | 9,19 | -12,43 | 0,1645 | -0,0540 | |||
| COP / ConocoPhillips | 0,10 | -9,86 | 9,10 | -22,31 | 0,1629 | -0,0810 | |||
| CSL / Carlisle Companies Incorporated | 0,02 | -20,18 | 9,03 | -12,46 | 0,1616 | -0,0532 | |||
| QCOM / QUALCOMM Incorporated | 0,06 | 11,64 | 8,82 | 15,75 | 0,1579 | -0,0008 | |||
| ON / ON Semiconductor Corporation | 0,16 | -20,20 | 8,65 | 2,82 | 0,1548 | -0,0203 | |||
| ENB / Enbridge Inc. | 0,19 | -9,85 | 8,47 | -8,10 | 0,1515 | -0,0403 | |||
| IBP / Installed Building Products, Inc. | 0,05 | -20,47 | 8,37 | -16,37 | 0,1498 | -0,0586 | |||
| EOG / EOG Resources, Inc. | 0,07 | -9,84 | 8,11 | -15,32 | 0,1451 | -0,0542 | |||
| CNQ / Canadian Natural Resources Limited | 0,25 | -9,68 | 7,94 | -7,45 | 0,1421 | -0,0365 | |||
| OC / Owens Corning | 0,06 | -20,46 | 7,58 | -23,38 | 0,1356 | -0,0703 | |||
| FANG / Diamondback Energy, Inc. | 0,05 | -9,85 | 6,44 | -21,77 | 0,1153 | -0,0562 | |||
| SLB / Schlumberger Limited | 0,17 | -9,85 | 5,85 | -26,93 | 0,1047 | -0,0620 | |||
| BKR / Baker Hughes Company | 0,15 | -9,84 | 5,73 | -21,05 | 0,1025 | -0,0486 | |||
| CVE / Cenovus Energy Inc. | 0,42 | -9,86 | 5,72 | -11,43 | 0,1023 | -0,0321 | |||
| DVN / Devon Energy Corporation | 0,16 | -9,86 | 5,18 | -22,64 | 0,0927 | -0,0467 | |||
| HAL / Halliburton Company | 0,22 | -9,85 | 4,54 | -27,12 | 0,0812 | -0,0484 | |||
| CSIQ / Canadian Solar Inc. | 0,39 | -31,48 | 4,35 | -12,61 | 0,0777 | -0,0258 | |||
| AMRC / Ameresco, Inc. | 0,24 | -20,08 | 3,68 | 0,44 | 0,0659 | -0,0104 | |||
| ENPH / Enphase Energy, Inc. | 0,08 | -26,55 | 3,06 | -53,00 | 0,0548 | -0,0808 | |||
| HLX / Helix Energy Solutions Group, Inc. | 0,22 | -9,72 | 1,36 | -32,22 | 0,0243 | -0,0174 | |||
| NDAQ / Nasdaq, Inc. | 0,01 | -2,34 | 0,87 | 15,17 | 0,0156 | -0,0002 | |||
| ARES / Ares Management Corporation | 0,00 | 2,36 | 0,82 | 20,83 | 0,0147 | 0,0006 | |||
| AMP / Ameriprise Financial, Inc. | 0,00 | 2,41 | 0,82 | 12,85 | 0,0146 | -0,0004 | |||
| STT / State Street Corporation | 0,01 | 2,37 | 0,77 | 21,75 | 0,0137 | 0,0006 | |||
| KKR / KKR & Co. Inc. | 0,01 | 2,38 | 0,72 | 17,76 | 0,0128 | 0,0002 | |||
| BX / Blackstone Inc. | 0,00 | 2,38 | 0,70 | 9,52 | 0,0126 | -0,0008 | |||
| CG / The Carlyle Group Inc. | 0,01 | 2,37 | 0,64 | 20,83 | 0,0114 | 0,0004 | |||
| RJF / Raymond James Financial, Inc. | 0,00 | 2,36 | 0,63 | 13,08 | 0,0113 | -0,0003 | |||
| AMG / Affiliated Managers Group, Inc. | 0,00 | 2,37 | 0,63 | 19,85 | 0,0113 | 0,0003 | |||
| APAM / Artisan Partners Asset Management Inc. | 0,01 | 2,37 | 0,48 | 16,11 | 0,0087 | -0,0000 | |||
| VRT / Vertiv Holdings Co | 0,00 | -18,76 | 0,44 | 44,41 | 0,0079 | 0,0015 | |||
| ANET / Arista Networks Inc | 0,00 | -6,26 | 0,43 | 23,56 | 0,0077 | 0,0005 | |||
| MSCI / MSCI Inc. | 0,00 | 0,43 | 0,0076 | 0,0076 | |||||
| ZBRA / Zebra Technologies Corporation | 0,00 | 18,31 | 0,42 | 29,27 | 0,0076 | 0,0008 | |||
| EW / Edwards Lifesciences Corporation | 0,01 | -15,25 | 0,42 | -8,42 | 0,0076 | -0,0021 | |||
| BEN / Franklin Resources, Inc. | 0,02 | 2,37 | 0,42 | 27,03 | 0,0076 | 0,0006 | |||
| ENTG / Entegris, Inc. | 0,01 | 11,53 | 0,42 | 2,94 | 0,0075 | -0,0010 | |||
| MPWR / Monolithic Power Systems, Inc. | 0,00 | -24,70 | 0,42 | -4,99 | 0,0075 | -0,0017 | |||
| CDNS / Cadence Design Systems, Inc. | 0,00 | -11,48 | 0,42 | 7,24 | 0,0074 | -0,0006 | |||
| ADUS / Addus HomeCare Corporation | 0,00 | 0,39 | 0,41 | 17,00 | 0,0074 | 0,0000 | |||
| TER / Teradyne, Inc. | 0,00 | 15,98 | 0,41 | 26,30 | 0,0074 | 0,0006 | |||
| RVTY / Revvity, Inc. | 0,00 | 6,19 | 0,41 | -2,85 | 0,0073 | -0,0014 | |||
| KEYS / Keysight Technologies, Inc. | 0,00 | -9,52 | 0,41 | -0,98 | 0,0073 | -0,0013 | |||
| A / Agilent Technologies, Inc. | 0,00 | 8,59 | 0,40 | 9,54 | 0,0072 | -0,0004 | |||
| WMS / Advanced Drainage Systems, Inc. | 0,00 | -3,98 | 0,40 | 1,52 | 0,0072 | -0,0010 | |||
| IEX / IDEX Corporation | 0,00 | 8,03 | 0,39 | 4,79 | 0,0071 | -0,0008 | |||
| TROW / T. Rowe Price Group, Inc. | 0,00 | 2,37 | 0,35 | 7,38 | 0,0063 | -0,0005 | |||
| FTV / Fortive Corporation | 0,01 | -7,05 | 0,29 | -33,79 | 0,0052 | -0,0040 | |||
| BIDU / Baidu, Inc. - Depositary Receipt (Common Stock) | 0,00 | 2,98 | 0,24 | -4,07 | 0,0042 | -0,0009 | |||
| JD / JD.com, Inc. - Depositary Receipt (Common Stock) | 0,00 | 4,89 | 0,13 | -17,22 | 0,0023 | -0,0009 | |||
| RAL / Ralliant Corporation | 0,00 | 0,09 | 0,0015 | 0,0015 | |||||
| BABA / Alibaba Group Holding Limited - Depositary Receipt (Common Stock) | 0,00 | 13,28 | 0,06 | -3,08 | 0,0011 | -0,0002 | |||
| ATHM / Autohome Inc. - Depositary Receipt (Common Stock) | 0,00 | 13,35 | 0,06 | 5,56 | 0,0010 | -0,0001 | |||
| TTEK / Tetra Tech, Inc. | 0,00 | -100,00 | 0,00 | -100,00 | -0,0068 |