Statistiques de base
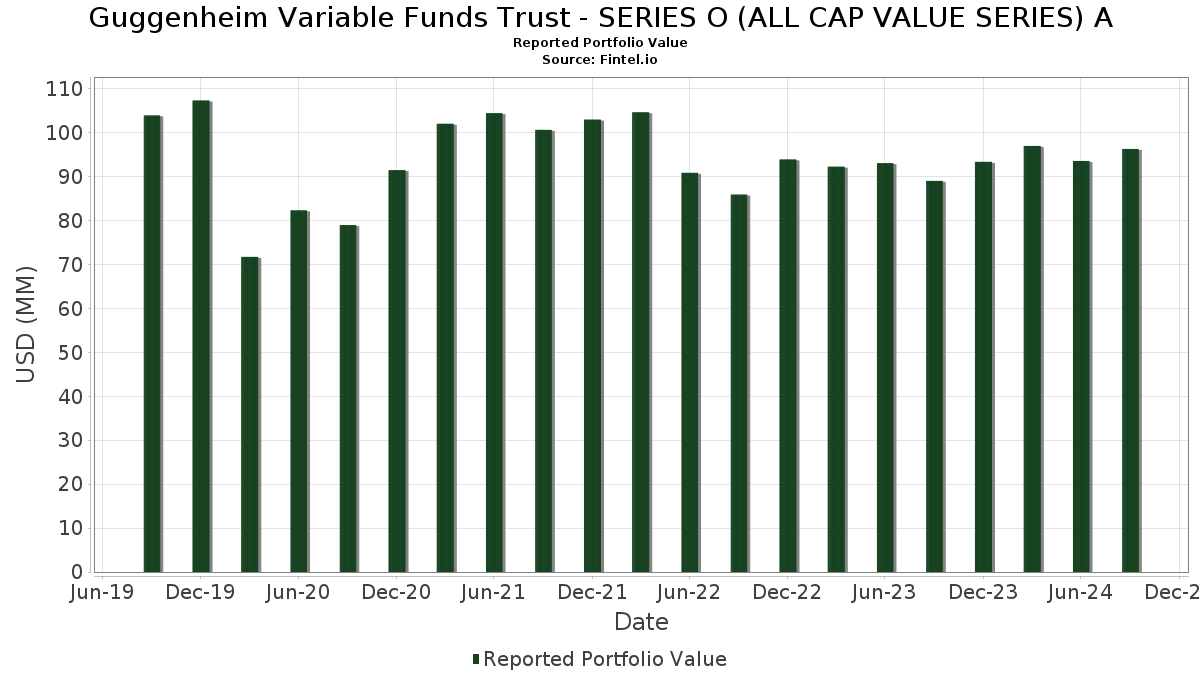
| Valeur du portefeuille | $ 96 297 120 |
| Positions actuelles | 138 |
Dernières positions, performances, ASG (à partir des dépôts 13F, 13D)
Guggenheim Variable Funds Trust - SERIES O (ALL CAP VALUE SERIES) A a déclaré un total de 138 positions dans ses derniers dépôts auprès de la SEC. La valeur la plus récente du portefeuille est calculée à 96 297 120 USD. Les actifs sous gestion réels (ASG) sont cette valeur plus les liquidités (qui ne sont pas divulguées). Les principales positions de Guggenheim Variable Funds Trust - SERIES O (ALL CAP VALUE SERIES) A sont Berkshire Hathaway Inc. (US:BRK.B) , Dreyfus Treasury Securities Cash Management - Dreyfus Treasury Securities Cash Management Institutional Shares (US:DIRXX) , Chevron Corporation (US:CVX) , OGE Energy Corp. (US:OGE) , and Walmart Inc. (US:WMT) . Les nouvelles positions de Guggenheim Variable Funds Trust - SERIES O (ALL CAP VALUE SERIES) A incluent Ferguson Enterprises Inc. (US:FERG) , .
Meilleures augmentations ce trimestre
Nous utilisons la variation de l'allocation du portefeuille car il s'agit de l'indicateur le plus significatif. Les changements peuvent être dus à des transactions ou à des variations de prix des actions.
| Titre | Actions (en millions) |
Valeur ($ en millions) |
% du portefeuille | ΔPortefeuille % |
|---|---|---|---|---|
| 0,00 | 0,70 | 0,7255 | 0,7255 | |
| 0,02 | 1,98 | 2,0522 | 0,2813 | |
| 0,01 | 1,00 | 1,0362 | 0,2431 | |
| 0,01 | 1,11 | 1,1486 | 0,2299 | |
| 0,01 | 1,53 | 1,5860 | 0,2237 | |
| 0,05 | 2,03 | 2,1077 | 0,2199 | |
| 0,02 | 1,81 | 1,8798 | 0,2119 | |
| 0,03 | 1,74 | 1,8036 | 0,2076 | |
| 0,02 | 1,31 | 1,3577 | 0,2056 | |
| 0,00 | 2,10 | 2,1797 | 0,1970 |
Principales baisses ce trimestre
Nous utilisons la variation de l'allocation du portefeuille car il s'agit de l'indicateur le plus significatif. Les changements peuvent être dus à des transactions ou à des variations de prix des actions.
| Titre | Actions (en millions) |
Valeur ($ en millions) |
% du portefeuille | ΔPortefeuille % |
|---|---|---|---|---|
| 2,08 | 2,08 | 2,1646 | -1,0229 | |
| 0,00 | 0,50 | 0,5181 | -0,3798 | |
| 0,03 | 1,95 | 2,0243 | -0,3595 | |
| 0,01 | 1,69 | 1,7530 | -0,3419 | |
| 0,01 | 1,29 | 1,3350 | -0,2637 | |
| 0,01 | 2,07 | 2,1466 | -0,1998 | |
| 0,01 | 0,27 | 0,2837 | -0,1905 | |
| 0,00 | 0,82 | 0,8538 | -0,1827 | |
| 0,01 | 1,22 | 1,2703 | -0,1655 | |
| 0,01 | 1,34 | 1,3887 | -0,1640 |
Déclarations 13F et dépôts de fonds
Ce formulaire a été déposé le 2024-11-29 pour la période de déclaration 2024-09-30. Cliquez sur l'icône du lien pour voir l'historique complet des transactions.
Mettre à niveau pour débloquer les données premium et exporter vers Excel ![]() .
.
| Titre | Type | Prix moyen de l'action | Actions (en millions) |
ΔActions (%) |
ΔActions (%) |
Valeur ($ en millions) |
Portefeuille (%) |
ΔPortefeuille (%) |
|
|---|---|---|---|---|---|---|---|---|---|
| BRK.B / Berkshire Hathaway Inc. | 0,00 | 0,00 | 2,10 | 13,15 | 2,1797 | 0,1970 | |||
| DIRXX / Dreyfus Treasury Securities Cash Management - Dreyfus Treasury Securities Cash Management Institutional Shares | 2,08 | -30,11 | 2,08 | -30,11 | 2,1646 | -1,0229 | |||
| CVX / Chevron Corporation | 0,01 | 0,00 | 2,07 | -5,83 | 2,1466 | -0,1998 | |||
| OGE / OGE Energy Corp. | 0,05 | 0,00 | 2,03 | 14,89 | 2,1077 | 0,2199 | |||
| WMT / Walmart Inc. | 0,02 | 0,00 | 1,98 | 19,25 | 2,0522 | 0,2813 | |||
| JEF / Jefferies Financial Group Inc. | 0,03 | -29,35 | 1,95 | -12,60 | 2,0243 | -0,3595 | |||
| JPM / JPMorgan Chase & Co. | 0,01 | 0,00 | 1,92 | 4,24 | 1,9899 | 0,0255 | |||
| PNW / Pinnacle West Capital Corporation | 0,02 | 0,00 | 1,81 | 16,03 | 1,8798 | 0,2119 | |||
| BAC / Bank of America Corporation | 0,05 | 0,00 | 1,80 | -0,22 | 1,8727 | -0,0589 | |||
| VZ / Verizon Communications Inc. | 0,04 | 0,00 | 1,75 | 8,88 | 1,8206 | 0,1001 | |||
| UNM / Unum Group | 0,03 | 0,00 | 1,74 | 16,34 | 1,8036 | 0,2076 | |||
| FANG / Diamondback Energy, Inc. | 0,01 | 0,00 | 1,69 | -13,88 | 1,7530 | -0,3419 | |||
| LDOS / Leidos Holdings, Inc. | 0,01 | 0,00 | 1,68 | 11,75 | 1,7493 | 0,1381 | |||
| INGR / Ingredion Incorporated | 0,01 | 0,00 | 1,53 | 19,86 | 1,5860 | 0,2237 | |||
| FHN / First Horizon Corporation | 0,09 | 0,00 | 1,46 | -1,55 | 1,5197 | -0,0685 | |||
| TDY / Teledyne Technologies Incorporated | 0,00 | 0,00 | 1,35 | 12,82 | 1,3983 | 0,1226 | |||
| COP / ConocoPhillips | 0,01 | 0,00 | 1,34 | -7,98 | 1,3887 | -0,1640 | |||
| EHC / Encompass Health Corporation | 0,01 | 0,00 | 1,33 | 12,68 | 1,3841 | 0,1196 | |||
| EIX / Edison International | 0,02 | 0,00 | 1,31 | 21,24 | 1,3577 | 0,2056 | |||
| TER / Teradyne, Inc. | 0,01 | -4,85 | 1,29 | -14,10 | 1,3350 | -0,2637 | |||
| JNJ / Johnson & Johnson | 0,01 | 0,00 | 1,26 | 10,93 | 1,3073 | 0,0939 | |||
| GOOGL / Alphabet Inc. | 0,01 | 0,00 | 1,22 | -8,94 | 1,2703 | -0,1655 | |||
| EEFT / Euronet Worldwide, Inc. | 0,01 | 0,00 | 1,22 | -4,08 | 1,2699 | -0,0932 | |||
| AMT / American Tower Corporation | 0,00 | 0,00 | 1,16 | 19,63 | 1,2028 | 0,1682 | |||
| KNX / Knight-Swift Transportation Holdings Inc. | 0,02 | 0,00 | 1,15 | 8,07 | 1,1964 | 0,0571 | |||
| FTNT / Fortinet, Inc. | 0,01 | 0,00 | 1,11 | 28,75 | 1,1486 | 0,2299 | |||
| AEIS / Advanced Energy Industries, Inc. | 0,01 | 0,00 | 1,09 | -3,20 | 1,1310 | -0,0719 | |||
| WLK / Westlake Corporation | 0,01 | 0,00 | 1,07 | 3,79 | 1,1084 | 0,0092 | |||
| MSFT / Microsoft Corporation | 0,00 | 0,00 | 1,00 | -3,65 | 1,0406 | -0,0718 | |||
| PYPL / PayPal Holdings, Inc. | 0,01 | 0,00 | 1,00 | 34,37 | 1,0362 | 0,2431 | |||
| TSN / Tyson Foods, Inc. | 0,02 | 0,00 | 0,99 | 4,23 | 1,0242 | 0,0130 | |||
| WFC / Wells Fargo & Company | 0,02 | 0,00 | 0,98 | -4,87 | 1,0148 | -0,0832 | |||
| RS / Reliance, Inc. | 0,00 | 0,00 | 0,97 | 1,36 | 1,0072 | -0,0164 | |||
| HEES / H&E Equipment Services, Inc. | 0,02 | 0,00 | 0,96 | 10,21 | 0,9981 | 0,0661 | |||
| MGPI / MGP Ingredients, Inc. | 0,01 | -3,97 | 0,93 | 7,56 | 0,9605 | 0,0406 | |||
| FI / Fiserv, Inc. | 0,01 | 0,00 | 0,92 | 20,47 | 0,9541 | 0,1395 | |||
| NUE / Nucor Corporation | 0,01 | 0,00 | 0,89 | -4,94 | 0,9204 | -0,0756 | |||
| LEVI / Levi Strauss & Co. | 0,04 | 0,00 | 0,89 | 13,03 | 0,9193 | 0,0826 | |||
| MDT / Medtronic plc | 0,01 | 0,00 | 0,87 | 14,44 | 0,9054 | 0,0908 | |||
| JCI / Johnson Controls International plc | 0,01 | 0,00 | 0,85 | 16,80 | 0,8813 | 0,1045 | |||
| EXC / Exelon Corporation | 0,02 | 0,00 | 0,84 | 17,13 | 0,8741 | 0,1063 | |||
| T / AT&T Inc. | 0,04 | 0,00 | 0,83 | 15,12 | 0,8623 | 0,0914 | |||
| HUM / Humana Inc. | 0,00 | 0,00 | 0,82 | -15,17 | 0,8538 | -0,1827 | |||
| KMI / Kinder Morgan, Inc. | 0,04 | 0,00 | 0,81 | 11,23 | 0,8432 | 0,0626 | |||
| EVRG / Evergy, Inc. | 0,01 | 0,00 | 0,79 | 16,96 | 0,8170 | 0,0988 | |||
| MA / Mastercard Incorporated | 0,00 | 0,00 | 0,78 | 11,86 | 0,8137 | 0,0656 | |||
| EQT / EQT Corporation | 0,02 | 0,00 | 0,78 | -0,89 | 0,8084 | -0,0313 | |||
| CW / Curtiss-Wright Corporation | 0,00 | 0,00 | 0,77 | 21,23 | 0,8013 | 0,1214 | |||
| FCX / Freeport-McMoRan Inc. | 0,02 | 0,00 | 0,76 | 2,83 | 0,7913 | -0,0015 | |||
| EXP / Eagle Materials Inc. | 0,00 | 0,00 | 0,75 | 32,16 | 0,7774 | 0,1726 | |||
| HUN / Huntsman Corporation | 0,03 | 0,00 | 0,73 | 6,43 | 0,7559 | 0,0239 | |||
| KO / The Coca-Cola Company | 0,01 | 0,00 | 0,72 | 12,87 | 0,7469 | 0,0661 | |||
| LVS / Las Vegas Sands Corp. | 0,01 | 0,00 | 0,72 | 13,65 | 0,7442 | 0,0710 | |||
| FERG / Ferguson Enterprises Inc. | 0,00 | 0,70 | 0,7255 | 0,7255 | |||||
| COG / Cabot Oil & Gas Corp. | 0,03 | 0,00 | 0,70 | -10,19 | 0,7234 | -0,1056 | |||
| HCA / HCA Healthcare, Inc. | 0,00 | 0,00 | 0,69 | 26,46 | 0,7204 | 0,1343 | |||
| MRK / Merck & Co., Inc. | 0,01 | 0,00 | 0,69 | -8,27 | 0,7151 | -0,0872 | |||
| SNV / Synovus Financial Corp. | 0,02 | 0,00 | 0,67 | 10,58 | 0,6956 | 0,0486 | |||
| SF / Stifel Financial Corp. | 0,01 | -15,58 | 0,67 | -5,77 | 0,6954 | -0,0643 | |||
| SCHW / The Charles Schwab Corporation | 0,01 | 0,00 | 0,67 | -12,15 | 0,6914 | -0,1176 | |||
| AMAT / Applied Materials, Inc. | 0,00 | 0,00 | 0,66 | -14,36 | 0,6877 | -0,1389 | |||
| ADM / Archer-Daniels-Midland Company | 0,01 | 0,00 | 0,65 | -1,22 | 0,6746 | -0,0279 | |||
| DUK / Duke Energy Corporation | 0,01 | 0,00 | 0,65 | 15,10 | 0,6732 | 0,0709 | |||
| KEX / Kirby Corporation | 0,01 | 0,00 | 0,65 | 2,37 | 0,6730 | -0,0043 | |||
| MRO / Marathon Oil Corporation | 0,02 | 0,00 | 0,65 | -7,04 | 0,6722 | -0,0726 | |||
| ORI / Old Republic International Corporation | 0,02 | -18,63 | 0,62 | -6,75 | 0,6467 | -0,0669 | |||
| GPK / Graphic Packaging Holding Company | 0,02 | 0,00 | 0,61 | 12,87 | 0,6381 | 0,0564 | |||
| LHX / L3Harris Technologies, Inc. | 0,00 | 0,00 | 0,60 | 5,98 | 0,6263 | 0,0178 | |||
| NXPI / NXP Semiconductors N.V. | 0,00 | 0,00 | 0,59 | -10,77 | 0,6108 | -0,0940 | |||
| DD / DuPont de Nemours, Inc. | 0,01 | 0,00 | 0,58 | 10,65 | 0,6047 | 0,0426 | |||
| QCOM / QUALCOMM Incorporated | 0,00 | 0,00 | 0,57 | -14,58 | 0,5964 | -0,1225 | |||
| FTXP / Foothills Exploration, Inc. | 0,00 | 0,00 | 0,57 | -6,07 | 0,5950 | -0,0570 | |||
| DAL / Delta Air Lines, Inc. | 0,01 | 0,00 | 0,57 | 7,01 | 0,5871 | 0,0227 | |||
| ITGR / Integer Holdings Corporation | 0,00 | 0,00 | 0,56 | 12,32 | 0,5774 | 0,0481 | |||
| TMUS / T-Mobile US, Inc. | 0,00 | 0,00 | 0,54 | 16,99 | 0,5657 | 0,0687 | |||
| LEA / Lear Corporation | 0,00 | 0,00 | 0,53 | -4,47 | 0,5553 | -0,0427 | |||
| GS / The Goldman Sachs Group, Inc. | 0,00 | 0,00 | 0,51 | 9,36 | 0,5346 | 0,0320 | |||
| CROX / Crocs, Inc. | 0,00 | -40,15 | 0,50 | -40,60 | 0,5181 | -0,3798 | |||
| CH1300646267 / Bunge Global SA | 0,01 | 0,00 | 0,50 | -9,47 | 0,5164 | -0,0707 | |||
| COHR / Coherent Corp. | 0,01 | 0,00 | 0,49 | 22,58 | 0,5136 | 0,0828 | |||
| SAIC / Science Applications International Corporation | 0,00 | 0,00 | 0,49 | 18,51 | 0,5123 | 0,0673 | |||
| JLL / Jones Lang LaSalle Incorporated | 0,00 | 0,00 | 0,46 | 31,43 | 0,4779 | 0,1037 | |||
| ARE / Alexandria Real Estate Equities, Inc. | 0,00 | 0,00 | 0,45 | 1,58 | 0,4688 | -0,0064 | |||
| MTSI / MACOM Technology Solutions Holdings, Inc. | 0,00 | 0,00 | 0,45 | -0,22 | 0,4647 | -0,0144 | |||
| PB / Prosperity Bancshares, Inc. | 0,01 | 0,00 | 0,44 | 17,74 | 0,4556 | 0,0578 | |||
| SUM / Summit Materials, Inc. | 0,01 | 0,00 | 0,44 | 6,85 | 0,4538 | 0,0157 | |||
| LUV / Southwest Airlines Co. | 0,01 | 0,00 | 0,44 | 3,80 | 0,4538 | 0,0029 | |||
| AVNT / Avient Corporation | 0,01 | 0,00 | 0,43 | 15,12 | 0,4514 | 0,0484 | |||
| STAG / STAG Industrial, Inc. | 0,01 | 0,00 | 0,43 | 8,31 | 0,4471 | 0,0226 | |||
| ACA / Arcosa, Inc. | 0,00 | 0,00 | 0,42 | 13,55 | 0,4361 | 0,0410 | |||
| RDNT / RadNet, Inc. | 0,01 | 0,00 | 0,38 | 17,79 | 0,3996 | 0,0504 | |||
| ENOV / Enovis Corporation | 0,01 | 0,00 | 0,38 | -4,79 | 0,3930 | -0,0317 | |||
| MSM / MSC Industrial Direct Co., Inc. | 0,00 | 0,00 | 0,38 | 8,70 | 0,3896 | 0,0201 | |||
| FRME / First Merchants Corporation | 0,01 | 0,00 | 0,36 | 11,73 | 0,3763 | 0,0297 | |||
| MDU / MDU Resources Group, Inc. | 0,01 | 0,00 | 0,36 | 9,12 | 0,3731 | 0,0215 | |||
| ESAB / ESAB Corporation | 0,00 | 0,00 | 0,36 | 12,54 | 0,3731 | 0,0320 | |||
| BWA / BorgWarner Inc. | 0,01 | 0,00 | 0,32 | 12,59 | 0,3345 | 0,0287 | |||
| STC / Stewart Information Services Corporation | 0,00 | 0,00 | 0,31 | 20,23 | 0,3218 | 0,0467 | |||
| RRC / Range Resources Corporation | 0,01 | 0,00 | 0,30 | -8,31 | 0,3099 | -0,0378 | |||
| AMKR / Amkor Technology, Inc. | 0,01 | 0,00 | 0,30 | -23,51 | 0,3075 | -0,1064 | |||
| CENTA / Central Garden & Pet Company | 0,01 | 0,00 | 0,28 | -4,75 | 0,2922 | -0,0241 | |||
| DIS / The Walt Disney Company | 0,00 | 0,00 | 0,27 | -3,18 | 0,2847 | -0,0177 | |||
| AAP / Advance Auto Parts, Inc. | 0,01 | 0,00 | 0,27 | -38,37 | 0,2837 | -0,1905 | |||
| LIVN / LivaNova PLC | 0,01 | 0,00 | 0,27 | -4,26 | 0,2811 | -0,0207 | |||
| SAH / Sonic Automotive, Inc. | 0,00 | 0,00 | 0,27 | 7,26 | 0,2766 | 0,0115 | |||
| ICFI / ICF International, Inc. | 0,00 | 0,00 | 0,27 | 12,29 | 0,2757 | 0,0231 | |||
| XOM / Exxon Mobil Corporation | 0,00 | 0,00 | 0,26 | 1,93 | 0,2746 | -0,0029 | |||
| MUR / Murphy Oil Corporation | 0,01 | 0,00 | 0,26 | -18,18 | 0,2718 | -0,0701 | |||
| AOS / A. O. Smith Corporation | 0,00 | 0,00 | 0,25 | 10,00 | 0,2629 | 0,0166 | |||
| MP / MP Materials Corp. | 0,01 | 0,00 | 0,25 | 39,20 | 0,2545 | 0,0656 | |||
| LBRT / Liberty Energy Inc. | 0,01 | 0,00 | 0,24 | -8,61 | 0,2539 | -0,0320 | |||
| CIEN / Ciena Corporation | 0,00 | 0,00 | 0,24 | 27,75 | 0,2539 | 0,0495 | |||
| WETF / Wisdomtree Investments Inc | 0,02 | 0,00 | 0,24 | 0,83 | 0,2534 | -0,0053 | |||
| TALO / Talos Energy Inc. | 0,02 | 0,00 | 0,24 | -14,84 | 0,2503 | -0,0521 | |||
| ASH / Ashland Inc. | 0,00 | 0,00 | 0,24 | -8,17 | 0,2457 | -0,0290 | |||
| APLE / Apple Hospitality REIT, Inc. | 0,02 | 0,00 | 0,23 | 2,23 | 0,2379 | -0,0018 | |||
| PFE / Pfizer Inc. | 0,01 | 0,00 | 0,23 | 3,17 | 0,2377 | 0,0012 | |||
| AX / Axos Financial, Inc. | 0,00 | 0,00 | 0,22 | 10,00 | 0,2292 | 0,0148 | |||
| LFUS / Littelfuse, Inc. | 0,00 | 0,00 | 0,21 | 3,94 | 0,2198 | 0,0018 | |||
| CALX / Calix, Inc. | 0,01 | 0,00 | 0,21 | 9,52 | 0,2158 | 0,0129 | |||
| AN / AutoNation, Inc. | 0,00 | 0,00 | 0,20 | 12,15 | 0,2110 | 0,0176 | |||
| PKE / Park Aerospace Corp. | 0,01 | 0,00 | 0,19 | -5,00 | 0,1983 | -0,0160 | |||
| BKH / Black Hills Corporation | 0,00 | 0,00 | 0,18 | 12,20 | 0,1914 | 0,0161 | |||
| TKR / The Timken Company | 0,00 | 0,00 | 0,18 | 5,36 | 0,1839 | 0,0040 | |||
| PTEN / Patterson-UTI Energy, Inc. | 0,02 | 0,00 | 0,16 | -26,36 | 0,1690 | -0,0665 | |||
| SON / Sonoco Products Company | 0,00 | 0,00 | 0,16 | 8,11 | 0,1662 | 0,0074 | |||
| GTES / Gates Industrial Corporation plc | 0,01 | 0,00 | 0,15 | 10,79 | 0,1605 | 0,0117 | |||
| AZTA / Azenta, Inc. | 0,00 | 0,00 | 0,13 | -7,64 | 0,1383 | -0,0163 | |||
| LAKE / Lakeland Industries, Inc. | 0,01 | 0,00 | 0,13 | -12,00 | 0,1373 | -0,0240 | |||
| INTC / Intel Corporation | 0,00 | 0,00 | 0,11 | -24,32 | 0,1166 | -0,0418 | |||
| CERT / Certara, Inc. | 0,01 | 0,00 | 0,10 | -15,83 | 0,1056 | -0,0229 | |||
| CCS / Century Communities, Inc. | 0,00 | 0,00 | 0,09 | 25,68 | 0,0975 | 0,0179 | |||
| NWL / Newell Brands Inc. | 0,01 | 0,00 | 0,09 | 19,18 | 0,0913 | 0,0129 | |||
| CAG / Conagra Brands, Inc. | 0,00 | 0,00 | 0,08 | 13,89 | 0,0857 | 0,0086 | |||
| US7587501039 / Regal-Beloit Corp. | 0,00 | 0,00 | 0,08 | 22,58 | 0,0791 | 0,0127 | |||
| MEI / Methode Electronics, Inc. | 0,01 | 0,00 | 0,07 | 16,07 | 0,0678 | 0,0074 | |||
| LUNA / Luna Innovations Incorporated | 0,02 | 0,00 | 0,05 | -27,03 | 0,0565 | -0,0227 | |||
| SRI / Stoneridge, Inc. | 0,00 | 0,00 | 0,04 | -30,36 | 0,0411 | -0,0192 |