Statistiques de base
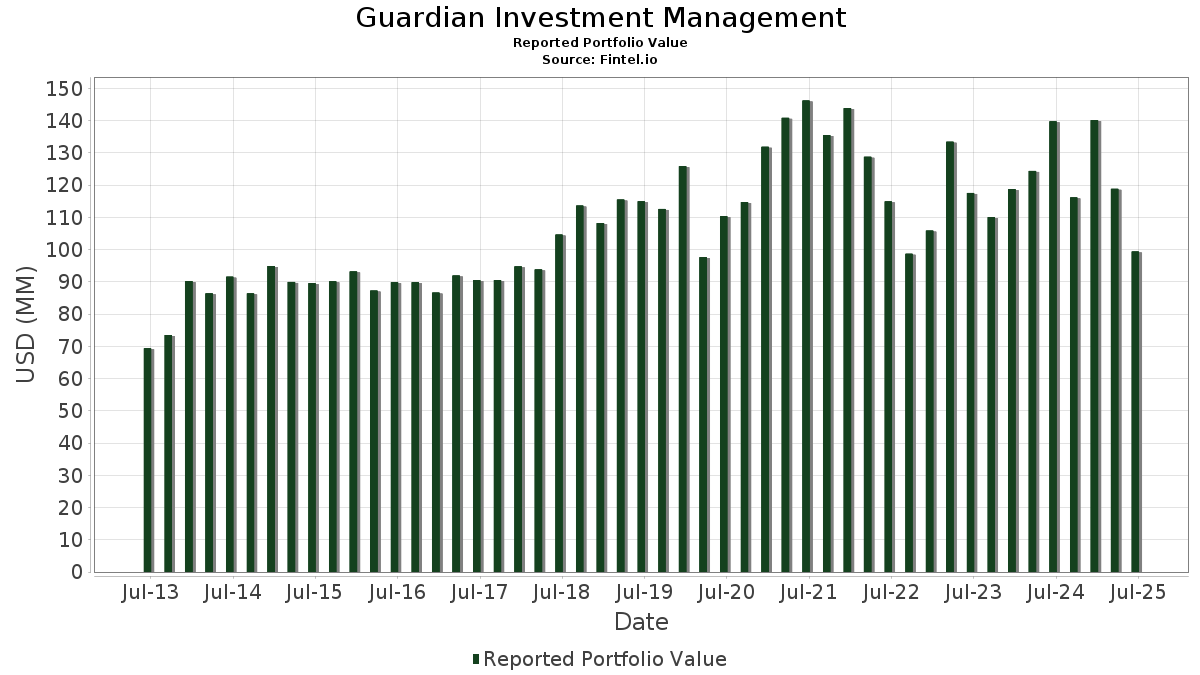
| Valeur du portefeuille | $ 99 371 050 |
| Positions actuelles | 51 |
Dernières positions, performances, ASG (à partir des dépôts 13F, 13D)
Guardian Investment Management a déclaré un total de 51 positions dans ses derniers dépôts auprès de la SEC. La valeur la plus récente du portefeuille est calculée à 99 371 050 USD. Les actifs sous gestion réels (ASG) sont cette valeur plus les liquidités (qui ne sont pas divulguées). Les principales positions de Guardian Investment Management sont Apple Inc. (US:AAPL) , Danaher Corporation (US:DHR) , Amgen Inc. (US:AMGN) , Costco Wholesale Corporation (US:COST) , and Microsoft Corporation (US:MSFT) .
Meilleures augmentations ce trimestre
Nous utilisons la variation de l'allocation du portefeuille car il s'agit de l'indicateur le plus significatif. Les changements peuvent être dus à des transactions ou à des variations de prix des actions.
| Titre | Actions (en millions) |
Valeur ($ en millions) |
% du portefeuille | ΔPortefeuille % |
|---|---|---|---|---|
| 0,06 | 10,03 | 10,0957 | 6,4728 | |
| 0,01 | 5,00 | 5,0278 | 1,4115 | |
| 0,05 | 2,74 | 2,7594 | 1,2486 | |
| 0,01 | 4,15 | 4,1767 | 1,1770 | |
| 0,07 | 3,42 | 3,4414 | 0,9383 | |
| 0,01 | 1,73 | 1,7435 | 0,8512 | |
| 0,00 | 1,45 | 1,4596 | 0,7473 | |
| 0,00 | 1,94 | 1,9483 | 0,6750 | |
| 0,00 | 0,89 | 0,8935 | 0,5332 | |
| 0,01 | 1,49 | 1,4971 | 0,4994 |
Principales baisses ce trimestre
Nous utilisons la variation de l'allocation du portefeuille car il s'agit de l'indicateur le plus significatif. Les changements peuvent être dus à des transactions ou à des variations de prix des actions.
| Titre | Actions (en millions) |
Valeur ($ en millions) |
% du portefeuille | ΔPortefeuille % |
|---|---|---|---|---|
| 0,00 | 0,00 | -0,9266 | ||
| 0,00 | 1,42 | 1,4323 | -0,6207 | |
| 0,01 | 1,66 | 1,6690 | -0,4696 | |
| 0,08 | 16,13 | 16,2321 | -0,3584 | |
| 0,01 | 2,45 | 2,4650 | -0,2704 | |
| 0,01 | 2,65 | 2,6702 | -0,2218 | |
| 0,01 | 0,67 | 0,6698 | -0,1709 | |
| 0,01 | 0,44 | 0,4425 | -0,0631 | |
| 0,00 | 0,56 | 0,5649 | -0,0308 | |
| 0,03 | 1,03 | 1,0340 | -0,0086 |
Déclarations 13F et dépôts de fonds
Ce formulaire a été déposé le 2025-07-17 pour la période de déclaration 2025-06-30. Cliquez sur l'icône du lien pour voir l'historique complet des transactions.
Mettre à niveau pour débloquer les données premium et exporter vers Excel ![]() .
.
| Titre | Type | Prix moyen de l'action | Actions (en millions) |
ΔActions (%) |
ΔActions (%) |
Valeur ($ en millions) |
Portefeuille (%) |
ΔPortefeuille (%) |
|
|---|---|---|---|---|---|---|---|---|---|
| AAPL / Apple Inc. | 0,08 | -11,41 | 16,13 | -18,17 | 16,2321 | -0,3584 | |||
| DHR / Danaher Corporation | 0,06 | 49,04 | 10,03 | 133,09 | 10,0957 | 6,4728 | |||
| AMGN / Amgen Inc. | 0,02 | 2,75 | 5,22 | -7,92 | 5,2530 | 0,4818 | |||
| COST / Costco Wholesale Corporation | 0,01 | 11,09 | 5,00 | 16,29 | 5,0278 | 1,4115 | |||
| MSFT / Microsoft Corporation | 0,01 | -12,11 | 4,15 | 16,47 | 4,1767 | 1,1770 | |||
| BAC / Bank of America Corporation | 0,07 | 1,40 | 3,42 | 14,96 | 3,4414 | 0,9383 | |||
| WMT / Walmart Inc. | 0,03 | -24,24 | 3,41 | -15,63 | 3,4292 | 0,0303 | |||
| QS / QuantumScape Corporation | 0,05 | 336,21 | 2,74 | 52,76 | 2,7594 | 1,2486 | |||
| ABBV / AbbVie Inc. | 0,01 | -12,84 | 2,65 | -22,79 | 2,6702 | -0,2218 | |||
| CVX / Chevron Corporation | 0,02 | -1,11 | 2,55 | -15,36 | 2,5617 | 0,0304 | |||
| JPM / JPMorgan Chase & Co. | 0,01 | -36,23 | 2,45 | -24,62 | 2,4650 | -0,2704 | |||
| JNJ / Johnson & Johnson | 0,02 | -7,56 | 2,45 | -14,80 | 2,4629 | 0,0450 | |||
| GE / General Electric Company | 0,01 | -1,10 | 2,19 | 0,00 | 2,2005 | 0,3601 | |||
| CAT / Caterpillar Inc. | 0,00 | 8,72 | 1,94 | 28,04 | 1,9483 | 0,6750 | |||
| AMZN / Amazon.com, Inc. | 0,01 | 41,73 | 1,73 | 63,40 | 1,7435 | 0,8512 | |||
| PG / The Procter & Gamble Company | 0,01 | -30,18 | 1,66 | -34,72 | 1,6690 | -0,4696 | |||
| KKR / KKR & Co. Inc. | 0,01 | -1,21 | 1,63 | 20,00 | 1,6366 | 0,4958 | |||
| BA / The Boeing Company | 0,01 | 2,16 | 1,49 | 25,49 | 1,4971 | 0,4994 | |||
| ITW / Illinois Tool Works Inc. | 0,01 | -15,49 | 1,48 | -15,74 | 1,4929 | 0,0109 | |||
| GEV / GE Vernova Inc. | 0,00 | -1,12 | 1,45 | 71,39 | 1,4596 | 0,7473 | |||
| BRK.B / Berkshire Hathaway Inc. | 0,00 | -41,16 | 1,42 | -41,66 | 1,4323 | -0,6207 | |||
| MMM / 3M Company | 0,01 | -8,16 | 1,37 | -4,20 | 1,3788 | 0,1747 | |||
| PEP / PepsiCo, Inc. | 0,01 | -0,17 | 1,33 | -12,10 | 1,3394 | 0,0652 | |||
| XOM / Exxon Mobil Corporation | 0,01 | 9,31 | 1,27 | -0,39 | 1,2735 | 0,2040 | |||
| CSX / CSX Corporation | 0,04 | 0,00 | 1,26 | 10,88 | 1,2724 | 0,3126 | |||
| INTC / Intel Corporation | 0,06 | 2,66 | 1,25 | 1,29 | 1,2623 | 0,2197 | |||
| MRK / Merck & Co., Inc. | 0,02 | 0,00 | 1,20 | -11,81 | 1,2029 | 0,0621 | |||
| CMCSA / Comcast Corporation | 0,03 | -5,71 | 1,18 | -8,83 | 1,1852 | 0,0982 | |||
| CSCO / Cisco Systems, Inc. | 0,02 | -2,33 | 1,16 | 9,74 | 1,1691 | 0,2786 | |||
| ADM / Archer-Daniels-Midland Company | 0,01 | 6,04 | 1,12 | 46,54 | 1,1281 | 0,4839 | |||
| TXN / Texas Instruments Incorporated | 0,01 | 0,00 | 1,08 | 15,52 | 1,0865 | 0,3000 | |||
| WBD / Warner Bros. Discovery, Inc. | 0,09 | 9,37 | 1,05 | 16,80 | 1,0576 | 0,3002 | |||
| SLB / Schlumberger Limited | 0,03 | 0,00 | 1,03 | -17,04 | 1,0340 | -0,0086 | |||
| T / AT&T Inc. | 0,03 | -1,75 | 0,97 | 0,62 | 0,9793 | 0,1646 | |||
| C / Citigroup Inc. | 0,01 | 0,00 | 0,90 | 19,89 | 0,9101 | 0,2750 | |||
| AMAT / Applied Materials, Inc. | 0,00 | 64,41 | 0,89 | 107,24 | 0,8935 | 0,5332 | |||
| ABT / Abbott Laboratories | 0,01 | -18,44 | 0,78 | -16,36 | 0,7870 | -0,0001 | |||
| DE / Deere & Company | 0,00 | 0,00 | 0,73 | 8,35 | 0,7317 | 0,1668 | |||
| MDLZ / Mondelez International, Inc. | 0,01 | -2,42 | 0,68 | -2,99 | 0,6855 | 0,0944 | |||
| BIIB / Biogen Inc. | 0,01 | -27,40 | 0,67 | -33,37 | 0,6698 | -0,1709 | |||
| HD / The Home Depot, Inc. | 0,00 | 0,00 | 0,56 | -20,65 | 0,5649 | -0,0308 | |||
| EMR / Emerson Electric Co. | 0,00 | 0,00 | 0,45 | 21,68 | 0,4527 | 0,1414 | |||
| BMY / Bristol-Myers Squibb Company | 0,01 | -3,55 | 0,44 | -26,83 | 0,4425 | -0,0631 | |||
| GT / The Goodyear Tire & Rubber Company | 0,04 | 5,06 | 0,43 | 18,13 | 0,4331 | 0,1266 | |||
| GILD / Gilead Sciences, Inc. | 0,00 | 0,00 | 0,42 | -1,19 | 0,4184 | 0,0647 | |||
| IBM / International Business Machines Corporation | 0,00 | -20,00 | 0,35 | -5,11 | 0,3560 | 0,0420 | |||
| NOC / Northrop Grumman Corporation | 0,00 | -12,63 | 0,35 | -14,81 | 0,3482 | 0,0069 | |||
| EL / The Estée Lauder Companies Inc. | 0,00 | -4,49 | 0,34 | 17,06 | 0,3456 | 0,0984 | |||
| PFE / Pfizer Inc. | 0,01 | 17,02 | 0,33 | 13,65 | 0,3355 | 0,0883 | |||
| RTX / RTX Corporation | 0,00 | 0,00 | 0,31 | 0,00 | 0,3086 | 0,0509 | |||
| V / Visa Inc. | 0,01 | -3,58 | 0,29 | -7,91 | 0,2931 | 0,0266 | |||
| AXP / American Express Company | 0,00 | -100,00 | 0,00 | -100,00 | -0,9266 | ||||
| ADP / Automatic Data Processing, Inc. | 0,00 | -100,00 | 0,00 | 0,0000 | |||||
| GS / The Goldman Sachs Group, Inc. | 0,00 | -100,00 | 0,00 | 0,0000 | |||||
| BX / Blackstone Inc. | 0,00 | -100,00 | 0,00 | 0,0000 | |||||
| UPS / United Parcel Service, Inc. | 0,00 | -100,00 | 0,00 | 0,0000 | |||||
| PARAA / Paramount Global | 0,00 | -100,00 | 0,00 | 0,0000 |