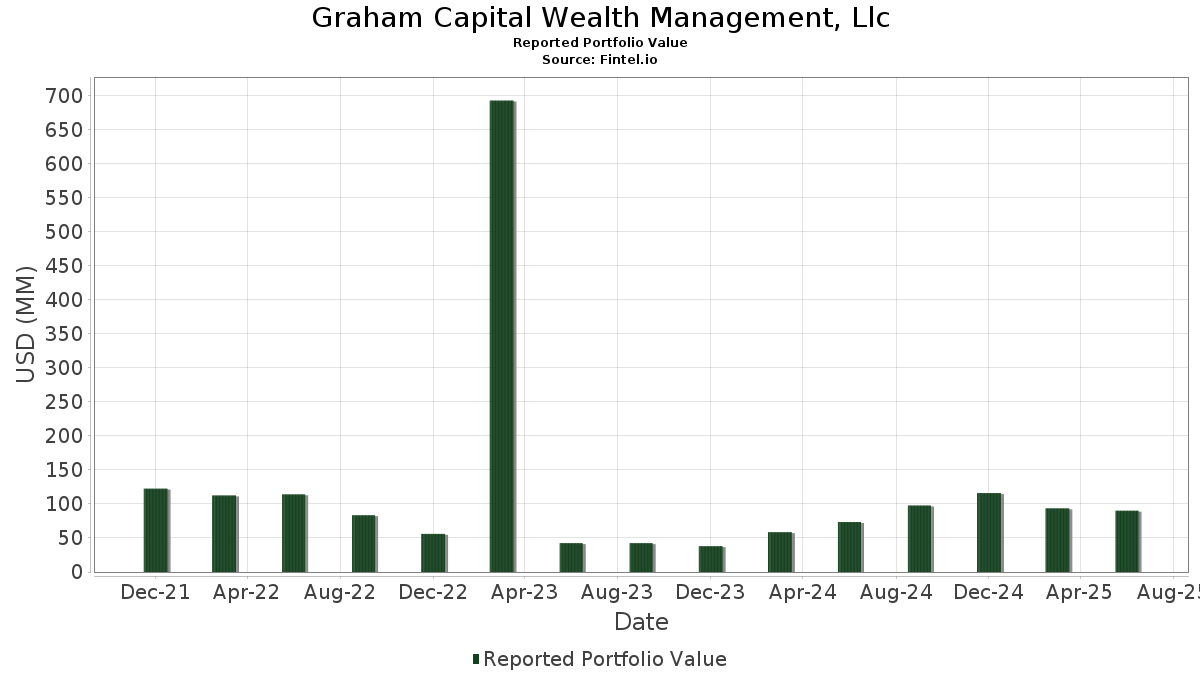
Statistiques de base
| Valeur du portefeuille | $ 90 033 621 |
| Positions actuelles | 70 |
Dernières positions, performances, ASG (à partir des dépôts 13F, 13D)
Graham Capital Wealth Management, Llc a déclaré un total de 70 positions dans ses derniers dépôts auprès de la SEC. La valeur la plus récente du portefeuille est calculée à 90 033 621 USD. Les actifs sous gestion réels (ASG) sont cette valeur plus les liquidités (qui ne sont pas divulguées). Les principales positions de Graham Capital Wealth Management, Llc sont Cheniere Energy, Inc. (US:LNG) , Aldel Financial II Inc. - Debt/Equity Composite Units (US:ALDFU) , Eagle Financial Services, Inc. (US:EFSI) , Public Service Enterprise Group Incorporated (US:PEG) , and CF Bankshares Inc. (US:CFBK) . Les nouvelles positions de Graham Capital Wealth Management, Llc incluent Eagle Financial Services, Inc. (US:EFSI) , Net Lease Office Properties (US:NLOP) , Cantor Equity Partners III, Inc. (US:CAEP) , Central Plains Bancshares, Inc. (US:CPBI) , and Okta Inc (US:US679295AD75) .
Meilleures augmentations ce trimestre
Nous utilisons la variation de l'allocation du portefeuille car il s'agit de l'indicateur le plus significatif. Les changements peuvent être dus à des transactions ou à des variations de prix des actions.
| Titre | Actions (en millions) |
Valeur ($ en millions) |
% du portefeuille | ΔPortefeuille % |
|---|---|---|---|---|
| 0,12 | 3,78 | 4,1947 | 4,1947 | |
| 0,04 | 3,67 | 4,0724 | 4,0724 | |
| 0,06 | 1,98 | 2,1979 | 2,1979 | |
| 0,13 | 1,60 | 1,7741 | 1,3271 | |
| 0,06 | 0,66 | 0,7300 | 0,7300 | |
| 0,84 | 3,00 | 3,3331 | 0,6606 | |
| 0,03 | 6,11 | 6,7851 | 0,6524 | |
| 0,03 | 0,47 | 0,5197 | 0,5197 | |
| 0,20 | 2,46 | 2,7377 | 0,4619 | |
| 0,15 | 3,49 | 3,8741 | 0,4597 |
Principales baisses ce trimestre
Nous utilisons la variation de l'allocation du portefeuille car il s'agit de l'indicateur le plus significatif. Les changements peuvent être dus à des transactions ou à des variations de prix des actions.
| Titre | Actions (en millions) |
Valeur ($ en millions) |
% du portefeuille | ΔPortefeuille % |
|---|---|---|---|---|
| 0,01 | 0,78 | 0,8611 | -2,1805 | |
| 0,01 | 2,04 | 2,2709 | -1,1936 | |
| 0,11 | 1,81 | 2,0118 | -0,9655 | |
| 0,00 | 0,74 | 0,8241 | -0,9273 | |
| 0,07 | 1,68 | 1,8610 | -0,8287 | |
| 0,01 | 1,85 | 2,0494 | -0,6559 | |
| 0,06 | 1,45 | 1,6120 | -0,4599 | |
| 0,72 | 1,24 | 1,3742 | -0,4027 | |
| 0,09 | 2,35 | 2,6143 | -0,2123 | |
| 0,01 | 1,63 | 1,8087 | -0,1779 |
Déclarations 13F et dépôts de fonds
Ce formulaire a été déposé le 2025-08-12 pour la période de déclaration 2025-06-30. Cliquez sur l'icône du lien pour voir l'historique complet des transactions.
Mettre à niveau pour débloquer les données premium et exporter vers Excel ![]() .
.
| Titre | Type | Prix moyen de l'action | Actions (en millions) |
ΔActions (%) |
ΔActions (%) |
Valeur ($ en millions) |
Portefeuille (%) |
ΔPortefeuille (%) |
|
|---|---|---|---|---|---|---|---|---|---|
| LNG / Cheniere Energy, Inc. | 0,03 | 1,26 | 6,11 | 6,56 | 6,7851 | 0,6524 | |||
| ALDFU / Aldel Financial II Inc. - Debt/Equity Composite Units | 0,44 | -1,18 | 4,63 | 1,22 | 5,1446 | 0,2499 | |||
| EFSI / Eagle Financial Services, Inc. | 0,12 | 3,78 | 4,1947 | 4,1947 | |||||
| PEG / Public Service Enterprise Group Incorporated | 0,04 | 3,67 | 4,0724 | 4,0724 | |||||
| CFBK / CF Bankshares Inc. | 0,15 | 0,48 | 3,49 | 9,28 | 3,8741 | 0,4597 | |||
| VTOL / Bristow Group Inc. | 0,10 | 0,10 | 3,27 | 4,51 | 3,6283 | 0,2845 | |||
| EOG / EOG Resources, Inc. | 0,03 | 2,44 | 3,04 | -4,47 | 3,3753 | -0,0273 | |||
| BRBS / Blue Ridge Bankshares, Inc. | 0,84 | 9,08 | 3,00 | 20,10 | 3,3331 | 0,6606 | |||
| HSPTU / Horizon Space Acquisition II Corp. - Debt/Equity Composite Units | 0,28 | -1,41 | 2,91 | -0,14 | 3,2366 | 0,1146 | |||
| D / Dominion Energy, Inc. | 0,05 | 3,04 | 2,74 | 3,87 | 3,0435 | 0,2213 | |||
| ENB / Enbridge Inc. | 0,06 | -1,87 | 2,68 | 0,37 | 2,9795 | 0,1202 | |||
| UDR / UDR, Inc. | 0,07 | 2,46 | 2,67 | -7,37 | 2,9603 | -0,1181 | |||
| CPT / Camden Property Trust | 0,02 | -0,57 | 2,53 | -8,37 | 2,8084 | -0,1438 | |||
| CLST / Catalyst Bancorp, Inc. | 0,20 | 8,94 | 2,46 | 15,84 | 2,7377 | 0,4619 | |||
| CTRA / Coterra Energy Inc. | 0,09 | 1,43 | 2,35 | -10,94 | 2,6143 | -0,2123 | |||
| WPC / W. P. Carey Inc. | 0,04 | -1,46 | 2,27 | -2,61 | 2,5264 | 0,0283 | |||
| ASPCU / A SPAC III Acquisition Corp. - Debt/Equity Composite Units | 0,22 | 0,00 | 2,26 | -0,27 | 2,5069 | 0,0853 | |||
| HCC / Warrior Met Coal, Inc. | 0,05 | -2,76 | 2,08 | -6,60 | 2,3107 | -0,0723 | |||
| CI / The Cigna Group | 0,01 | -37,17 | 2,04 | -36,87 | 2,2709 | -1,1936 | |||
| NLOP / Net Lease Office Properties | 0,06 | 1,98 | 2,1979 | 2,1979 | |||||
| AMT / American Tower Corporation | 0,01 | -28,17 | 1,85 | -27,02 | 2,0494 | -0,6559 | |||
| CHCT / Community Healthcare Trust Incorporated | 0,11 | -28,93 | 1,81 | -34,93 | 2,0118 | -0,9655 | |||
| SILA / Sila Realty Trust, Inc. | 0,07 | -24,80 | 1,68 | -33,37 | 1,8610 | -0,8287 | |||
| MAA / Mid-America Apartment Communities, Inc. | 0,01 | -0,72 | 1,63 | -12,33 | 1,8087 | -0,1779 | |||
| CEPO / Cantor Equity Partners I, Inc. | 0,13 | 229,09 | 1,60 | 282,97 | 1,7741 | 1,3271 | |||
| SMC / Summit Midstream Corporation | 0,06 | 3,53 | 1,45 | -25,05 | 1,6120 | -0,4599 | |||
| FACT II ACQUISITION CORP / UNIT 99/99/9999 (G32901111) | 0,14 | 1,44 | 0,0000 | ||||||
| KOS / Kosmos Energy Ltd. | 0,72 | -1,27 | 1,24 | -25,53 | 1,3742 | -0,4027 | |||
| KNTK / Kinetik Holdings Inc. | 0,02 | -0,55 | 1,02 | -15,67 | 1,1302 | -0,1604 | |||
| IAU / iShares Gold Trust | 0,01 | -74,22 | 0,78 | -72,74 | 0,8611 | -2,1805 | |||
| AAPL / Apple Inc. | 0,00 | 12,29 | 0,76 | 3,67 | 0,8473 | 0,0605 | |||
| MSFT / Microsoft Corporation | 0,00 | 14,21 | 0,75 | 51,21 | 0,8304 | 0,3019 | |||
| GOOGL / Alphabet Inc. | 0,00 | -60,23 | 0,74 | -54,73 | 0,8241 | -0,9273 | |||
| WLACU / Willow Lane Acquisition Corp. - Debt/Equity Composite Units | 0,07 | -0,97 | 0,68 | 1,65 | 0,7522 | 0,0396 | |||
| CAEP / Cantor Equity Partners III, Inc. | 0,06 | 0,66 | 0,7300 | 0,7300 | |||||
| EQV.U / EQV Ventures Acquisition Corp. - Debt/Equity Composite Units | 0,06 | -3,20 | 0,64 | -0,78 | 0,7064 | 0,0203 | |||
| JPM / JPMorgan Chase & Co. | 0,00 | 25,63 | 0,62 | 48,33 | 0,6929 | 0,2434 | |||
| SPE.PRC / Special Opportunities Fund, Inc. - Preferred Stock | 0,02 | -0,49 | 0,61 | 2,17 | 0,6793 | 0,0388 | |||
| JAAA / Janus Detroit Street Trust - Janus Henderson AAA CLO ETF | 0,01 | 15,29 | 0,59 | 15,37 | 0,6589 | 0,1089 | |||
| META / Meta Platforms, Inc. | 0,00 | 92,42 | 0,56 | 146,49 | 0,6247 | 0,3805 | |||
| NTWOU / Newbury Street II Acquisition Corp - Debt/Equity Composite Units | 0,05 | -3,35 | 0,52 | -0,76 | 0,5800 | 0,0166 | |||
| NEE / NextEra Energy, Inc. | 0,01 | -0,48 | 0,51 | -2,51 | 0,5612 | 0,0066 | |||
| PM / Philip Morris International Inc. | 0,00 | -1,08 | 0,50 | 13,38 | 0,5563 | 0,0843 | |||
| DYNXU / Dynamix Corporation - Debt/Equity Composite Units | 0,05 | 0,00 | 0,48 | -0,83 | 0,5310 | 0,0144 | |||
| SPY / SPDR S&P 500 ETF | 0,00 | 0,52 | 0,47 | 11,03 | 0,5255 | 0,0697 | |||
| CPBI / Central Plains Bancshares, Inc. | 0,03 | 0,47 | 0,5197 | 0,5197 | |||||
| CLOA / BlackRock ETF Trust II - iShares AAA CLO Active ETF | 0,01 | 20,09 | 0,44 | 20,27 | 0,4882 | 0,0977 | |||
| NVDA / NVIDIA Corporation | 0,00 | 6,97 | 0,43 | 55,64 | 0,4764 | 0,1822 | |||
| VACHU / Voyager Acquisition Corp. - Debt/Equity Composite Units | 0,04 | -0,54 | 0,43 | -0,23 | 0,4729 | 0,0172 | |||
| AMZN / Amazon.com, Inc. | 0,00 | 34,49 | 0,42 | 55,02 | 0,4636 | 0,1757 | |||
| VOO / Vanguard Index Funds - Vanguard S&P 500 ETF | 0,00 | -18,98 | 0,35 | -10,46 | 0,3905 | -0,0295 | |||
| KTF / DWS Municipal Income Trust | 0,04 | -10,52 | 0,35 | -15,65 | 0,3839 | -0,0546 | |||
| HD / The Home Depot, Inc. | 0,00 | -3,12 | 0,34 | -3,12 | 0,3795 | 0,0024 | |||
| WRB / W. R. Berkley Corporation | 0,00 | -24,66 | 0,31 | -22,08 | 0,3490 | -0,0831 | |||
| NFLX / Netflix, Inc. | 0,00 | 3,11 | 0,31 | 48,33 | 0,3451 | 0,1206 | |||
| PEP / PepsiCo, Inc. | 0,00 | 23,73 | 0,30 | 9,12 | 0,3326 | 0,0386 | |||
| WMT / Walmart Inc. | 0,00 | 1,98 | 0,28 | 13,58 | 0,3070 | 0,0467 | |||
| IVV / iShares Trust - iShares Core S&P 500 ETF | 0,00 | -35,15 | 0,27 | -28,38 | 0,2952 | -0,1016 | |||
| SFBC / Sound Financial Bancorp, Inc. | 0,01 | -1,72 | 0,24 | -10,07 | 0,2687 | -0,0184 | |||
| TIP / iShares Trust - iShares TIPS Bond ETF | 0,00 | -5,06 | 0,24 | -5,86 | 0,2683 | -0,0065 | |||
| PG / The Procter & Gamble Company | 0,00 | 2,46 | 0,23 | -4,26 | 0,2509 | -0,0014 | |||
| V / Visa Inc. | 0,00 | 0,20 | 0,2256 | 0,2256 | |||||
| RTX / RTX Corporation | 0,00 | 0,20 | 0,2245 | 0,2245 | |||||
| PDBC / Invesco Optimum Yield Diversified Commodity Strategy No K-1 ETF | 0,01 | 0,16 | 0,19 | -4,46 | 0,2152 | -0,0011 | |||
| LPAAU / Launch One Acquisition Corp. - Debt/Equity Composite Units | 0,02 | -0,34 | 0,19 | 2,75 | 0,2080 | 0,0125 | |||
| US679295AD75 / Okta Inc | 0,13 | -2,99 | 0,1451 | 0,0017 | |||||
| TAVIU / Tavia Acquisition Corp. - Debt/Equity Composite Units | 0,01 | 0,00 | 0,10 | 0,99 | 0,1137 | 0,0050 | |||
| US29355AAH05 / ENPHASE ENERGY INC CONV 0% 03/01/2026 | 0,04 | 2,44 | 0,0467 | 0,0021 | |||||
| US29786AAL08 / Etsy Inc | 0,02 | 4,76 | 0,0247 | 0,0012 | |||||
| US679295AF24 / CONV. NOTE | 0,02 | 0,00 | 0,0244 | 0,0009 | |||||
| INSW / International Seaways, Inc. | 0,00 | -100,00 | 0,00 | 0,0000 | |||||
| NVGS / Navigator Holdings Ltd. | 0,00 | -100,00 | 0,00 | 0,0000 | |||||
| TJX / The TJX Companies, Inc. | 0,00 | -100,00 | 0,00 | 0,0000 | |||||
| XIFR / XPLR Infrastructure, LP - Limited Partnership | 0,00 | -100,00 | 0,00 | 0,0000 | |||||
| DVN / Devon Energy Corporation | 0,00 | -100,00 | 0,00 | 0,0000 |