Statistiques de base
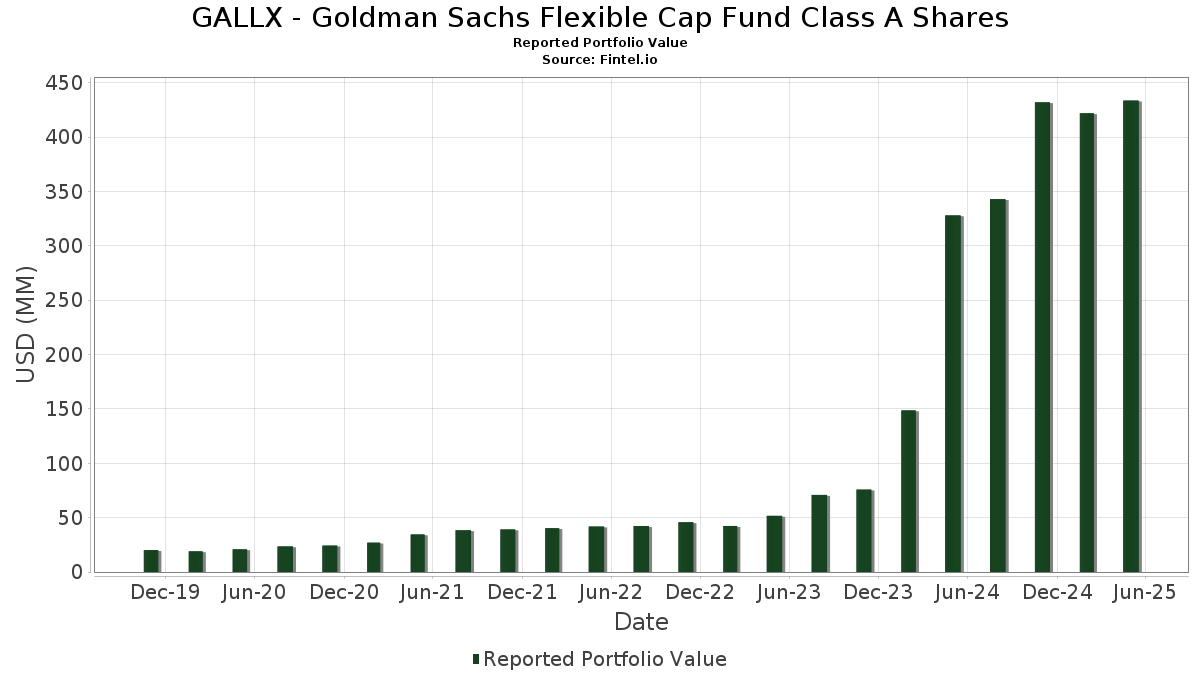
| Valeur du portefeuille | $ 433 591 906 |
| Positions actuelles | 112 |
Dernières positions, performances, ASG (à partir des dépôts 13F, 13D)
GALLX - Goldman Sachs Flexible Cap Fund Class A Shares a déclaré un total de 112 positions dans ses derniers dépôts auprès de la SEC. La valeur la plus récente du portefeuille est calculée à 433 591 906 USD. Les actifs sous gestion réels (ASG) sont cette valeur plus les liquidités (qui ne sont pas divulguées). Les principales positions de GALLX - Goldman Sachs Flexible Cap Fund Class A Shares sont Microsoft Corporation (US:MSFT) , Apple Inc. (US:AAPL) , NVIDIA Corporation (US:NVDA) , Amazon.com, Inc. (US:AMZN) , and Meta Platforms, Inc. (US:META) . Les nouvelles positions de GALLX - Goldman Sachs Flexible Cap Fund Class A Shares incluent Gartner, Inc. (GB:0ITV) , PG&E Corporation (US:PCG) , Datadog, Inc. (US:DDOG) , monday.com Ltd. (US:MNDY) , and Snowflake Inc. (US:SNOW) .
Meilleures augmentations ce trimestre
Nous utilisons la variation de l'allocation du portefeuille car il s'agit de l'indicateur le plus significatif. Les changements peuvent être dus à des transactions ou à des variations de prix des actions.
| Titre | Actions (en millions) |
Valeur ($ en millions) |
% du portefeuille | ΔPortefeuille % |
|---|---|---|---|---|
| 0,06 | 4,37 | 1,0070 | 1,0070 | |
| 0,07 | 31,99 | 7,3732 | 0,9171 | |
| 0,05 | 11,82 | 2,7240 | 0,8187 | |
| 0,20 | 26,79 | 6,1752 | 0,6579 | |
| 0,01 | 2,57 | 0,5914 | 0,5914 | |
| 0,15 | 2,49 | 0,5742 | 0,5742 | |
| 0,02 | 2,40 | 0,5524 | 0,5524 | |
| 0,06 | 6,08 | 1,4005 | 0,5291 | |
| 0,02 | 2,30 | 0,5291 | 0,5291 | |
| 0,01 | 2,22 | 0,5109 | 0,5109 |
Principales baisses ce trimestre
Nous utilisons la variation de l'allocation du portefeuille car il s'agit de l'indicateur le plus significatif. Les changements peuvent être dus à des transactions ou à des variations de prix des actions.
| Titre | Actions (en millions) |
Valeur ($ en millions) |
% du portefeuille | ΔPortefeuille % |
|---|---|---|---|---|
| 1,78 | 1,78 | 0,4101 | -1,4674 | |
| 0,14 | 28,56 | 6,5820 | -1,2849 | |
| 0,02 | 8,19 | 1,8880 | -0,5375 | |
| 0,03 | 4,87 | 1,1226 | -0,5123 | |
| 0,01 | 3,78 | 0,8702 | -0,4495 | |
| 0,05 | 5,37 | 1,2387 | -0,3293 | |
| 0,11 | 3,09 | 0,7118 | -0,2770 | |
| 0,02 | 5,36 | 1,2366 | -0,2759 | |
| 0,01 | 5,35 | 1,2322 | -0,2501 | |
| 0,00 | 0,00 | -0,2467 |
Déclarations 13F et dépôts de fonds
Ce formulaire a été déposé le 2025-07-22 pour la période de déclaration 2025-05-31. Cliquez sur l'icône du lien pour voir l'historique complet des transactions.
Mettre à niveau pour débloquer les données premium et exporter vers Excel ![]() .
.
| Titre | Type | Prix moyen de l'action | Actions (en millions) |
ΔActions (%) |
ΔActions (%) |
Valeur ($ en millions) |
Portefeuille (%) |
ΔPortefeuille (%) |
|
|---|---|---|---|---|---|---|---|---|---|
| MSFT / Microsoft Corporation | 0,07 | 1,09 | 31,99 | 17,23 | 7,3732 | 0,9171 | |||
| AAPL / Apple Inc. | 0,14 | 3,41 | 28,56 | -14,12 | 6,5820 | -1,2849 | |||
| NVDA / NVIDIA Corporation | 0,20 | 6,21 | 26,79 | 14,89 | 6,1752 | 0,6579 | |||
| AMZN / Amazon.com, Inc. | 0,08 | 10,45 | 16,97 | 6,66 | 3,9113 | 0,1472 | |||
| META / Meta Platforms, Inc. | 0,02 | 2,53 | 14,35 | -0,65 | 3,3085 | -0,1098 | |||
| AVGO / Broadcom Inc. | 0,05 | 20,90 | 11,82 | 46,76 | 2,7240 | 0,8187 | |||
| GOOGL / Alphabet Inc. | 0,05 | 6,35 | 9,02 | 7,26 | 2,0802 | 0,0895 | |||
| BRK.B / Berkshire Hathaway Inc. | 0,02 | -18,53 | 8,19 | -20,10 | 1,8880 | -0,5375 | |||
| MA / Mastercard Incorporated | 0,01 | 1,96 | 7,38 | 3,61 | 1,7016 | 0,0156 | |||
| NFLX / Netflix, Inc. | 0,01 | 6,56 | 7,04 | 31,20 | 1,6226 | 0,3530 | |||
| TSLA / Tesla, Inc. | 0,02 | -3,74 | 6,29 | 13,82 | 1,4502 | 0,1424 | |||
| WMT / Walmart Inc. | 0,06 | 64,79 | 6,08 | 64,99 | 1,4005 | 0,5291 | |||
| XOM / Exxon Mobil Corporation | 0,05 | -11,75 | 5,37 | -18,91 | 1,2387 | -0,3293 | |||
| JPM / JPMorgan Chase & Co. | 0,02 | -15,87 | 5,36 | -16,08 | 1,2366 | -0,2759 | |||
| LLY / Eli Lilly and Company | 0,01 | 6,50 | 5,35 | -14,67 | 1,2322 | -0,2501 | |||
| ABBV / AbbVie Inc. | 0,03 | 6,42 | 5,24 | -5,25 | 1,2073 | -0,1006 | |||
| PG / The Procter & Gamble Company | 0,03 | 15,52 | 5,21 | 12,90 | 1,2002 | 0,1089 | |||
| GOOG / Alphabet Inc. | 0,03 | -29,77 | 4,87 | -29,51 | 1,1226 | -0,5123 | |||
| BAC / Bank of America Corporation | 0,11 | -0,47 | 4,87 | -4,74 | 1,1218 | -0,0868 | |||
| HD / The Home Depot, Inc. | 0,01 | 43,54 | 4,47 | 33,31 | 1,0313 | 0,2371 | |||
| ABT / Abbott Laboratories | 0,03 | 6,55 | 4,44 | 3,11 | 1,0236 | 0,0047 | |||
| MCD / McDonald's Corporation | 0,01 | 6,54 | 4,40 | 8,46 | 1,0136 | 0,0542 | |||
| WFC / Wells Fargo & Company | 0,06 | 4,37 | 1,0070 | 1,0070 | |||||
| CRM / Salesforce, Inc. | 0,02 | 6,63 | 4,05 | -5,00 | 0,9329 | -0,0751 | |||
| COST / Costco Wholesale Corporation | 0,00 | 110,93 | 4,02 | 109,33 | 0,9255 | 0,4714 | |||
| UNH / UnitedHealth Group Incorporated | 0,01 | 6,48 | 3,78 | -32,31 | 0,8702 | -0,4495 | |||
| AXP / American Express Company | 0,01 | -4,75 | 3,63 | -6,94 | 0,8376 | -0,0863 | |||
| BSX / Boston Scientific Corporation | 0,03 | 32,52 | 3,47 | 34,41 | 0,7988 | 0,1887 | |||
| MRK / Merck & Co., Inc. | 0,04 | 6,54 | 3,39 | -11,26 | 0,7813 | -0,1224 | |||
| TJX / The TJX Companies, Inc. | 0,03 | 175,14 | 3,33 | 179,83 | 0,7677 | 0,4861 | |||
| HON / Honeywell International Inc. | 0,01 | -0,91 | 3,27 | 5,52 | 0,7536 | 0,0204 | |||
| MMC / Marsh & McLennan Companies, Inc. | 0,01 | -5,17 | 3,27 | -6,85 | 0,7530 | -0,0767 | |||
| LOW / Lowe's Companies, Inc. | 0,01 | 6,61 | 3,13 | -3,21 | 0,7220 | -0,0437 | |||
| KLAC / KLA Corporation | 0,00 | 6,41 | 3,10 | 13,62 | 0,7155 | 0,0691 | |||
| T / AT&T Inc. | 0,11 | -27,14 | 3,09 | -26,11 | 0,7118 | -0,2770 | |||
| ROK / Rockwell Automation, Inc. | 0,01 | 11,28 | 3,04 | 22,30 | 0,7017 | 0,1127 | |||
| SHW / The Sherwin-Williams Company | 0,01 | 6,31 | 3,00 | 5,30 | 0,6922 | 0,0174 | |||
| GEV / GE Vernova Inc. | 0,01 | 6,40 | 2,91 | 50,18 | 0,6706 | 0,2121 | |||
| LHX / L3Harris Technologies, Inc. | 0,01 | -0,90 | 2,87 | 17,47 | 0,6605 | 0,0834 | |||
| TRV / The Travelers Companies, Inc. | 0,01 | -3,76 | 2,84 | 2,64 | 0,6547 | 0,0000 | |||
| AME / AMETEK, Inc. | 0,02 | 6,35 | 2,78 | 0,40 | 0,6405 | -0,0143 | |||
| FAST / Fastenal Company | 0,07 | 86,01 | 2,75 | 1,52 | 0,6329 | -0,0069 | |||
| ALL / The Allstate Corporation | 0,01 | -4,89 | 2,74 | 0,26 | 0,6314 | -0,0152 | |||
| ITW / Illinois Tool Works Inc. | 0,01 | 6,41 | 2,73 | -1,23 | 0,6295 | -0,0246 | |||
| FI / Fiserv, Inc. | 0,02 | -1,12 | 2,72 | -7,80 | 0,6268 | -0,2309 | |||
| MTB / M&T Bank Corporation | 0,01 | 6,26 | 2,69 | 1,20 | 0,6207 | -0,0087 | |||
| VST / Vistra Corp. | 0,02 | 44,94 | 2,64 | 74,16 | 0,6092 | 0,2500 | |||
| 0ITV / Gartner, Inc. | 0,01 | 2,57 | 0,5914 | 0,5914 | |||||
| CAT / Caterpillar Inc. | 0,01 | 83,98 | 2,57 | 86,14 | 0,5914 | 0,2653 | |||
| UAL / United Airlines Holdings, Inc. | 0,03 | 37,24 | 2,56 | 16,22 | 0,5897 | 0,0689 | |||
| KVUE / Kenvue Inc. | 0,11 | -15,98 | 2,54 | -15,02 | 0,5844 | -0,1215 | |||
| PCG / PG&E Corporation | 0,15 | 2,49 | 0,5742 | 0,5742 | |||||
| SCHW / The Charles Schwab Corporation | 0,03 | 6,34 | 2,48 | 18,13 | 0,5721 | 0,0749 | |||
| TYL / Tyler Technologies, Inc. | 0,00 | 6,34 | 2,40 | 0,88 | 0,5530 | -0,0099 | |||
| LYV / Live Nation Entertainment, Inc. | 0,02 | 2,40 | 0,5524 | 0,5524 | |||||
| RJF / Raymond James Financial, Inc. | 0,02 | 6,39 | 2,38 | 1,11 | 0,5479 | -0,0084 | |||
| VTR / Ventas, Inc. | 0,04 | 6,41 | 2,37 | -1,17 | 0,5465 | -0,0209 | |||
| AVB / AvalonBay Communities, Inc. | 0,01 | -12,78 | 2,35 | -20,28 | 0,5420 | -0,1558 | |||
| APP / AppLovin Corporation | 0,01 | 6,35 | 2,34 | 28,27 | 0,5398 | 0,1080 | |||
| ODFL / Old Dominion Freight Line, Inc. | 0,01 | 6,55 | 2,34 | -3,30 | 0,5396 | -0,0332 | |||
| CL / Colgate-Palmolive Company | 0,02 | 52,19 | 2,32 | 55,11 | 0,5354 | 0,1812 | |||
| ALGN / Align Technology, Inc. | 0,01 | 83,56 | 2,31 | 39,95 | 0,5331 | 0,0528 | |||
| DDOG / Datadog, Inc. | 0,02 | 2,30 | 0,5291 | 0,5291 | |||||
| V / Visa Inc. | 0,01 | 6,39 | 2,29 | 7,16 | 0,5281 | 0,0220 | |||
| WWD / Woodward, Inc. | 0,01 | -16,40 | 2,29 | -4,30 | 0,5279 | -0,0384 | |||
| TXRH / Texas Roadhouse, Inc. | 0,01 | -0,90 | 2,29 | 5,10 | 0,5277 | 0,0122 | |||
| DPZ / Domino's Pizza, Inc. | 0,00 | 99,50 | 2,29 | 93,00 | 0,5273 | 0,2469 | |||
| CMS / CMS Energy Corporation | 0,03 | -5,54 | 2,29 | -9,17 | 0,5273 | -0,0687 | |||
| PPL / PPL Corporation | 0,07 | 72,40 | 2,27 | 70,14 | 0,5229 | 0,2074 | |||
| CPAY / Corpay, Inc. | 0,01 | 6,36 | 2,26 | -5,80 | 0,5204 | -0,0467 | |||
| VICI / VICI Properties Inc. | 0,07 | -0,91 | 2,25 | -3,30 | 0,5195 | -0,0319 | |||
| STLD / Steel Dynamics, Inc. | 0,02 | 6,33 | 2,25 | -3,11 | 0,5178 | -0,0308 | |||
| PSX / Phillips 66 | 0,02 | 6,37 | 2,24 | -6,93 | 0,5171 | -0,0532 | |||
| EQH / Equitable Holdings, Inc. | 0,04 | 6,36 | 2,24 | 2,19 | 0,5163 | -0,0023 | |||
| LEN / Lennar Corporation | 0,02 | 49,58 | 2,23 | 32,66 | 0,5140 | 0,1162 | |||
| CPT / Camden Property Trust | 0,02 | 89,77 | 2,22 | 79,77 | 0,5123 | 0,2197 | |||
| AMH / American Homes 4 Rent | 0,06 | -7,42 | 2,22 | -5,29 | 0,5115 | -0,0430 | |||
| MNDY / monday.com Ltd. | 0,01 | 2,22 | 0,5109 | 0,5109 | |||||
| MTD / Mettler-Toledo International Inc. | 0,00 | 6,32 | 2,20 | -3,47 | 0,5063 | -0,0321 | |||
| DT / Dynatrace, Inc. | 0,04 | 6,35 | 2,20 | 0,32 | 0,5063 | -0,0117 | |||
| BJ / BJ's Wholesale Club Holdings, Inc. | 0,02 | -6,78 | 2,17 | 4,23 | 0,5001 | 0,0075 | |||
| OMC / Omnicom Group Inc. | 0,03 | 6,27 | 2,16 | -5,72 | 0,4981 | -0,0441 | |||
| SNOW / Snowflake Inc. | 0,01 | 2,16 | 0,4978 | 0,4978 | |||||
| ITT / ITT Inc. | 0,01 | 6,39 | 2,13 | 13,40 | 0,4916 | 0,0466 | |||
| EWBC / East West Bancorp, Inc. | 0,02 | 6,38 | 2,12 | 2,77 | 0,4883 | 0,0005 | |||
| IBM / International Business Machines Corporation | 0,01 | 6,37 | 2,12 | 9,18 | 0,4883 | 0,0291 | |||
| SWK / Stanley Black & Decker, Inc. | 0,03 | 67,29 | 2,12 | 25,59 | 0,4876 | -0,0248 | |||
| COR / Cencora, Inc. | 0,01 | -23,83 | 2,10 | -12,50 | 0,4841 | -0,0838 | |||
| IEX / IDEX Corporation | 0,01 | 6,36 | 2,02 | -0,98 | 0,4649 | -0,0171 | |||
| AZN / AstraZeneca PLC - Depositary Receipt (Common Stock) | 0,03 | 6,36 | 1,99 | 1,64 | 0,4576 | -0,0045 | |||
| CCEP / COCA COLA EUROPACIFIC COMPANY GUAR REGS 11/27 1.5 | 0,02 | -10,86 | 1,95 | -5,15 | 0,4500 | -0,0370 | |||
| RPM / RPM International Inc. | 0,02 | 6,39 | 1,95 | -2,26 | 0,4490 | -0,0225 | |||
| TEAM / Atlassian Corporation | 0,01 | 1,94 | 0,4465 | 0,4465 | |||||
| MU / Micron Technology, Inc. | 0,02 | 1,93 | 0,4447 | 0,4447 | |||||
| BAH / Booz Allen Hamilton Holding Corporation | 0,02 | 463,26 | 1,78 | 428,19 | 0,4104 | -0,0668 | |||
| US38141W2733 / Goldman Sachs Financial Square Funds - Government Fund | 1,78 | -77,58 | 1,78 | -77,58 | 0,4101 | -1,4674 | |||
| COP / ConocoPhillips | 0,02 | -13,12 | 1,76 | -25,22 | 0,4060 | -0,1513 | |||
| SBUX / Starbucks Corporation | 0,02 | 6,44 | 1,75 | -22,84 | 0,4035 | -0,1333 | |||
| WST / West Pharmaceutical Services, Inc. | 0,01 | 176,68 | 1,63 | 151,23 | 0,3765 | 0,2226 | |||
| MRVL / Marvell Technology, Inc. | 0,03 | 50,54 | 1,61 | -1,35 | 0,3718 | -0,0150 | |||
| NDAQ / Nasdaq, Inc. | 0,02 | 6,28 | 1,56 | 7,21 | 0,3603 | 0,0155 | |||
| MSCI / MSCI Inc. | 0,00 | -0,91 | 1,53 | -5,33 | 0,3521 | -0,0298 | |||
| MSI / Motorola Solutions, Inc. | 0,00 | 6,32 | 1,40 | 0,29 | 0,3220 | -0,0075 | |||
| NBIX / Neurocrine Biosciences, Inc. | 0,01 | -35,51 | 1,30 | -33,20 | 0,3003 | -0,1610 | |||
| WLK / Westlake Corporation | 0,02 | 6,52 | 1,28 | -32,62 | 0,2958 | -0,1549 | |||
| TAP / Molson Coors Beverage Company | 0,02 | -0,91 | 1,14 | -13,39 | 0,2625 | -0,0485 | |||
| Aptiv PLC / EC (JE00BTDN8H13) | 0,02 | 1,12 | 0,2592 | 0,2592 | |||||
| SBAC / SBA Communications Corporation | 0,00 | 0,93 | 0,2152 | 0,2152 | |||||
| COLD / Americold Realty Trust, Inc. | 0,06 | 6,53 | 0,93 | -23,10 | 0,2144 | -0,0715 | |||
| PLD / Prologis, Inc. | 0,01 | 0,90 | 0,2082 | 0,2082 | |||||
| 47Q / Ovintiv Inc. | 0,03 | 0,90 | 0,2081 | 0,2081 | |||||
| JNJ / Johnson & Johnson | 0,01 | 6,67 | 0,82 | 0,37 | 0,1900 | -0,0044 | |||
| MANH / Manhattan Associates, Inc. | 0,00 | -100,00 | 0,00 | -100,00 | -0,2467 |