Statistiques de base
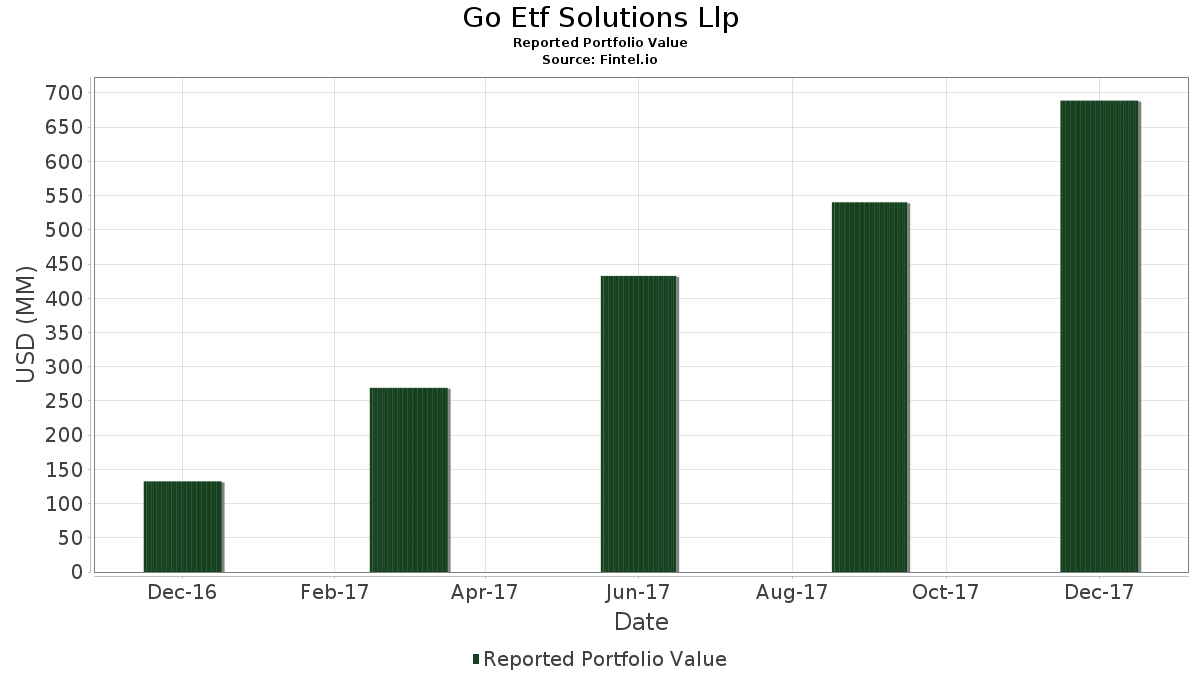
| Valeur du portefeuille | $ 688 865 000 |
| Positions actuelles | 62 |
Dernières positions, performances, ASG (à partir des dépôts 13F, 13D)
Go Etf Solutions Llp a déclaré un total de 62 positions dans ses derniers dépôts auprès de la SEC. La valeur la plus récente du portefeuille est calculée à 688 865 000 USD. Les actifs sous gestion réels (ASG) sont cette valeur plus les liquidités (qui ne sont pas divulguées). Les principales positions de Go Etf Solutions Llp sont iRobot Corporation (US:IRBT) , Oceaneering International, Inc. (US:OII) , IPG Photonics Corporation (US:IPGP) , Rockwell Automation, Inc. (US:ROK) , and Raven Industries, Inc. (US:RAVN) . Les nouvelles positions de Go Etf Solutions Llp incluent Novanta Inc. (US:NOVT) , Okta, Inc. (US:OKTA) , .
Meilleures augmentations ce trimestre
Nous utilisons la variation de l'allocation du portefeuille car il s'agit de l'indicateur le plus significatif. Les changements peuvent être dus à des transactions ou à des variations de prix des actions.
| Titre | Actions (en millions) |
Valeur ($ en millions) |
% du portefeuille | ΔPortefeuille % |
|---|---|---|---|---|
| 0,23 | 13,72 | 1,9924 | 1,9924 | |
| 0,11 | 10,89 | 1,5804 | 1,5804 | |
| 0,21 | 10,60 | 1,5383 | 1,5383 | |
| 0,12 | 5,92 | 0,8598 | 0,8598 | |
| 0,12 | 5,81 | 0,8436 | 0,8436 | |
| 0,26 | 20,26 | 2,9409 | 0,7514 | |
| 0,18 | 5,16 | 0,7486 | 0,7486 | |
| 0,12 | 5,11 | 0,7421 | 0,7421 | |
| 0,18 | 4,64 | 0,6737 | 0,6737 | |
| 0,94 | 19,79 | 2,8727 | 0,5637 |
Principales baisses ce trimestre
Nous utilisons la variation de l'allocation du portefeuille car il s'agit de l'indicateur le plus significatif. Les changements peuvent être dus à des transactions ou à des variations de prix des actions.
| Titre | Actions (en millions) |
Valeur ($ en millions) |
% du portefeuille | ΔPortefeuille % |
|---|---|---|---|---|
| 0,00 | 0,00 | -1,3825 | ||
| 0,00 | 0,00 | -1,3238 | ||
| 0,37 | 10,24 | 1,4872 | -0,7292 | |
| 0,71 | 10,14 | 1,4726 | -0,6315 | |
| 0,08 | 12,05 | 1,7491 | -0,3061 | |
| 0,09 | 5,57 | 0,8092 | -0,2250 | |
| 0,67 | 12,59 | 1,8274 | -0,1682 | |
| 0,26 | 12,44 | 1,8051 | -0,1662 | |
| 0,96 | 4,23 | 0,6136 | -0,1621 | |
| 1,50 | 8,81 | 1,2786 | -0,1539 |
Déclarations 13F et dépôts de fonds
Ce formulaire a été déposé le 2018-08-01 pour la période de déclaration 2017-12-31. Cliquez sur l'icône du lien pour voir l'historique complet des transactions.
Mettre à niveau pour débloquer les données premium et exporter vers Excel ![]() .
.
| Titre | Type | Prix moyen de l'action | Actions (en millions) |
ΔActions (%) |
ΔActions (%) |
Valeur ($ en millions) |
Portefeuille (%) |
ΔPortefeuille (%) |
|
|---|---|---|---|---|---|---|---|---|---|
| IRBT / iRobot Corporation | 0,26 | 72,07 | 20,26 | 71,27 | 2,9409 | 0,7514 | |||
| OII / Oceaneering International, Inc. | 0,94 | 97,14 | 19,79 | 58,64 | 2,8727 | 0,5637 | |||
| IPGP / IPG Photonics Corporation | 0,09 | 26,40 | 18,40 | 46,26 | 2,6708 | 0,3424 | |||
| ROK / Rockwell Automation, Inc. | 0,09 | 29,68 | 17,95 | 42,87 | 2,6065 | 0,2803 | |||
| RAVN / Raven Industries, Inc. | 0,52 | 32,69 | 17,90 | 40,68 | 2,5980 | 0,2432 | |||
| HOLI / Hollysys Automation Technologies Ltd. | 0,77 | 28,60 | 17,24 | 32,52 | 2,5028 | 0,0946 | |||
| ZBRA / Zebra Technologies Corporation | 0,16 | 41,17 | 16,96 | 34,95 | 2,4627 | 0,1358 | |||
| ISRG / Intuitive Surgical, Inc. | 0,05 | 293,68 | 16,95 | 37,37 | 2,4611 | 0,1766 | |||
| CGNX / Cognex Corporation | 0,27 | 150,33 | 16,75 | 38,83 | 2,4321 | 0,1983 | |||
| AKAM / Akamai Technologies, Inc. | 0,25 | 18,79 | 15,99 | 58,59 | 2,3215 | 0,4549 | |||
| SPLK / Splunk Inc. | 0,18 | -0,49 | 14,94 | 24,09 | 2,1686 | -0,0598 | |||
| RDWR / Radware Ltd. | 0,71 | 20,88 | 13,78 | 39,09 | 2,0010 | 0,1666 | |||
| QLYS / Qualys, Inc. | 0,23 | -8,48 | 13,72 | 4,86 | 1,9924 | 1,9924 | |||
| SAIC / Science Applications International Corporation | 0,18 | 20,66 | 13,72 | 38,21 | 1,9918 | 0,1541 | |||
| CSCO / Cisco Systems, Inc. | 0,36 | 8,14 | 13,64 | 23,17 | 1,9805 | -0,0699 | |||
| RPD / Rapid7, Inc. | 0,67 | 10,13 | 12,59 | 16,76 | 1,8274 | -0,1682 | |||
| FARO / FARO Technologies, Inc. | 0,26 | -4,98 | 12,44 | 16,76 | 1,8051 | -0,1662 | |||
| JNPR / Juniper Networks, Inc. | 0,43 | 16,40 | 12,27 | 19,21 | 1,7809 | -0,1240 | |||
| PFPT / Proofpoint Inc | 0,14 | 15,67 | 12,20 | 17,79 | 1,7707 | -0,1462 | |||
| CYBR / CyberArk Software Ltd. | 0,29 | 41,56 | 12,09 | 42,91 | 1,7555 | 0,1892 | |||
| PANW / Palo Alto Networks, Inc. | 0,08 | 7,90 | 12,05 | 8,52 | 1,7491 | -0,3061 | |||
| HLX / Helix Energy Solutions Group, Inc. | 1,56 | 66,01 | 11,79 | 69,38 | 1,7114 | 0,4231 | |||
| NDSN / Nordson Corporation | 0,08 | 30,55 | 11,70 | 61,30 | 1,6990 | 0,3559 | |||
| MANH / Manhattan Associates, Inc. | 0,23 | 43,35 | 11,19 | 70,83 | 1,6238 | 0,4118 | |||
| IMPV / Imperva, Inc. | 0,28 | 28,11 | 10,96 | 17,19 | 1,5907 | -0,1401 | |||
| CHKP / Check Point Software Technologies Ltd. | 0,11 | 11,16 | 10,89 | 1,02 | 1,5804 | 1,5804 | |||
| OSPN / OneSpan Inc. | 0,77 | 34,25 | 10,77 | 54,85 | 1,5630 | 0,2760 | |||
| NUAN / Nuance Communications Inc | 0,65 | 53,10 | 10,65 | 59,25 | 1,5463 | 0,3082 | |||
| NOVT / Novanta Inc. | 0,21 | 10,60 | 1,5383 | 1,5383 | |||||
| TER / Teradyne, Inc. | 0,25 | 33,44 | 10,50 | 49,82 | 1,5248 | 0,2271 | |||
| DE / Deere & Company | 0,07 | 14,63 | 10,49 | 42,86 | 1,5232 | 0,1637 | |||
| NVDA / NVIDIA Corporation | 0,05 | 37,90 | 10,27 | 49,26 | 1,4907 | 0,2172 | |||
| NLOK / NortonLifeLock Inc | 0,37 | 0,05 | 10,24 | -14,44 | 1,4872 | -0,7292 | |||
| MCHP / Microchip Technology Incorporated | 0,12 | 50,32 | 10,22 | 47,15 | 1,4833 | 0,1980 | |||
| US3024451011 / FLIR Systems, Inc. | 0,22 | 25,91 | 10,21 | 50,86 | 1,4826 | 0,2294 | |||
| TDY / Teledyne Technologies Incorporated | 0,06 | 25,99 | 10,20 | 43,37 | 1,4800 | 0,1637 | |||
| JBT / JBT Marel Corporation | 0,09 | 26,99 | 10,18 | 39,18 | 1,4779 | 0,1239 | |||
| FEYE / FireEye Inc | 0,71 | 5,39 | 10,14 | -10,76 | 1,4726 | -0,6315 | |||
| QCOM / QUALCOMM Incorporated | 0,16 | 19,11 | 10,13 | 47,10 | 1,4702 | 0,1958 | |||
| AMBA / Ambarella, Inc. | 0,17 | 15,38 | 10,12 | 38,31 | 1,4691 | 0,1147 | |||
| US92220P1057 / Varian Medical Systems, Inc. | 0,09 | 39,21 | 10,09 | 54,65 | 1,4644 | 0,2570 | |||
| LECO / Lincoln Electric Holdings, Inc. | 0,11 | 43,42 | 10,07 | 43,26 | 1,4624 | 0,1608 | |||
| TRMB / Trimble Inc. | 0,25 | 41,10 | 10,02 | 46,09 | 1,4549 | 0,1851 | |||
| PTC / PTC Inc. | 0,16 | 29,86 | 10,01 | 40,22 | 1,4531 | 0,1317 | |||
| QGEN / Qiagen N.V. | 0,32 | 49,41 | 10,01 | 46,72 | 1,4528 | 0,1902 | |||
| XLNX / Xilinx, Inc. | 0,15 | 46,16 | 10,00 | 39,14 | 1,4512 | 0,1213 | |||
| BRKS / Brooks Automation, Inc. | 0,42 | 71,43 | 9,93 | 34,66 | 1,4421 | 0,0766 | |||
| NATI / National Instruments Corp. | 0,24 | 38,86 | 9,85 | 37,08 | 1,4296 | 0,0998 | |||
| CDNS / Cadence Design Systems, Inc. | 0,23 | 28,81 | 9,76 | 36,48 | 1,4164 | 0,0931 | |||
| SSYS / Stratasys Ltd. | 0,48 | 65,84 | 9,54 | 43,18 | 1,3845 | 0,1515 | |||
| DDD / 3D Systems Corporation | 1,07 | 110,92 | 9,21 | 36,10 | 1,3376 | 0,0844 | |||
| KEYW / KEYW Holdings Corp | 1,50 | 47,55 | 8,81 | 13,81 | 1,2786 | -0,1539 | |||
| VRNS / Varonis Systems, Inc. | 0,12 | -6,93 | 5,92 | 7,83 | 0,8598 | 0,8598 | |||
| MANT / Mantech International Corp - Class A | 0,12 | -1,75 | 5,81 | 11,69 | 0,8436 | 0,8436 | |||
| LDOS / Leidos Holdings, Inc. | 0,09 | -8,50 | 5,57 | -0,23 | 0,8092 | -0,2250 | |||
| FFIV / F5, Inc. | 0,04 | 10,48 | 5,56 | 20,25 | 0,8077 | -0,0488 | |||
| US60739U2042 / MobileIron, Inc. | 1,38 | 71,41 | 5,39 | 80,68 | 0,7822 | 0,2302 | |||
| MIME / Mimecast Ltd | 0,18 | -1,22 | 5,16 | -0,35 | 0,7486 | 0,7486 | |||
| VRNT / Verint Systems Inc. | 0,12 | 1,95 | 5,11 | 1,95 | 0,7421 | 0,7421 | |||
| OKTA / Okta, Inc. | 0,18 | 4,64 | 0,6737 | 0,6737 | |||||
| ZIXI / Zix Corp. | 0,96 | 12,59 | 4,23 | 0,86 | 0,6136 | -0,1621 | |||
| US3021041047 / ExOne Co | 0,15 | -63,93 | 1,27 | -73,32 | 0,1849 | 0,1849 | |||
| FTI / TechnipFMC plc | 0,00 | -100,00 | 0,00 | -100,00 | -1,3238 | ||||
| NOC / Northrop Grumman Corporation | 0,00 | -100,00 | 0,00 | -100,00 | -1,3825 | ||||
| MBLY / Mobileye Global Inc. | 0,00 | 0,00 | 0,0000 | ||||||
| IMMR / Immersion Corporation | 0,00 | -100,00 | 0,00 | -100,00 | 0,0000 |