Statistiques de base
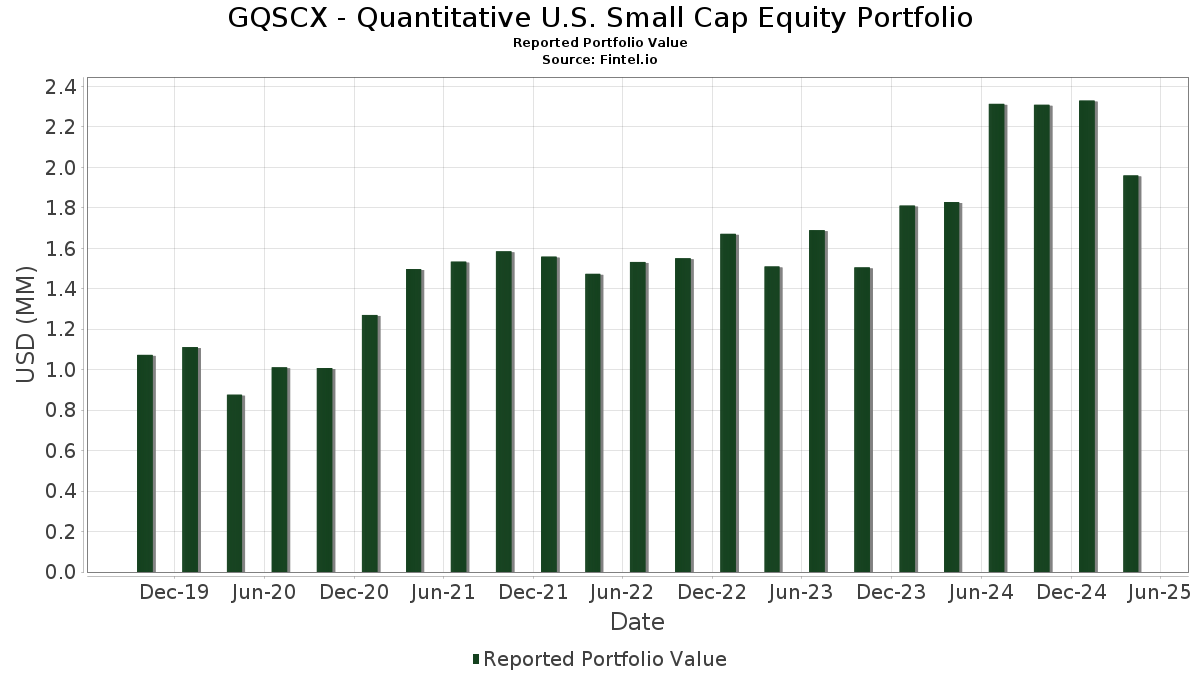
| Valeur du portefeuille | $ 1 959 770 |
| Positions actuelles | 133 |
Dernières positions, performances, ASG (à partir des dépôts 13F, 13D)
GQSCX - Quantitative U.S. Small Cap Equity Portfolio a déclaré un total de 133 positions dans ses derniers dépôts auprès de la SEC. La valeur la plus récente du portefeuille est calculée à 1 959 770 USD. Les actifs sous gestion réels (ASG) sont cette valeur plus les liquidités (qui ne sont pas divulguées). Les principales positions de GQSCX - Quantitative U.S. Small Cap Equity Portfolio sont State Street Navigator Securities Lending Government Money Market Portfolio (US:US8575093013) , Pacira BioSciences, Inc. (US:PCRX) , Adtalem Global Education Inc. (US:ATGE) , EZCORP, Inc. (US:EZPW) , and Mueller Water Products, Inc. (US:MWA) . Les nouvelles positions de GQSCX - Quantitative U.S. Small Cap Equity Portfolio incluent PagSeguro Digital Ltd. (US:PAGS) , Terns Pharmaceuticals, Inc. (US:TERN) , South Plains Financial, Inc. (US:SPFI) , Third Coast Bancshares, Inc. (US:TCBX) , and InvenTrust Properties Corp. (US:IVT) .
Meilleures augmentations ce trimestre
Nous utilisons la variation de l'allocation du portefeuille car il s'agit de l'indicateur le plus significatif. Les changements peuvent être dus à des transactions ou à des variations de prix des actions.
| Titre | Actions (en millions) |
Valeur ($ en millions) |
% du portefeuille | ΔPortefeuille % |
|---|---|---|---|---|
| 0,05 | 0,05 | 2,5318 | 2,3002 | |
| 0,00 | 0,02 | 1,1367 | 1,1367 | |
| 0,02 | 1,1326 | 1,1326 | ||
| 0,01 | 0,02 | 0,9800 | 0,9800 | |
| 0,00 | 0,02 | 0,8144 | 0,8144 | |
| 0,00 | 0,02 | 0,8138 | 0,8138 | |
| 0,00 | 0,02 | 0,7945 | 0,7945 | |
| 0,00 | 0,02 | 0,7895 | 0,7895 | |
| 0,00 | 0,01 | 0,7772 | 0,7772 | |
| 0,00 | 0,01 | 0,7706 | 0,7706 |
Principales baisses ce trimestre
Nous utilisons la variation de l'allocation du portefeuille car il s'agit de l'indicateur le plus significatif. Les changements peuvent être dus à des transactions ou à des variations de prix des actions.
| Titre | Actions (en millions) |
Valeur ($ en millions) |
% du portefeuille | ΔPortefeuille % |
|---|---|---|---|---|
| 0,00 | 0,01 | 0,4316 | -1,1227 | |
| 0,00 | 0,00 | -0,7392 | ||
| 0,00 | 0,00 | -0,5613 | ||
| 0,00 | 0,00 | -0,3988 | ||
| 0,00 | 0,01 | 0,4095 | -0,3796 | |
| 0,00 | 0,02 | 0,8093 | -0,3664 | |
| 0,00 | 0,01 | 0,4411 | -0,2873 | |
| 0,00 | 0,01 | 0,3971 | -0,2363 | |
| 0,00 | 0,01 | 0,6746 | -0,2328 | |
| 0,00 | 0,03 | 1,3288 | -0,2207 |
Déclarations 13F et dépôts de fonds
Ce formulaire a été déposé le 2025-06-05 pour la période de déclaration 2025-04-30. Cliquez sur l'icône du lien pour voir l'historique complet des transactions.
Mettre à niveau pour débloquer les données premium et exporter vers Excel ![]() .
.
| Titre | Type | Prix moyen de l'action | Actions (en millions) |
ΔActions (%) |
ΔActions (%) |
Valeur ($ en millions) |
Portefeuille (%) |
ΔPortefeuille (%) |
|
|---|---|---|---|---|---|---|---|---|---|
| US8575093013 / State Street Navigator Securities Lending Government Money Market Portfolio | 0,05 | 823,54 | 0,05 | 860,00 | 2,5318 | 2,3002 | |||
| PCRX / Pacira BioSciences, Inc. | 0,00 | 0,00 | 0,04 | 2,94 | 1,8718 | 0,3241 | |||
| ATGE / Adtalem Global Education Inc. | 0,00 | 0,00 | 0,03 | 0,00 | 1,7401 | 0,2572 | |||
| EZPW / EZCORP, Inc. | 0,00 | 0,00 | 0,03 | 38,10 | 1,5380 | 0,5848 | |||
| MWA / Mueller Water Products, Inc. | 0,00 | 0,00 | 0,03 | 13,64 | 1,3312 | 0,3455 | |||
| CDNA / CareDx, Inc | 0,00 | 0,00 | 0,03 | -26,47 | 1,3288 | -0,2207 | |||
| EE / Excelerate Energy, Inc. | 0,00 | 0,00 | 0,02 | -14,29 | 1,2870 | 0,0174 | |||
| TNK / Teekay Tankers Ltd. | 0,00 | 0,00 | 0,02 | 4,35 | 1,2788 | 0,2150 | |||
| DNOW / DNOW Inc. | 0,00 | 0,00 | 0,02 | 9,52 | 1,2302 | 0,2558 | |||
| RLAY / Relay Therapeutics, Inc. | 0,01 | 50,05 | 0,02 | 15,79 | 1,1656 | 0,2847 | |||
| AGS / The Hour Glass Limited | 0,00 | 0,00 | 0,02 | -4,55 | 1,1396 | 0,1441 | |||
| PAGS / PagSeguro Digital Ltd. | 0,00 | 0,02 | 1,1367 | 1,1367 | |||||
| FIXED INC CLEARING CORP.REPO / RA (000000000) | 0,02 | 1,1326 | 1,1326 | ||||||
| ITRI / Itron, Inc. | 0,00 | 0,00 | 0,02 | 5,00 | 1,1163 | 0,2066 | |||
| HCI / HCI Group, Inc. | 0,00 | -25,00 | 0,02 | -8,70 | 1,1064 | 0,0678 | |||
| TCMD / Tactile Systems Technology, Inc. | 0,00 | 0,00 | 0,02 | -16,67 | 1,0515 | -0,0500 | |||
| ATEN / A10 Networks, Inc. | 0,00 | 0,00 | 0,02 | -17,39 | 1,0394 | -0,0054 | |||
| DGII / Digi International Inc. | 0,00 | 0,00 | 0,02 | -13,64 | 1,0256 | 0,0302 | |||
| STNE / StoneCo Ltd. | 0,00 | 0,00 | 0,02 | 58,33 | 1,0212 | 0,4585 | |||
| CIVB / Civista Bancshares, Inc. | 0,00 | 36,23 | 0,02 | 46,15 | 1,0178 | 0,3993 | |||
| TPH / Tri Pointe Homes, Inc. | 0,00 | 0,00 | 0,02 | -17,39 | 1,0158 | -0,0128 | |||
| OFG / OFG Bancorp | 0,00 | 0,00 | 0,02 | -10,00 | 0,9878 | 0,0821 | |||
| CMC / Commercial Metals Company | 0,00 | 0,00 | 0,02 | -10,00 | 0,9824 | 0,0789 | |||
| TERN / Terns Pharmaceuticals, Inc. | 0,01 | 0,02 | 0,9800 | 0,9800 | |||||
| INVX / Innovex International, Inc. | 0,00 | 0,00 | 0,02 | -5,26 | 0,9754 | 0,1252 | |||
| CARG / CarGurus, Inc. | 0,00 | 0,00 | 0,02 | -28,00 | 0,9544 | -0,1760 | |||
| HAFC / Hanmi Financial Corporation | 0,00 | 0,00 | 0,02 | -5,26 | 0,9536 | 0,1075 | |||
| HCKT / The Hackett Group, Inc. | 0,00 | 0,00 | 0,02 | -14,29 | 0,9523 | -0,0204 | |||
| RAMP / LiveRamp Holdings, Inc. | 0,00 | 0,00 | 0,02 | -21,74 | 0,9507 | -0,0931 | |||
| US60471A1016 / Mirion Technologies, Inc. | 0,00 | 0,00 | 0,02 | 0,00 | 0,9497 | 0,1444 | |||
| YEXT / Yext, Inc. | 0,00 | 0,00 | 0,02 | 5,88 | 0,9496 | 0,1733 | |||
| AVA / Avista Corporation | 0,00 | 0,00 | 0,02 | 20,00 | 0,9496 | 0,2412 | |||
| CSTM / Constellium SE | 0,00 | 12,63 | 0,02 | 20,00 | 0,9467 | 0,2493 | |||
| AMAL / Amalgamated Financial Corp. | 0,00 | 0,00 | 0,02 | -19,05 | 0,9169 | -0,0442 | |||
| OUT / OUTFRONT Media Inc. | 0,00 | 0,00 | 0,02 | -15,00 | 0,9026 | -0,0247 | |||
| RNST / Renasant Corporation | 0,00 | 0,00 | 0,02 | -15,00 | 0,8994 | -0,0217 | |||
| SUPN / Supernus Pharmaceuticals, Inc. | 0,00 | 0,00 | 0,02 | -15,00 | 0,8972 | 0,0018 | |||
| FBP / First BanCorp. | 0,00 | 0,00 | 0,02 | 0,00 | 0,8932 | 0,0956 | |||
| MRC / MRC Global Inc. | 0,00 | 13,01 | 0,02 | -11,11 | 0,8926 | 0,0518 | |||
| DOLE / Dole plc | 0,00 | 0,00 | 0,02 | 6,67 | 0,8791 | 0,2132 | |||
| VERV / Verve Therapeutics, Inc. | 0,00 | 0,00 | 0,02 | -27,27 | 0,8772 | -0,1174 | |||
| EFSC / Enterprise Financial Services Corp | 0,00 | 0,00 | 0,02 | -15,79 | 0,8715 | 0,0246 | |||
| RUSHA / Rush Enterprises, Inc. | 0,00 | 0,00 | 0,02 | -15,79 | 0,8623 | -0,0056 | |||
| LZB / La-Z-Boy Incorporated | 0,00 | 0,00 | 0,02 | -15,79 | 0,8609 | -0,0081 | |||
| BHE / Benchmark Electronics, Inc. | 0,00 | 0,00 | 0,02 | -23,81 | 0,8439 | -0,0910 | |||
| CSTL / Castle Biosciences, Inc. | 0,00 | 12,45 | 0,02 | -11,76 | 0,8371 | 0,0910 | |||
| DRH / DiamondRock Hospitality Company | 0,00 | 0,00 | 0,02 | -21,05 | 0,8369 | -0,0088 | |||
| URBN / Urban Outfitters, Inc. | 0,00 | 0,00 | 0,02 | -6,25 | 0,8316 | 0,0939 | |||
| ITOS / iTeos Therapeutics, Inc. | 0,00 | 0,00 | 0,02 | -6,25 | 0,8300 | 0,1008 | |||
| KFY / Korn Ferry | 0,00 | 26,24 | 0,02 | 7,14 | 0,8263 | 0,1924 | |||
| ABM / ABM Industries Incorporated | 0,00 | 0,00 | 0,02 | -11,76 | 0,8242 | 0,0619 | |||
| SPFI / South Plains Financial, Inc. | 0,00 | 0,02 | 0,8144 | 0,8144 | |||||
| REZI / Resideo Technologies, Inc. | 0,00 | 0,00 | 0,02 | -25,00 | 0,8143 | -0,1089 | |||
| ENS / EnerSys | 0,00 | 0,00 | 0,02 | -11,76 | 0,8141 | 0,0432 | |||
| TCBX / Third Coast Bancshares, Inc. | 0,00 | 0,02 | 0,8138 | 0,8138 | |||||
| ANF / Abercrombie & Fitch Co. | 0,00 | 0,00 | 0,02 | -42,31 | 0,8093 | -0,3664 | |||
| IGT / International Game Technology PLC | 0,00 | 158,45 | 0,02 | 114,29 | 0,8036 | 0,4725 | |||
| GIII / G-III Apparel Group, Ltd. | 0,00 | 0,00 | 0,02 | -16,67 | 0,7960 | -0,0364 | |||
| IVT / InvenTrust Properties Corp. | 0,00 | 0,02 | 0,7945 | 0,7945 | |||||
| INT / World Fuel Services Corp. | 0,00 | 0,00 | 0,02 | -6,25 | 0,7919 | 0,0381 | |||
| DEI / Douglas Emmett, Inc. | 0,00 | 0,02 | 0,7895 | 0,7895 | |||||
| NWN / Northwest Natural Holding Company | 0,00 | 0,00 | 0,01 | 7,69 | 0,7786 | 0,1694 | |||
| MD / Pediatrix Medical Group, Inc. | 0,00 | 0,01 | 0,7772 | 0,7772 | |||||
| MTW / The Manitowoc Company, Inc. | 0,00 | 132,84 | 0,01 | 16,67 | 0,7747 | 0,0363 | |||
| TPC / Tutor Perini Corporation | 0,00 | 0,00 | 0,01 | -12,50 | 0,7709 | 0,0399 | |||
| OBNK / Origin Bancorp Inc | 0,00 | 0,01 | 0,7706 | 0,7706 | |||||
| FFBC / First Financial Bancorp. | 0,00 | -16,40 | 0,01 | -26,32 | 0,7623 | -0,1036 | |||
| HCAT / Health Catalyst, Inc. | 0,00 | 115,82 | 0,01 | 55,56 | 0,7611 | 0,3365 | |||
| SHO / Sunstone Hotel Investors, Inc. | 0,00 | 0,00 | 0,01 | -26,32 | 0,7608 | -0,1123 | |||
| ASO / Academy Sports and Outdoors, Inc. | 0,00 | 0,00 | 0,01 | -30,00 | 0,7599 | -0,1313 | |||
| DXC / DXC Technology Company | 0,00 | 0,01 | 0,7531 | 0,7531 | |||||
| WETF / Wisdomtree Investments Inc | 0,00 | 0,00 | 0,01 | -6,67 | 0,7383 | 0,0365 | |||
| COLL / Collegium Pharmaceutical, Inc. | 0,00 | 0,00 | 0,01 | -18,75 | 0,7273 | -0,0037 | |||
| LIVN / LivaNova PLC | 0,00 | 0,00 | 0,01 | -27,78 | 0,7209 | -0,1012 | |||
| SCS / Steelcase Inc. | 0,00 | 0,00 | 0,01 | -13,33 | 0,7179 | 0,0161 | |||
| HUBG / Hub Group, Inc. | 0,00 | 7,11 | 0,01 | -23,53 | 0,7001 | -0,0797 | |||
| ROCK / Gibraltar Industries, Inc. | 0,00 | 5,06 | 0,01 | -23,53 | 0,6924 | -0,0774 | |||
| HLMN / Hillman Solutions Corp. | 0,00 | 0,01 | 0,6916 | 0,6916 | |||||
| 2IY / Cushman & Wakefield plc | 0,00 | 0,00 | 0,01 | -31,58 | 0,6884 | -0,1675 | |||
| MTX / Minerals Technologies Inc. | 0,00 | 115,25 | 0,01 | 44,44 | 0,6882 | 0,2867 | |||
| KOP / Koppers Holdings Inc. | 0,00 | 0,00 | 0,01 | -20,00 | 0,6778 | -0,0022 | |||
| LBRT / Liberty Energy Inc. | 0,00 | 0,00 | 0,01 | -40,00 | 0,6746 | -0,2328 | |||
| CTKB / Cytek Biosciences, Inc. | 0,00 | 0,00 | 0,01 | -29,41 | 0,6718 | -0,1160 | |||
| PAYO / Payoneer Global Inc. | 0,00 | 0,00 | 0,01 | -36,84 | 0,6708 | -0,1837 | |||
| DFIN / Donnelley Financial Solutions, Inc. | 0,00 | -3,99 | 0,01 | -25,00 | 0,6708 | -0,0560 | |||
| ACCO / ACCO Brands Corporation | 0,00 | 0,00 | 0,01 | -29,41 | 0,6609 | -0,0999 | |||
| KAR / OPENLANE, Inc. | 0,00 | 0,00 | 0,01 | -7,69 | 0,6600 | 0,0482 | |||
| RLJ / RLJ Lodging Trust | 0,00 | 0,00 | 0,01 | -29,41 | 0,6531 | -0,1143 | |||
| NWE / NorthWestern Energy Group, Inc. | 0,00 | 0,00 | 0,01 | 9,09 | 0,6483 | 0,1413 | |||
| ALNT / Allient Inc. | 0,00 | 0,01 | 0,6268 | 0,6268 | |||||
| VRNT / Verint Systems Inc. | 0,00 | 0,00 | 0,01 | -31,25 | 0,6105 | -0,1315 | |||
| AXL / American Axle & Manufacturing Holdings, Inc. | 0,00 | 0,00 | 0,01 | -26,67 | 0,6053 | -0,0948 | |||
| MXCT / MaxCyte, Inc. | 0,00 | 0,01 | 0,5973 | 0,5973 | |||||
| SAGE / Sage Therapeutics, Inc. | 0,00 | 0,00 | 0,01 | 0,00 | 0,5762 | 0,0921 | |||
| PRG / PROG Holdings, Inc. | 0,00 | 0,00 | 0,01 | -41,18 | 0,5745 | -0,2126 | |||
| CPRX / Catalyst Pharmaceuticals, Inc. | 0,00 | 0,00 | 0,01 | 0,00 | 0,5702 | 0,1228 | |||
| TNC / Tennant Company | 0,00 | 0,00 | 0,01 | -16,67 | 0,5684 | -0,0007 | |||
| IART / Integra LifeSciences Holdings Corporation | 0,00 | 0,00 | 0,01 | -37,50 | 0,5569 | -0,1923 | |||
| BLX / Banco Latinoamericano de Comercio Exterior, S. A. | 0,00 | 0,00 | 0,01 | 0,00 | 0,5531 | 0,0922 | |||
| VREX / Varex Imaging Corporation | 0,00 | 104,11 | 0,01 | 11,11 | 0,5431 | 0,1492 | |||
| BLDE / Strata Critical Medical, Inc. | 0,00 | 0,01 | 0,5332 | 0,5332 | |||||
| HSTM / HealthStream, Inc. | 0,00 | 0,00 | 0,01 | 11,11 | 0,5298 | 0,0953 | |||
| NMRK / Newmark Group, Inc. | 0,00 | -36,12 | 0,01 | 100,00 | 0,5287 | -0,0660 | |||
| HDSN / Hudson Technologies, Inc. | 0,00 | 0,00 | 0,01 | 25,00 | 0,5270 | 0,1410 | |||
| FTDR / Frontdoor, Inc. | 0,00 | 0,00 | 0,01 | -35,71 | 0,5246 | -0,1209 | |||
| HP / Helmerich & Payne, Inc. | 0,00 | 0,00 | 0,01 | -43,75 | 0,5119 | -0,2113 | |||
| CRI / Carter's, Inc. | 0,00 | 0,01 | 0,5103 | 0,5103 | |||||
| SANM / Sanmina Corporation | 0,00 | 0,00 | 0,01 | -10,00 | 0,5041 | 0,0398 | |||
| PRTA / Prothena Corporation plc | 0,00 | 0,00 | 0,01 | -35,71 | 0,4967 | -0,1523 | |||
| OFIX / Orthofix Medical Inc. | 0,00 | 0,00 | 0,01 | -25,00 | 0,4924 | -0,0557 | |||
| EPRT / Essential Properties Realty Trust, Inc. | 0,00 | 0,00 | 0,01 | 0,00 | 0,4916 | 0,0772 | |||
| BKH / Black Hills Corporation | 0,00 | 0,00 | 0,01 | 12,50 | 0,4893 | 0,0907 | |||
| YELP / Yelp Inc. | 0,00 | 0,00 | 0,01 | -20,00 | 0,4679 | 0,0179 | |||
| ARVN / Arvinas, Inc. | 0,00 | 0,01 | 0,4602 | 0,4602 | |||||
| OII / Oceaneering International, Inc. | 0,00 | 0,00 | 0,01 | -33,33 | 0,4577 | -0,0836 | |||
| BRC / Brady Corporation | 0,00 | 0,00 | 0,01 | -11,11 | 0,4540 | 0,0476 | |||
| VECO / Veeco Instruments Inc. | 0,00 | 0,00 | 0,01 | -27,27 | 0,4419 | -0,0648 | |||
| SHOO / Steven Madden, Ltd. | 0,00 | 0,00 | 0,01 | -50,00 | 0,4411 | -0,2873 | |||
| STRL / Sterling Infrastructure, Inc. | 0,00 | -77,64 | 0,01 | -77,14 | 0,4316 | -1,1227 | |||
| STBA / S&T Bancorp, Inc. | 0,00 | -49,05 | 0,01 | -36,36 | 0,4095 | -0,3796 | |||
| ZNTL / Zentalis Pharmaceuticals, Inc. | 0,01 | 0,00 | 0,01 | -22,22 | 0,4081 | -0,0143 | |||
| THR / Thermon Group Holdings, Inc. | 0,00 | 0,01 | 0,3995 | 0,3995 | |||||
| VC / Visteon Corporation | 0,00 | 0,01 | 0,3992 | 0,3992 | |||||
| UPWK / Upwork Inc. | 0,00 | 0,01 | 0,3985 | 0,3985 | |||||
| PENG / Penguin Solutions, Inc. | 0,00 | -37,07 | 0,01 | -50,00 | 0,3971 | -0,2363 | |||
| OSPN / OneSpan Inc. | 0,00 | 0,01 | 0,3920 | 0,3920 | |||||
| ENR / Energizer Holdings, Inc. | 0,00 | 0,00 | 0,01 | -22,22 | 0,3834 | -0,0237 | |||
| SYNA / Synaptics Incorporated | 0,00 | 0,01 | 0,3829 | 0,3829 | |||||
| PTEN / Patterson-UTI Energy, Inc. | 0,00 | 0,01 | 0,3779 | 0,3779 | |||||
| OMCL / Omnicell, Inc. | 0,00 | 0,01 | 0,3677 | 0,3677 | |||||
| BRY / Berry Corporation | 0,00 | 0,00 | 0,01 | -45,45 | 0,3315 | -0,1608 | |||
| STAG / STAG Industrial, Inc. | 0,00 | 0,00 | 0,01 | -16,67 | 0,3140 | 0,0395 | |||
| PSFE / Paysafe Limited | 0,00 | 0,00 | 0,00 | 0,0008 | -0,0001 | ||||
| STNG / Scorpio Tankers Inc. | 0,00 | -100,00 | 0,00 | -100,00 | -0,1986 | ||||
| APOG / Apogee Enterprises, Inc. | 0,00 | -100,00 | 0,00 | -100,00 | -0,5613 | ||||
| SLVM / Sylvamo Corporation | 0,00 | -100,00 | 0,00 | -100,00 | -0,7392 | ||||
| PGC / Peapack-Gladstone Financial Corporation | 0,00 | -100,00 | 0,00 | -100,00 | -0,3988 |