Statistiques de base
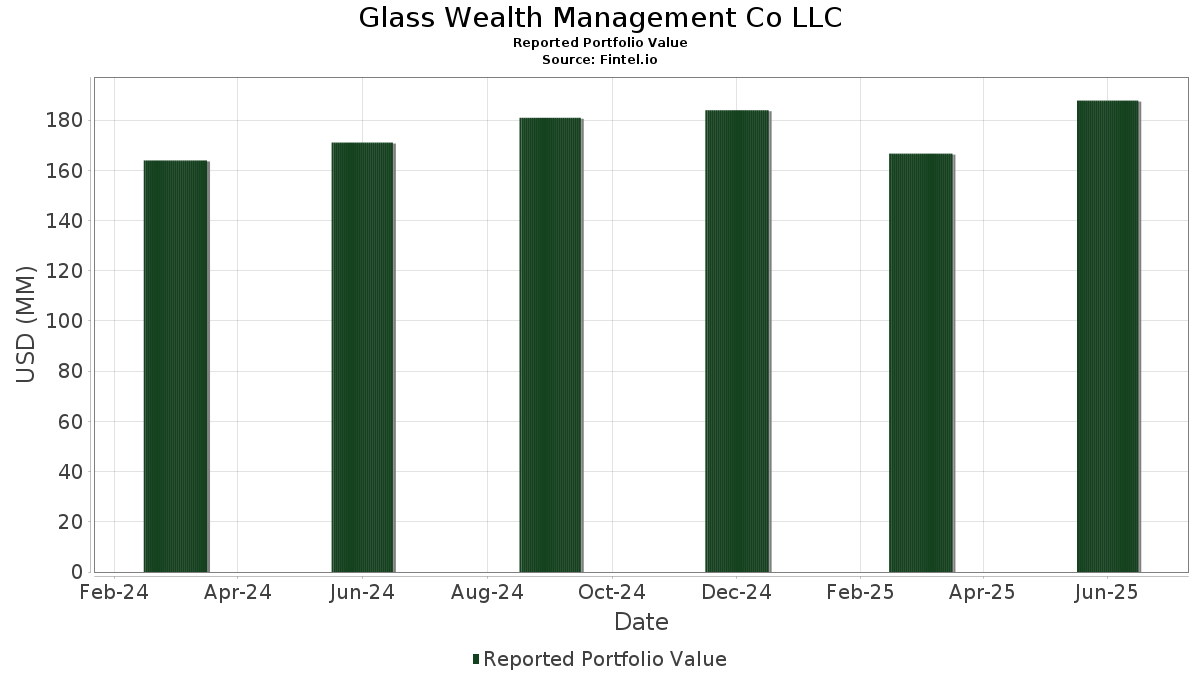
| Valeur du portefeuille | $ 187 782 358 |
| Positions actuelles | 56 |
Dernières positions, performances, ASG (à partir des dépôts 13F, 13D)
Glass Wealth Management Co LLC a déclaré un total de 56 positions dans ses derniers dépôts auprès de la SEC. La valeur la plus récente du portefeuille est calculée à 187 782 358 USD. Les actifs sous gestion réels (ASG) sont cette valeur plus les liquidités (qui ne sont pas divulguées). Les principales positions de Glass Wealth Management Co LLC sont Broadcom Inc. (US:AVGO) , Microsoft Corporation (US:MSFT) , Apple Inc. (US:AAPL) , Direxion Shares ETF Trust - Direxion Daily NVDA Bear 1X Shares (US:NVDD) , and Amazon.com, Inc. (US:AMZN) . Les nouvelles positions de Glass Wealth Management Co LLC incluent Barrick Mining Corporation (US:B) , .
Meilleures augmentations ce trimestre
Nous utilisons la variation de l'allocation du portefeuille car il s'agit de l'indicateur le plus significatif. Les changements peuvent être dus à des transactions ou à des variations de prix des actions.
| Titre | Actions (en millions) |
Valeur ($ en millions) |
% du portefeuille | ΔPortefeuille % |
|---|---|---|---|---|
| 0,10 | 26,51 | 14,1186 | 4,1241 | |
| 0,19 | 3,98 | 2,1202 | 2,1202 | |
| 0,03 | 14,56 | 7,7559 | 1,1274 | |
| 0,05 | 8,24 | 4,3867 | 1,1231 | |
| 0,00 | 2,15 | 1,1454 | 0,3514 | |
| 0,03 | 2,81 | 1,4965 | 0,3361 | |
| 0,09 | 5,18 | 2,7584 | 0,2520 | |
| 0,01 | 2,59 | 1,3790 | 0,1865 | |
| 0,02 | 4,39 | 2,3403 | 0,1644 | |
| 0,00 | 1,76 | 0,9372 | 0,1559 |
Principales baisses ce trimestre
Nous utilisons la variation de l'allocation du portefeuille car il s'agit de l'indicateur le plus significatif. Les changements peuvent être dus à des transactions ou à des variations de prix des actions.
| Titre | Actions (en millions) |
Valeur ($ en millions) |
% du portefeuille | ΔPortefeuille % |
|---|---|---|---|---|
| 0,04 | 9,22 | 4,9122 | -1,3298 | |
| 0,07 | 7,14 | 3,8004 | -0,9193 | |
| 0,02 | 3,22 | 1,7147 | -0,5419 | |
| 0,00 | 1,37 | 0,7277 | -0,4786 | |
| 0,02 | 1,78 | 0,9496 | -0,3460 | |
| 0,03 | 2,28 | 1,2134 | -0,3447 | |
| 0,03 | 3,31 | 1,7620 | -0,3296 | |
| 0,02 | 2,76 | 1,4674 | -0,3201 | |
| 0,01 | 4,06 | 2,1633 | -0,2960 | |
| 0,04 | 3,10 | 1,6503 | -0,2883 |
Déclarations 13F et dépôts de fonds
Ce formulaire a été déposé le 2025-07-22 pour la période de déclaration 2025-06-30. Cliquez sur l'icône du lien pour voir l'historique complet des transactions.
Mettre à niveau pour débloquer les données premium et exporter vers Excel ![]() .
.
| Titre | Type | Prix moyen de l'action | Actions (en millions) |
ΔActions (%) |
ΔActions (%) |
Valeur ($ en millions) |
Portefeuille (%) |
ΔPortefeuille (%) |
|
|---|---|---|---|---|---|---|---|---|---|
| AVGO / Broadcom Inc. | 0,10 | -3,32 | 26,51 | 59,17 | 14,1186 | 4,1241 | |||
| MSFT / Microsoft Corporation | 0,03 | -0,50 | 14,56 | 31,85 | 7,7559 | 1,1274 | |||
| AAPL / Apple Inc. | 0,04 | -4,00 | 9,22 | -11,32 | 4,9122 | -1,3298 | |||
| NVDD / Direxion Shares ETF Trust - Direxion Daily NVDA Bear 1X Shares | 0,05 | 3,90 | 8,24 | 51,47 | 4,3867 | 1,1231 | |||
| AMZN / Amazon.com, Inc. | 0,03 | 0,51 | 7,14 | 15,90 | 3,8037 | 0,1057 | |||
| XOM / Exxon Mobil Corporation | 0,07 | 0,10 | 7,14 | -9,27 | 3,8004 | -0,9193 | |||
| GOOGL / Alphabet Inc. | 0,04 | 2,05 | 6,53 | 16,31 | 3,4754 | 0,1083 | |||
| FCX / Freeport-McMoRan Inc. | 0,13 | 2,41 | 5,49 | 17,27 | 2,9216 | 0,1142 | |||
| NEM / Newmont Corporation | 0,09 | 2,76 | 5,18 | 23,99 | 2,7584 | 0,2520 | |||
| RTX / RTX Corporation | 0,03 | -1,03 | 4,78 | 9,11 | 2,5452 | -0,0833 | |||
| LMT / Lockheed Martin Corporation | 0,01 | 0,51 | 4,47 | 4,20 | 2,3788 | -0,1934 | |||
| LHX / L3Harris Technologies, Inc. | 0,02 | 1,13 | 4,39 | 21,18 | 2,3403 | 0,1644 | |||
| CFR / Cullen/Frost Bankers, Inc. | 0,03 | -0,59 | 4,30 | 2,06 | 2,2917 | -0,2385 | |||
| BAC / Bank of America Corporation | 0,09 | -7,37 | 4,26 | 5,06 | 2,2671 | -0,1648 | |||
| NOC / Northrop Grumman Corporation | 0,01 | 1,50 | 4,06 | -0,88 | 2,1633 | -0,2960 | |||
| B / Barrick Mining Corporation | 0,19 | 3,98 | 2,1202 | 2,1202 | |||||
| MS / Morgan Stanley | 0,02 | 0,50 | 3,43 | 21,31 | 1,8255 | 0,1302 | |||
| PSX / Phillips 66 | 0,03 | -1,75 | 3,31 | -5,08 | 1,7620 | -0,3296 | |||
| TFC / Truist Financial Corporation | 0,08 | 2,28 | 3,27 | 6,87 | 1,7400 | -0,0948 | |||
| CVX / Chevron Corporation | 0,02 | 0,03 | 3,22 | -14,39 | 1,7147 | -0,5419 | |||
| SHEL / Shell plc - Depositary Receipt (Common Stock) | 0,04 | -0,17 | 3,10 | -4,09 | 1,6503 | -0,2883 | |||
| LRCX / Lam Research Corporation | 0,03 | 8,53 | 2,81 | 45,37 | 1,4965 | 0,3361 | |||
| PG / The Procter & Gamble Company | 0,02 | -1,06 | 2,76 | -7,49 | 1,4674 | -0,3201 | |||
| NTR / Nutrien Ltd. | 0,05 | -1,56 | 2,73 | 15,41 | 1,4558 | 0,0346 | |||
| V / Visa Inc. | 0,01 | 8,93 | 2,67 | 10,37 | 1,4226 | -0,0299 | |||
| AMAT / Applied Materials, Inc. | 0,01 | 3,29 | 2,59 | 30,30 | 1,3790 | 0,1865 | |||
| EMR / Emerson Electric Co. | 0,02 | -1,16 | 2,44 | 20,25 | 1,3000 | 0,0813 | |||
| CTVA / Corteva, Inc. | 0,03 | -4,01 | 2,30 | 13,64 | 1,2253 | 0,0108 | |||
| MRK / Merck & Co., Inc. | 0,03 | -0,50 | 2,28 | -12,25 | 1,2134 | -0,3447 | |||
| LLY / Eli Lilly and Company | 0,00 | 3,30 | 2,24 | -2,52 | 1,1939 | -0,1858 | |||
| ASML / ASML Holding N.V. - Depositary Receipt (Common Stock) | 0,00 | 34,40 | 2,15 | 62,51 | 1,1454 | 0,3514 | |||
| ADBE / Adobe Inc. | 0,01 | 0,37 | 2,08 | 1,27 | 1,1064 | -0,1249 | |||
| PFE / Pfizer Inc. | 0,09 | -2,20 | 2,07 | -6,47 | 1,1017 | -0,2252 | |||
| CSCO / Cisco Systems, Inc. | 0,03 | 1,55 | 2,04 | 14,20 | 1,0883 | 0,0143 | |||
| TXN / Texas Instruments Incorporated | 0,01 | -1,63 | 2,00 | 13,67 | 1,0633 | 0,0092 | |||
| UPS / United Parcel Service, Inc. | 0,02 | -10,01 | 1,78 | -17,42 | 0,9496 | -0,3460 | |||
| ETN / Eaton Corporation plc | 0,00 | 2,92 | 1,76 | 35,10 | 0,9372 | 0,1559 | |||
| GD / General Dynamics Corporation | 0,01 | 1,27 | 1,74 | 8,35 | 0,9265 | -0,0369 | |||
| SNY / Sanofi - Depositary Receipt (Common Stock) | 0,03 | 2,90 | 1,59 | -10,40 | 0,8451 | -0,2173 | |||
| NVS / Novartis AG - Depositary Receipt (Common Stock) | 0,01 | 0,00 | 1,49 | 8,53 | 0,7933 | -0,0302 | |||
| INTC / Intel Corporation | 0,06 | -0,32 | 1,44 | -1,64 | 0,7686 | -0,1122 | |||
| TMO / Thermo Fisher Scientific Inc. | 0,00 | -16,58 | 1,37 | -32,04 | 0,7277 | -0,4786 | |||
| JPM / JPMorgan Chase & Co. | 0,00 | -4,93 | 0,97 | 12,37 | 0,5177 | -0,0014 | |||
| GE / General Electric Company | 0,00 | -22,81 | 0,88 | -0,68 | 0,4660 | -0,0630 | |||
| MCHP / Microchip Technology Incorporated | 0,01 | -11,86 | 0,82 | 28,28 | 0,4372 | 0,0527 | |||
| BLK / BlackRock, Inc. | 0,00 | -2,68 | 0,76 | 7,79 | 0,4057 | -0,0180 | |||
| IBM / International Business Machines Corporation | 0,00 | -8,24 | 0,57 | 8,71 | 0,3061 | -0,0110 | |||
| COP / ConocoPhillips | 0,01 | -7,79 | 0,45 | -21,15 | 0,2404 | -0,1034 | |||
| HD / The Home Depot, Inc. | 0,00 | -2,40 | 0,40 | -2,43 | 0,2146 | -0,0330 | |||
| WMT / Walmart Inc. | 0,00 | 0,00 | 0,38 | 11,34 | 0,2041 | -0,0024 | |||
| ABT / Abbott Laboratories | 0,00 | 0,00 | 0,36 | 2,57 | 0,1912 | -0,0189 | |||
| GOOG / Alphabet Inc. | 0,00 | 0,00 | 0,34 | 13,85 | 0,1795 | 0,0014 | |||
| SO / The Southern Company | 0,00 | 0,00 | 0,27 | -0,37 | 0,1438 | -0,0184 | |||
| OKE / ONEOK, Inc. | 0,00 | 0,00 | 0,23 | -17,73 | 0,1239 | -0,0458 | |||
| T / AT&T Inc. | 0,01 | -0,56 | 0,22 | 1,83 | 0,1187 | -0,0127 | |||
| AMGN / Amgen Inc. | 0,00 | 7,09 | 0,21 | -4,11 | 0,1123 | -0,0195 | |||
| GOLD / Barrick Mining Corporation | 0,00 | -100,00 | 0,00 | 0,0000 | |||||
| PEP / PepsiCo, Inc. | 0,00 | -100,00 | 0,00 | 0,0000 | |||||
| DOW / Dow Inc. | 0,00 | -100,00 | 0,00 | 0,0000 | |||||
| SNPS / Synopsys, Inc. | 0,00 | -100,00 | 0,00 | -100,00 | -0,1930 |