Statistiques de base
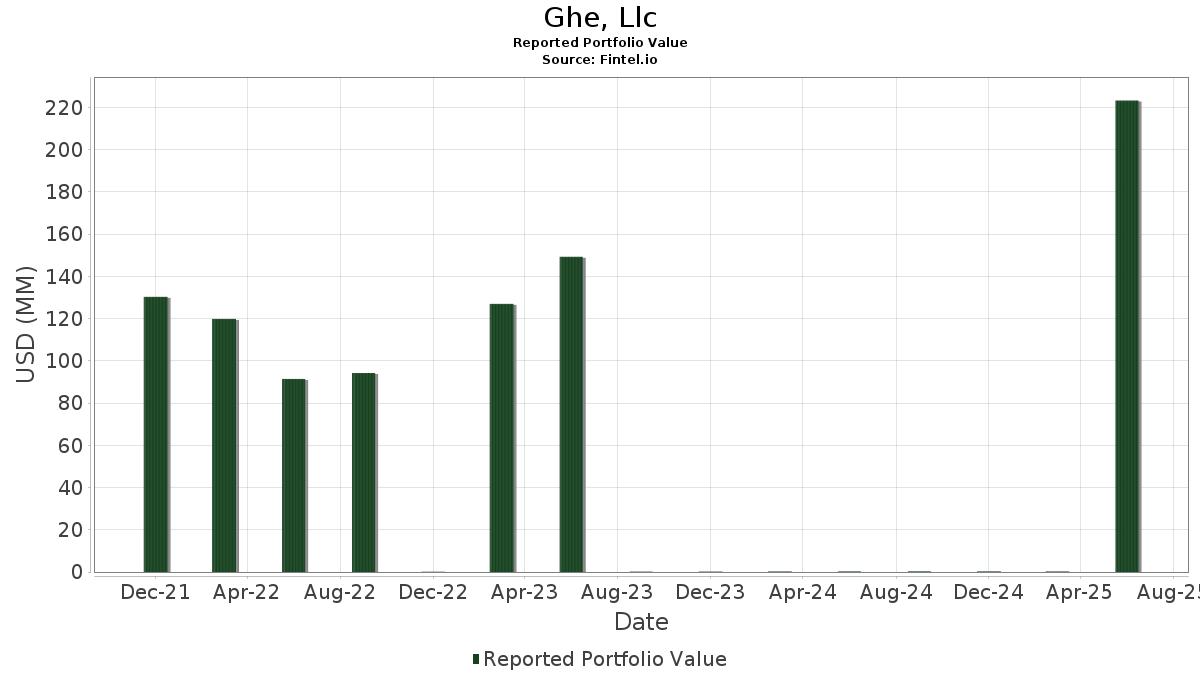
| Valeur du portefeuille | $ 223 199 731 |
| Positions actuelles | 35 |
Dernières positions, performances, ASG (à partir des dépôts 13F, 13D)
Ghe, Llc a déclaré un total de 35 positions dans ses derniers dépôts auprès de la SEC. La valeur la plus récente du portefeuille est calculée à 223 199 731 USD. Les actifs sous gestion réels (ASG) sont cette valeur plus les liquidités (qui ne sont pas divulguées). Les principales positions de Ghe, Llc sont NVIDIA Corporation (US:NVDA) , Adobe Inc. (US:ADBE) , PIMCO Corporate & Income Strategy Fund (US:PCN) , Moody's Corporation (US:MCO) , and S&P Global Inc. (US:SPGI) .
Meilleures augmentations ce trimestre
Nous utilisons la variation de l'allocation du portefeuille car il s'agit de l'indicateur le plus significatif. Les changements peuvent être dus à des transactions ou à des variations de prix des actions.
| Titre | Actions (en millions) |
Valeur ($ en millions) |
% du portefeuille | ΔPortefeuille % |
|---|---|---|---|---|
| 0,80 | 127,11 | 56,9470 | 16,9902 | |
| 0,03 | 3,32 | 1,4880 | 0,4385 | |
| 0,02 | 5,51 | 2,4705 | 0,3819 | |
| 0,02 | 1,09 | 0,4872 | 0,1389 | |
| 0,05 | 0,58 | 0,2604 | 0,0423 | |
| 0,07 | 1,54 | 0,6896 | 0,0381 | |
| 0,03 | 1,96 | 0,8794 | 0,0208 | |
| 0,02 | 0,02 | 0,0083 | 0,0038 |
Principales baisses ce trimestre
Nous utilisons la variation de l'allocation du portefeuille car il s'agit de l'indicateur le plus significatif. Les changements peuvent être dus à des transactions ou à des variations de prix des actions.
| Titre | Actions (en millions) |
Valeur ($ en millions) |
% du portefeuille | ΔPortefeuille % |
|---|---|---|---|---|
| 0,02 | 5,85 | 2,6209 | -0,7801 | |
| 0,02 | 7,86 | 3,5223 | -0,5496 | |
| 0,02 | 4,39 | 1,9671 | -0,5106 | |
| 0,03 | 3,13 | 1,4042 | -0,4791 | |
| 0,01 | 3,53 | 1,5821 | -0,4442 | |
| 0,01 | 4,49 | 2,0099 | -0,3742 | |
| 0,01 | 6,05 | 2,7123 | -0,3467 | |
| 0,02 | 2,56 | 1,1486 | -0,3280 | |
| 0,03 | 1,90 | 0,8514 | -0,3072 | |
| 0,03 | 4,98 | 2,2307 | -0,3062 |
Déclarations 13F et dépôts de fonds
Ce formulaire a été déposé le 2025-09-05 pour la période de déclaration 2025-06-30. Cliquez sur l'icône du lien pour voir l'historique complet des transactions.
Mettre à niveau pour débloquer les données premium et exporter vers Excel ![]() .
.
| Titre | Type | Prix moyen de l'action | Actions (en millions) |
ΔActions (%) |
ΔActions (%) |
Valeur ($ en millions) |
Portefeuille (%) |
ΔPortefeuille (%) |
|
|---|---|---|---|---|---|---|---|---|---|
| NVDA / NVIDIA Corporation | 0,80 | -1,28 | 127,11 | 144 337,50 | 56,9470 | 16,9902 | |||
| ADBE / Adobe Inc. | 0,02 | -13,41 | 7,86 | 87 244,44 | 3,5223 | -0,5496 | |||
| PCN / PIMCO Corporate & Income Strategy Fund | 0,61 | 7,94 | 7,72 | 110 171,43 | 3,4585 | -0,0217 | |||
| MCO / Moody's Corporation | 0,01 | -12,54 | 7,17 | 102 328,57 | 3,2125 | -0,2311 | |||
| SPGI / S&P Global Inc. | 0,01 | -13,73 | 6,05 | 100 783,33 | 2,7123 | -0,3467 | |||
| PGR / The Progressive Corporation | 0,02 | -17,48 | 5,85 | 83 457,14 | 2,6209 | -0,7801 | |||
| AXP / American Express Company | 0,02 | 0,74 | 5,51 | 137 750,00 | 2,4705 | 0,3819 | |||
| MPC / Marathon Petroleum Corporation | 0,03 | -22,13 | 4,98 | 99 460,00 | 2,2307 | -0,3062 | |||
| ADP / Automatic Data Processing, Inc. | 0,01 | -15,67 | 4,49 | 89 600,00 | 2,0099 | -0,3742 | |||
| LOW / Lowe's Companies, Inc. | 0,02 | -15,74 | 4,39 | 87 700,00 | 1,9671 | -0,5106 | |||
| MCD / McDonald's Corporation | 0,01 | -15,72 | 3,53 | 88 175,00 | 1,5821 | -0,4442 | |||
| ANET / Arista Networks Inc | 0,03 | 8,43 | 3,32 | 165 950,00 | 1,4880 | 0,4385 | |||
| SBUX / Starbucks Corporation | 0,03 | -19,40 | 3,13 | 78 250,00 | 1,4042 | -0,4791 | |||
| QCOM / QUALCOMM Incorporated | 0,02 | -10,80 | 3,12 | 103 966,67 | 1,3989 | -0,1284 | |||
| PAYX / Paychex, Inc. | 0,02 | -16,69 | 2,56 | 85 333,33 | 1,1486 | -0,3280 | |||
| DHI / D.R. Horton, Inc. | 0,02 | -14,04 | 2,42 | 121 000,00 | 1,0854 | -0,1718 | |||
| E L F BEAUTY / COMM (268561103) | 0,02 | 2,31 | 0,0000 | ||||||
| PYPL / PayPal Holdings, Inc. | 0,03 | -9,22 | 1,96 | 196 100,00 | 0,8794 | 0,0208 | |||
| CSCO / Cisco Systems, Inc. | 0,03 | -14,73 | 1,96 | 97 800,00 | 0,8773 | -0,0465 | |||
| TNET / TriNet Group, Inc. | 0,03 | -19,63 | 1,90 | 94 900,00 | 0,8514 | -0,3072 | |||
| ABT / Abbott Laboratories | 0,01 | -14,43 | 1,75 | 174 700,00 | 0,7835 | -0,1181 | |||
| KBH / KB Home | 0,03 | -6,47 | 1,63 | 162 800,00 | 0,7303 | -0,1347 | |||
| TROW / T. Rowe Price Group, Inc. | 0,02 | -12,88 | 1,63 | 162 700,00 | 0,7294 | -0,0754 | |||
| CL / Colgate-Palmolive Company | 0,02 | -15,06 | 1,62 | 161 500,00 | 0,7242 | -0,1634 | |||
| BZH / Beazer Homes USA, Inc. | 0,07 | -2,60 | 1,54 | 153 800,00 | 0,6896 | 0,0381 | |||
| PEP / PepsiCo, Inc. | 0,01 | -12,60 | 1,47 | 146 800,00 | 0,6585 | -0,2055 | |||
| BBY / Best Buy Co., Inc. | 0,02 | -9,22 | 1,25 | 125 100,00 | 0,5610 | -0,1234 | |||
| EEM / iShares, Inc. - iShares MSCI Emerging Markets ETF | 0,02 | 0,00 | 1,09 | 0,4872 | 0,1389 | ||||
| EBAY / eBay Inc. | 0,01 | -19,19 | 1,00 | 100 000,00 | 0,4487 | -0,0611 | |||
| SYY / Sysco Corporation | 0,01 | -19,12 | 1,00 | 99 700,00 | 0,4475 | -0,1058 | |||
| PTY / PIMCO Corporate & Income Opportunity Fund | 0,05 | 0,98 | 0,72 | 0,3206 | -0,0128 | ||||
| DSL / DoubleLine Income Solutions Fund | 0,05 | 24,28 | 0,58 | 0,2604 | 0,0423 | ||||
| PDI / PIMCO Dynamic Income Fund | 0,02 | 2,69 | 0,33 | 0,1462 | -0,0040 | ||||
| BSCQ / Invesco Exchange-Traded Self-Indexed Fund Trust - Invesco BulletShares 2026 Corporate Bond ETF | 0,01 | 0,00 | 0,23 | 0,1049 | -0,0009 | ||||
| CHGG / Chegg, Inc. | 0,02 | 0,00 | 0,02 | 0,0083 | 0,0038 | ||||
| HD / The Home Depot, Inc. | 0,00 | -100,00 | 0,00 | 0,0000 | |||||
| COST / Costco Wholesale Corporation | 0,00 | -100,00 | 0,00 | 0,0000 | |||||
| MSCI / MSCI Inc. | 0,00 | -100,00 | 0,00 | 0,0000 | |||||
| GJR / Strats Trust For Procter & Gambel Security - Preferred Security | 0,00 | -100,00 | 0,00 | 0,0000 | |||||
| TIP / iShares Trust - iShares TIPS Bond ETF | 0,00 | -100,00 | 0,00 | 0,0000 | |||||
| ATGE / Adtalem Global Education Inc. | 0,00 | -100,00 | 0,00 | 0,0000 | |||||
| STRA / Strategic Education, Inc. | 0,00 | -100,00 | 0,00 | 0,0000 | |||||
| MAR / Marriott International, Inc. | 0,00 | -100,00 | 0,00 | 0,0000 | |||||
| ULTA / Ulta Beauty, Inc. | 0,00 | -100,00 | 0,00 | 0,0000 | |||||
| XYZ / Block, Inc. | 0,00 | -100,00 | 0,00 | 0,0000 | |||||
| BOOKING HOLDINGS INC COM / COMM (098571108) | 0,00 | -100,00 | 0,00 | 0,0000 | |||||
| CB / Chubb Limited | 0,00 | -100,00 | 0,00 | 0,0000 | |||||
| GSCE / GS Connect S&P GSCI Enhanced Commodity Total Return ETN | 0,00 | -100,00 | 0,00 | 0,0000 | |||||
| WFC / Wells Fargo & Company | 0,00 | -100,00 | 0,00 | 0,0000 | |||||
| SEIC / SEI Investments Company | 0,00 | -100,00 | 0,00 | 0,0000 | |||||
| AAPL / Apple Inc. | 0,00 | -100,00 | 0,00 | 0,0000 | |||||
| JNJ / Johnson & Johnson | 0,00 | -100,00 | 0,00 | 0,0000 | |||||
| MDY / SPDR S&P MidCap 400 ETF Trust | 0,00 | -100,00 | 0,00 | 0,0000 | |||||
| VYM / Vanguard Whitehall Funds - Vanguard High Dividend Yield ETF | 0,00 | -100,00 | 0,00 | 0,0000 | |||||
| EXPE / Expedia Group, Inc. | 0,00 | -100,00 | 0,00 | 0,0000 | |||||
| SPG / Simon Property Group, Inc. | 0,00 | -100,00 | 0,00 | 0,0000 |