Statistiques de base
| Valeur du portefeuille | $ 64 572 000 |
| Positions actuelles | 85 |
Dernières positions, performances, ASG (à partir des dépôts 13F, 13D)
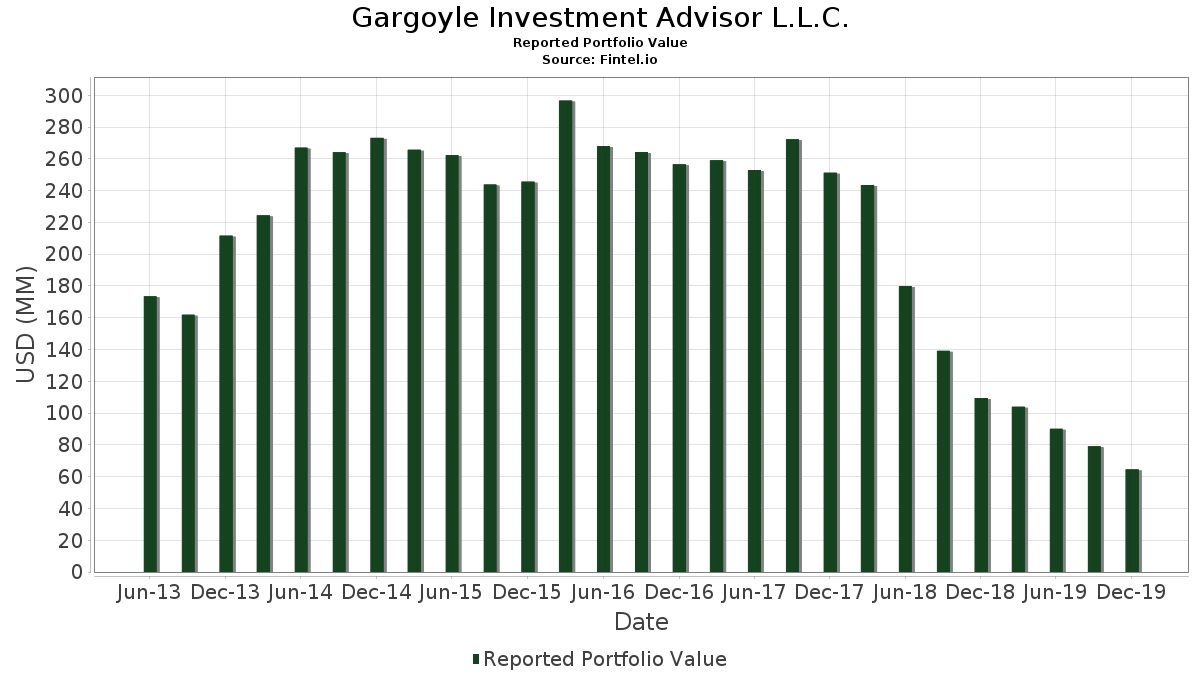
Gargoyle Investment Advisor L.L.C. a déclaré un total de 85 positions dans ses derniers dépôts auprès de la SEC. La valeur la plus récente du portefeuille est calculée à 64 572 000 USD. Les actifs sous gestion réels (ASG) sont cette valeur plus les liquidités (qui ne sont pas divulguées). Les principales positions de Gargoyle Investment Advisor L.L.C. sont United Rentals, Inc. (US:URI) , Citigroup Inc. (US:C) , Stericycle, Inc. (US:SRCL) , Micron Technology, Inc. (US:MU) , and DISH Network Corporation (US:DISH) . Les nouvelles positions de Gargoyle Investment Advisor L.L.C. incluent ViacomCBS Inc (US:) , .
Meilleures augmentations ce trimestre
Nous utilisons la variation de l'allocation du portefeuille car il s'agit de l'indicateur le plus significatif. Les changements peuvent être dus à des transactions ou à des variations de prix des actions.
| Titre | Actions (en millions) |
Valeur ($ en millions) |
% du portefeuille | ΔPortefeuille % |
|---|---|---|---|---|
| 0,03 | 1,07 | 1,6586 | 1,6586 | |
| 0,01 | 0,64 | 0,9834 | 0,9834 | |
| 0,02 | 0,48 | 0,7496 | 0,7496 | |
| 0,01 | 0,46 | 0,7139 | 0,7139 | |
| 0,01 | 0,46 | 0,7093 | 0,7093 | |
| 0,01 | 0,43 | 0,6628 | 0,6628 | |
| 0,02 | 1,45 | 2,2394 | 0,6600 | |
| 0,01 | 1,48 | 2,2951 | 0,6400 | |
| 0,01 | 0,37 | 0,5684 | 0,5684 | |
| 0,01 | 0,97 | 1,5068 | 0,4632 |
Principales baisses ce trimestre
Nous utilisons la variation de l'allocation du portefeuille car il s'agit de l'indicateur le plus significatif. Les changements peuvent être dus à des transactions ou à des variations de prix des actions.
| Titre | Actions (en millions) |
Valeur ($ en millions) |
% du portefeuille | ΔPortefeuille % |
|---|---|---|---|---|
| 0,00 | 0,00 | -1,3961 | ||
| 0,00 | 0,00 | -1,2913 | ||
| 0,00 | 0,00 | -0,9463 | ||
| 0,01 | 0,36 | 0,5591 | -0,9407 | |
| 0,00 | 0,00 | -0,8642 | ||
| 0,00 | 0,00 | -0,7783 | ||
| 0,00 | 0,00 | -0,6608 | ||
| 0,00 | 0,00 | -0,5420 | ||
| 0,00 | 0,00 | -0,5218 | ||
| 0,00 | 0,00 | -0,5155 |
Déclarations 13F et dépôts de fonds
Ce formulaire a été déposé le 2020-02-18 pour la période de déclaration 2019-12-31. Cliquez sur l'icône du lien pour voir l'historique complet des transactions.
Mettre à niveau pour débloquer les données premium et exporter vers Excel ![]() .
.
| Titre | Type | Prix moyen de l'action | Actions (en millions) |
ΔActions (%) |
ΔActions (%) |
Valeur ($ en millions) |
Portefeuille (%) |
ΔPortefeuille (%) |
|
|---|---|---|---|---|---|---|---|---|---|
| URI / United Rentals, Inc. | 0,01 | -15,42 | 1,48 | 13,13 | 2,2951 | 0,6400 | |||
| C / Citigroup Inc. | 0,02 | 0,00 | 1,45 | 15,68 | 2,2394 | 0,6600 | |||
| SRCL / Stericycle, Inc. | 0,02 | -23,38 | 1,40 | -4,04 | 2,1697 | 0,3250 | |||
| MU / Micron Technology, Inc. | 0,02 | -16,75 | 1,34 | 4,53 | 2,0706 | 0,4546 | |||
| DISH / DISH Network Corporation | 0,04 | -3,19 | 1,27 | 0,79 | 1,9699 | 0,3754 | |||
| NUAN / Nuance Communications Inc | 0,07 | -20,26 | 1,23 | -12,78 | 1,9018 | 0,1228 | |||
| ESNT / Essent Group Ltd. | 0,02 | -5,98 | 1,23 | 2,59 | 1,8987 | 0,3888 | |||
| CAG / Conagra Brands, Inc. | 0,03 | -21,19 | 1,15 | -12,05 | 1,7748 | 0,1285 | |||
| DKS / DICK'S Sporting Goods, Inc. | 0,02 | -28,19 | 1,12 | -12,94 | 1,7299 | 0,1088 | |||
| SF / Stifel Financial Corp. | 0,02 | 0,00 | 1,08 | 5,65 | 1,6803 | 0,3827 | |||
| / ViacomCBS Inc | 0,03 | 1,07 | 1,6586 | 1,6586 | |||||
| AN / AutoNation, Inc. | 0,02 | -13,23 | 1,06 | -16,78 | 1,6431 | 0,0322 | |||
| ZBH / Zimmer Biomet Holdings, Inc. | 0,01 | -12,37 | 1,06 | -4,50 | 1,6416 | 0,2391 | |||
| BKR / Baker Hughes Company | 0,04 | -19,27 | 1,05 | -10,83 | 1,6199 | 0,1379 | |||
| US7587501039 / Regal-Beloit Corp. | 0,01 | -15,02 | 1,04 | -0,19 | 1,6168 | 0,2952 | |||
| OTEX / Open Text Corporation | 0,02 | -24,20 | 1,02 | -18,11 | 1,5827 | 0,0059 | |||
| PACW / Pacwest Bancorp | 0,03 | 0,00 | 1,00 | 5,35 | 1,5549 | 0,3508 | |||
| T / AT&T Inc. | 0,03 | -14,96 | 0,99 | -12,18 | 1,5409 | 0,1094 | |||
| BIIB / Biogen Inc. | 0,00 | -13,03 | 0,99 | 10,86 | 1,5332 | 0,4049 | |||
| EMN / Eastman Chemical Company | 0,01 | -32,03 | 0,98 | -27,06 | 1,5239 | -0,1805 | |||
| CVS / CVS Health Corporation | 0,01 | 0,00 | 0,97 | 17,80 | 1,5068 | 0,4632 | |||
| ARW / Arrow Electronics, Inc. | 0,01 | 0,00 | 0,97 | 13,57 | 1,5037 | 0,4235 | |||
| CHKP / Check Point Software Technologies Ltd. | 0,01 | 0,00 | 0,95 | 1,28 | 1,4697 | 0,2858 | |||
| DAL / Delta Air Lines, Inc. | 0,02 | 0,00 | 0,94 | 1,51 | 1,4542 | 0,2855 | |||
| ORCL / Oracle Corporation | 0,02 | -7,08 | 0,94 | -10,60 | 1,4495 | 0,1267 | |||
| TOL / Toll Brothers, Inc. | 0,02 | -26,83 | 0,93 | -29,58 | 1,4449 | -0,2292 | |||
| MAN / ManpowerGroup Inc. | 0,01 | 0,00 | 0,93 | 15,32 | 1,4341 | 0,4195 | |||
| MKSI / MKS Inc. | 0,01 | -5,64 | 0,92 | 12,47 | 1,4248 | 0,3913 | |||
| MS / Morgan Stanley | 0,02 | -42,06 | 0,92 | -30,61 | 1,4217 | -0,2499 | |||
| HUN / Huntsman Corporation | 0,04 | -31,43 | 0,90 | -28,80 | 1,3938 | -0,2032 | |||
| STLD / Steel Dynamics, Inc. | 0,03 | -26,02 | 0,89 | -15,52 | 1,3737 | 0,0470 | |||
| AMP / Ameriprise Financial, Inc. | 0,01 | 0,00 | 0,88 | 13,24 | 1,3644 | 0,3814 | |||
| AL / Air Lease Corporation | 0,02 | -22,49 | 0,87 | -11,90 | 1,3411 | 0,0992 | |||
| LRCX / Lam Research Corporation | 0,00 | -39,07 | 0,84 | -22,90 | 1,3086 | -0,0761 | |||
| LEA / Lear Corporation | 0,01 | -22,27 | 0,83 | -9,54 | 1,2916 | 0,1267 | |||
| SYNH / Syneos Health Inc - Class A | 0,01 | 0,00 | 0,83 | 11,83 | 1,2885 | 0,3485 | |||
| ALSN / Allison Transmission Holdings, Inc. | 0,02 | -43,08 | 0,83 | -41,57 | 1,2885 | -0,5107 | |||
| COF / Capital One Financial Corporation | 0,01 | -41,56 | 0,82 | -33,89 | 1,2776 | -0,2991 | |||
| XRAY / DENTSPLY SIRONA Inc. | 0,01 | 0,00 | 0,81 | 6,15 | 1,2560 | 0,2907 | |||
| ACM / AECOM | 0,02 | -5,06 | 0,81 | 9,03 | 1,2529 | 0,3154 | |||
| ASGN / ASGN Incorporated | 0,01 | -23,32 | 0,79 | -13,45 | 1,2157 | 0,0697 | |||
| GHC / Graham Holdings Company | 0,00 | 0,00 | 0,77 | -3,75 | 1,1940 | 0,1820 | |||
| COTY / Coty Inc. | 0,07 | 0,00 | 0,77 | 6,97 | 1,1878 | 0,2819 | |||
| US5249011058 / Legg Mason, Inc. | 0,02 | -34,57 | 0,76 | -38,44 | 1,1832 | -0,3848 | |||
| US54142L1098 / LogMein, Inc. | 0,01 | -31,98 | 0,75 | -17,80 | 1,1584 | 0,0087 | |||
| BKU / BankUnited, Inc. | 0,02 | 0,00 | 0,72 | 8,73 | 1,1181 | 0,2792 | |||
| NCR / NCR Corp. | 0,02 | -37,83 | 0,72 | -30,75 | 1,1088 | -0,1976 | |||
| THO / THOR Industries, Inc. | 0,01 | 0,00 | 0,71 | 31,18 | 1,1011 | 0,4163 | |||
| IVZ / Invesco Ltd. | 0,04 | -41,76 | 0,70 | -38,14 | 1,0825 | -0,3452 | |||
| PAG / Penske Automotive Group, Inc. | 0,01 | -47,45 | 0,70 | -44,19 | 1,0779 | -0,4977 | |||
| WDC / Western Digital Corporation | 0,01 | 0,00 | 0,68 | 6,41 | 1,0546 | 0,2460 | |||
| JAZZ / Jazz Pharmaceuticals plc | 0,00 | 0,00 | 0,66 | 16,43 | 1,0206 | 0,3055 | |||
| PRGO / Perrigo Company plc | 0,01 | 0,00 | 0,66 | -7,57 | 1,0206 | 0,1197 | |||
| FFIV / F5, Inc. | 0,00 | -35,91 | 0,66 | -36,28 | 1,0144 | -0,2845 | |||
| ANAT / American National Group, Inc. | 0,01 | 0,00 | 0,65 | -4,86 | 1,0004 | 0,1425 | |||
| BMY / Bristol-Myers Squibb Company | 0,01 | 0,00 | 0,64 | 26,49 | 0,9834 | 0,9834 | |||
| BHC / Bausch Health Companies Inc. | 0,02 | 0,00 | 0,63 | 36,90 | 0,9710 | 0,3923 | |||
| F / Ford Motor Company | 0,07 | -5,26 | 0,62 | -3,71 | 0,9648 | 0,1474 | |||
| PRU / Prudential Financial, Inc. | 0,01 | 0,00 | 0,60 | 4,33 | 0,9323 | 0,2033 | |||
| CI / The Cigna Group | 0,00 | 0,00 | 0,57 | 34,83 | 0,8812 | 0,3480 | |||
| YELP / Yelp Inc. | 0,02 | 0,00 | 0,56 | 0,18 | 0,8719 | 0,1618 | |||
| PVH / PVH Corp. | 0,01 | 0,00 | 0,53 | 19,33 | 0,8223 | 0,2601 | |||
| GM / General Motors Company | 0,01 | 0,00 | 0,52 | -2,43 | 0,8069 | 0,1322 | |||
| MFC / HEXAOM | 0,02 | 0,00 | 0,48 | 10,50 | 0,7496 | 0,7496 | |||
| TAP / Molson Coors Beverage Company | 0,01 | 0,00 | 0,47 | -6,35 | 0,7310 | 0,0942 | |||
| ST / Sensata Technologies Holding plc | 0,01 | 0,00 | 0,47 | 7,60 | 0,7232 | 0,1749 | |||
| CMA / Comerica Incorporated | 0,01 | 0,00 | 0,46 | 8,73 | 0,7139 | 0,7139 | |||
| NCLH / Norwegian Cruise Line Holdings Ltd. | 0,01 | 0,00 | 0,46 | 12,81 | 0,7093 | 0,7093 | |||
| FLEX / Flex Ltd. | 0,04 | 0,00 | 0,45 | 20,53 | 0,7000 | 0,2262 | |||
| OC / Owens Corning | 0,01 | 0,00 | 0,45 | 2,99 | 0,6938 | 0,1442 | |||
| MOS / The Mosaic Company | 0,02 | 0,00 | 0,44 | 5,56 | 0,6768 | 0,1537 | |||
| HSIC / Henry Schein, Inc. | 0,01 | 0,00 | 0,43 | 4,90 | 0,6628 | 0,6628 | |||
| AIG / American International Group, Inc. | 0,01 | 0,00 | 0,41 | -7,87 | 0,6350 | 0,0727 | |||
| WLK / Westlake Corporation | 0,01 | -29,09 | 0,40 | -24,10 | 0,6195 | -0,0464 | |||
| R / Ryder System, Inc. | 0,01 | -30,00 | 0,40 | -26,53 | 0,6133 | -0,0677 | |||
| SNX / TD SYNNEX Corporation | 0,00 | 0,00 | 0,39 | 13,91 | 0,6086 | 0,1727 | |||
| BWA / BorgWarner Inc. | 0,01 | 0,00 | 0,38 | 18,24 | 0,5823 | 0,1805 | |||
| IMO / Imperial Oil Limited | 0,01 | 0,00 | 0,37 | 1,66 | 0,5684 | 0,5684 | |||
| THS / TreeHouse Foods, Inc. | 0,01 | -65,19 | 0,36 | -69,59 | 0,5591 | -0,9407 | |||
| SNA / Snap-on Incorporated | 0,00 | 0,00 | 0,35 | 8,36 | 0,5420 | 0,1339 | |||
| IBM / International Business Machines Corporation | 0,00 | -52,20 | 0,34 | -55,99 | 0,5234 | -0,4469 | |||
| REGN / Regeneron Pharmaceuticals, Inc. | 0,00 | -50,59 | 0,28 | -33,10 | 0,4383 | -0,0962 | |||
| XEC / Cimarex Energy Co. | 0,00 | -48,19 | 0,23 | -43,22 | 0,3500 | 0,3500 | |||
| SATS / EchoStar Corporation | 0,01 | 0,22 | 0,3361 | 0,3361 | |||||
| DGP / DB Gold Double Long ETN | 0,02 | -59,25 | 0,19 | -57,64 | 0,3004 | -0,2782 | |||
| PCG / PG&E Corporation | 0,00 | -100,00 | 0,00 | -100,00 | -0,3247 | ||||
| APA / APA Corporation | 0,00 | -100,00 | 0,00 | -100,00 | -0,5142 | ||||
| ECA / EnCana Corp. | 0,00 | -100,00 | 0,00 | 0,0000 | |||||
| L / Loews Corporation | 0,00 | -100,00 | 0,00 | -100,00 | -0,4258 | ||||
| KMPR / Kemper Corporation | 0,00 | -100,00 | 0,00 | -100,00 | -0,4397 | ||||
| CDK / CDK Global Inc | 0,00 | -100,00 | 0,00 | -100,00 | -1,3961 | ||||
| ADS / Bread Financial Holdings Inc | 0,00 | -100,00 | 0,00 | -100,00 | -0,5420 | ||||
| ADM / Archer-Daniels-Midland Company | 0,00 | -100,00 | 0,00 | -100,00 | -0,7783 | ||||
| UTHR / United Therapeutics Corporation | 0,00 | -100,00 | 0,00 | -100,00 | -0,5218 | ||||
| 19041P105 / CBS Corp. | 0,00 | -100,00 | 0,00 | -100,00 | -0,6608 | ||||
| SJRWF / Shaw Communications Inc. - Class A | 0,00 | -100,00 | 0,00 | 0,0000 | |||||
| AMCX / AMC Networks Inc. | 0,00 | -100,00 | 0,00 | -100,00 | -0,5155 | ||||
| SABR / Sabre Corporation | 0,00 | -100,00 | 0,00 | -100,00 | -0,9463 | ||||
| GS / The Goldman Sachs Group, Inc. | 0,00 | -100,00 | 0,00 | -100,00 | -0,8642 | ||||
| MD / Pediatrix Medical Group, Inc. | 0,00 | -100,00 | 0,00 | -100,00 | -0,4751 | ||||
| ALL / The Allstate Corporation | 0,00 | -100,00 | 0,00 | -100,00 | -0,2742 | ||||
| VIAB / Viacom, Inc. | 0,00 | -100,00 | 0,00 | -100,00 | -1,2913 | ||||
| OLN / Olin Corporation | 0,00 | -100,00 | 0,00 | -100,00 | -0,2956 | ||||
| EQT / EQT Corporation | 0,00 | -100,00 | 0,00 | -100,00 | -0,5142 | ||||
| M / Macy's, Inc. | 0,00 | -100,00 | 0,00 | -100,00 | -0,4296 |