Statistiques de base
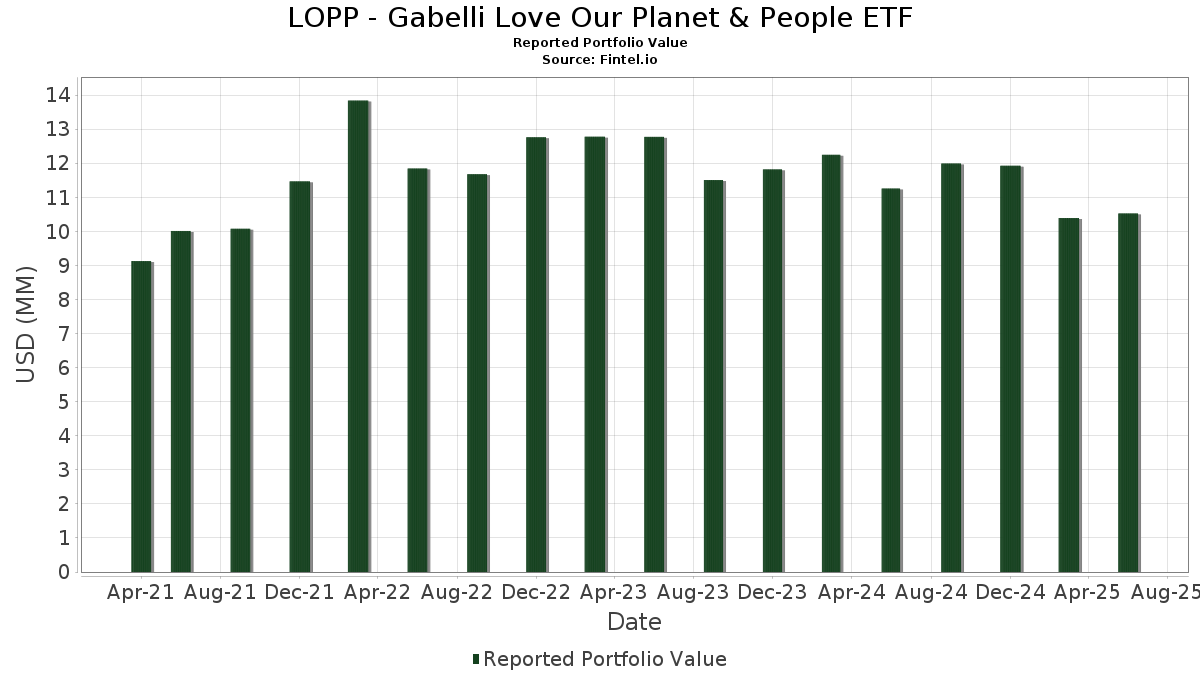
| Valeur du portefeuille | $ 10 523 935 |
| Positions actuelles | 51 |
Dernières positions, performances, ASG (à partir des dépôts 13F, 13D)
LOPP - Gabelli Love Our Planet & People ETF a déclaré un total de 51 positions dans ses derniers dépôts auprès de la SEC. La valeur la plus récente du portefeuille est calculée à 10 523 935 USD. Les actifs sous gestion réels (ASG) sont cette valeur plus les liquidités (qui ne sont pas divulguées). Les principales positions de LOPP - Gabelli Love Our Planet & People ETF sont Mirion Technologies, Inc. (US:MIR) , Republic Services, Inc. (US:RSG) , Xylem Inc. (US:XYL) , Hubbell Incorporated (US:HUBB) , and Waste Connections, Inc. (US:WCN) . Les nouvelles positions de LOPP - Gabelli Love Our Planet & People ETF incluent Veralto Corporation (US:VLTO) , .
Meilleures augmentations ce trimestre
Nous utilisons la variation de l'allocation du portefeuille car il s'agit de l'indicateur le plus significatif. Les changements peuvent être dus à des transactions ou à des variations de prix des actions.
| Titre | Actions (en millions) |
Valeur ($ en millions) |
% du portefeuille | ΔPortefeuille % |
|---|---|---|---|---|
| 0,19 | 1,7853 | 1,7853 | ||
| 0,15 | 1,4576 | 1,4576 | ||
| 0,00 | 0,32 | 2,9943 | 1,4236 | |
| 0,03 | 0,56 | 5,3261 | 1,3144 | |
| 0,00 | 0,38 | 3,6161 | 1,2861 | |
| 0,10 | 0,9488 | 0,9488 | ||
| 0,00 | 0,11 | 1,0330 | 0,5307 | |
| 0,00 | 0,05 | 0,4791 | 0,4791 | |
| 0,00 | 0,33 | 3,0977 | 0,4731 | |
| 0,00 | 0,44 | 4,1671 | 0,3944 |
Principales baisses ce trimestre
Nous utilisons la variation de l'allocation du portefeuille car il s'agit de l'indicateur le plus significatif. Les changements peuvent être dus à des transactions ou à des variations de prix des actions.
| Titre | Actions (en millions) |
Valeur ($ en millions) |
% du portefeuille | ΔPortefeuille % |
|---|---|---|---|---|
| 0,00 | 0,42 | 3,9769 | -1,2280 | |
| 0,01 | 0,07 | 0,6295 | -0,6648 | |
| 0,01 | 0,25 | 2,4110 | -0,6618 | |
| 0,00 | 0,26 | 2,5020 | -0,4690 | |
| 0,00 | 0,47 | 4,4917 | -0,4408 | |
| 0,00 | 0,09 | 0,8529 | -0,4095 | |
| 0,00 | 0,20 | 1,9198 | -0,3646 | |
| 0,00 | 0,31 | 2,8983 | -0,3626 | |
| 0,00 | 0,07 | 0,6729 | -0,3304 | |
| 0,00 | 0,20 | 1,9275 | -0,3234 |
Déclarations 13F et dépôts de fonds
Ce formulaire a été déposé le 2025-08-29 pour la période de déclaration 2025-06-30. Cliquez sur l'icône du lien pour voir l'historique complet des transactions.
Mettre à niveau pour débloquer les données premium et exporter vers Excel ![]() .
.
| Titre | Type | Prix moyen de l'action | Actions (en millions) |
ΔActions (%) |
ΔActions (%) |
Valeur ($ en millions) |
Portefeuille (%) |
ΔPortefeuille (%) |
|
|---|---|---|---|---|---|---|---|---|---|
| MIR / Mirion Technologies, Inc. | 0,03 | -10,12 | 0,56 | 33,57 | 5,3261 | 1,3144 | |||
| RSG / Republic Services, Inc. | 0,00 | -10,12 | 0,47 | -8,51 | 4,4917 | -0,4408 | |||
| XYL / Xylem Inc. | 0,00 | -10,13 | 0,46 | -2,55 | 4,3587 | -0,1431 | |||
| HUBB / Hubbell Incorporated | 0,00 | -10,04 | 0,44 | 11,14 | 4,1671 | 0,3944 | |||
| WCN / Waste Connections, Inc. | 0,00 | -19,71 | 0,42 | -23,30 | 3,9769 | -1,2280 | |||
| GEV / GE Vernova Inc. | 0,00 | -10,00 | 0,38 | 55,74 | 3,6161 | 1,2861 | |||
| SPGI / S&P Global Inc. | 0,00 | -10,00 | 0,38 | -6,65 | 3,6034 | -0,2746 | |||
| CCK / Crown Holdings, Inc. | 0,00 | -3,60 | 0,35 | 11,22 | 3,2978 | 0,3173 | |||
| CMI / Cummins Inc. | 0,00 | -10,34 | 0,34 | -6,34 | 3,2328 | -0,2361 | |||
| TYIA / Johnson Controls International plc | 0,00 | -10,02 | 0,33 | 18,55 | 3,0977 | 0,4731 | |||
| ACA / Arcosa, Inc. | 0,00 | -10,15 | 0,32 | 0,95 | 3,0319 | 0,0153 | |||
| CCJ / Cameco Corporation | 0,00 | 6,25 | 0,32 | 92,07 | 2,9943 | 1,4236 | |||
| IDA / IDACORP, Inc. | 0,00 | -10,06 | 0,31 | -10,56 | 2,8983 | -0,3626 | |||
| VMI / Valmont Industries, Inc. | 0,00 | -10,09 | 0,30 | 2,72 | 2,8733 | 0,0664 | |||
| AZZ / AZZ Inc. | 0,00 | -10,24 | 0,28 | 1,43 | 2,7037 | 0,0243 | |||
| AWK / American Water Works Company, Inc. | 0,00 | -10,23 | 0,26 | -15,43 | 2,5020 | -0,4690 | |||
| DE / Deere & Company | 0,00 | -9,84 | 0,26 | -2,62 | 2,4759 | -0,0720 | |||
| WY / Weyerhaeuser Company | 0,01 | -10,11 | 0,25 | -21,12 | 2,4110 | -0,6618 | |||
| REZI / Resideo Technologies, Inc. | 0,01 | -5,83 | 0,22 | 17,84 | 2,0703 | 0,2973 | |||
| ROCK / Gibraltar Industries, Inc. | 0,00 | -10,14 | 0,22 | -9,58 | 2,0652 | -0,2315 | |||
| CNH / CNH Industrial N.V. | 0,02 | -10,14 | 0,21 | -5,02 | 1,9798 | -0,1186 | |||
| APD / Air Products and Chemicals, Inc. | 0,00 | -10,00 | 0,20 | -13,62 | 1,9275 | -0,3234 | |||
| LNT / Alliant Energy Corporation | 0,00 | -10,10 | 0,20 | -15,48 | 1,9198 | -0,3646 | |||
| BLBD / Blue Bird Corporation | 0,00 | -10,08 | 0,19 | 20,50 | 1,8418 | 0,2977 | |||
| MATW / Matthews International Corporation | 0,01 | -10,13 | 0,19 | -3,50 | 1,8355 | -0,0741 | |||
| BBVA / Banco Bilbao Vizcaya Argentaria, S.A. - Depositary Receipt (Common Stock) | 0,01 | -10,15 | 0,19 | 1,59 | 1,8279 | 0,0157 | |||
| United States Treasury Bill / DBT (US912797PY71) | 0,19 | 1,7853 | 1,7853 | ||||||
| FCX / Freeport-McMoRan Inc. | 0,00 | -10,21 | 0,17 | 2,37 | 1,6499 | 0,0368 | |||
| FLS / Flowserve Corporation | 0,00 | -10,02 | 0,17 | -3,91 | 1,6412 | -0,0694 | |||
| TKR / The Timken Company | 0,00 | -10,00 | 0,17 | -8,99 | 1,6368 | -0,1741 | |||
| BEPC / Brookfield Renewable Corporation | 0,01 | -10,07 | 0,17 | 5,59 | 1,6228 | 0,0779 | |||
| United States Treasury Bill / DBT (US912797PX98) | 0,15 | 1,4576 | 1,4576 | ||||||
| GOOG / Alphabet Inc. | 0,00 | -10,39 | 0,12 | 1,67 | 1,1617 | 0,0140 | |||
| MWA / Mueller Water Products, Inc. | 0,00 | -10,18 | 0,12 | -15,11 | 1,1272 | -0,2067 | |||
| GRC / The Gorman-Rupp Company | 0,00 | 97,60 | 0,11 | 107,69 | 1,0330 | 0,5307 | |||
| United States Treasury Bill / DBT (US912797NX17) | 0,10 | 0,9488 | 0,9488 | ||||||
| ING / ING Groep N.V. - Depositary Receipt (Common Stock) | 0,00 | -10,18 | 0,10 | 0,00 | 0,9374 | -0,0023 | |||
| FLEX / Flex Ltd. | 0,00 | -55,00 | 0,09 | -32,58 | 0,8529 | -0,4095 | |||
| UL / Unilever PLC - Depositary Receipt (Common Stock) | 0,00 | -10,36 | 0,09 | -8,33 | 0,8442 | -0,0773 | |||
| NXT / Nextracker Inc. | 0,00 | -10,25 | 0,08 | 15,28 | 0,7952 | 0,1049 | |||
| CARR / Carrier Global Corporation | 0,00 | -10,45 | 0,08 | 4,17 | 0,7141 | 0,0197 | |||
| GLW / Corning Incorporated | 0,00 | -41,31 | 0,07 | -33,33 | 0,6729 | -0,3304 | |||
| XIFR / XPLR Infrastructure, LP - Limited Partnership | 0,01 | -43,36 | 0,07 | -51,11 | 0,6295 | -0,6648 | |||
| AMBP / Ardagh Metal Packaging SA | 0,01 | -38,86 | 0,06 | -13,64 | 0,5476 | -0,0876 | |||
| FSTR / L.B. Foster Company | 0,00 | -10,16 | 0,05 | 0,00 | 0,5137 | -0,0035 | |||
| RPRX / Royalty Pharma plc | 0,00 | -20,04 | 0,05 | -8,93 | 0,4924 | -0,0424 | |||
| PLPC / Preformed Line Products Company | 0,00 | -11,17 | 0,05 | 0,00 | 0,4823 | 0,0039 | |||
| VLTO / Veralto Corporation | 0,00 | 0,05 | 0,4791 | 0,4791 | |||||
| CTRI / Centuri Holdings, Inc. | 0,00 | -10,24 | 0,05 | 25,00 | 0,4779 | 0,0870 | |||
| VRTX / Vertex Pharmaceuticals Incorporated | 0,00 | -12,80 | 0,05 | -20,00 | 0,4606 | -0,1176 | |||
| PACK / Ranpak Holdings Corp. | 0,01 | 6,18 | 0,04 | -30,51 | 0,3958 | -0,1730 |