Statistiques de base
| Valeur du portefeuille | $ 472 768 679 |
| Positions actuelles | 99 |
Dernières positions, performances, ASG (à partir des dépôts 13F, 13D)
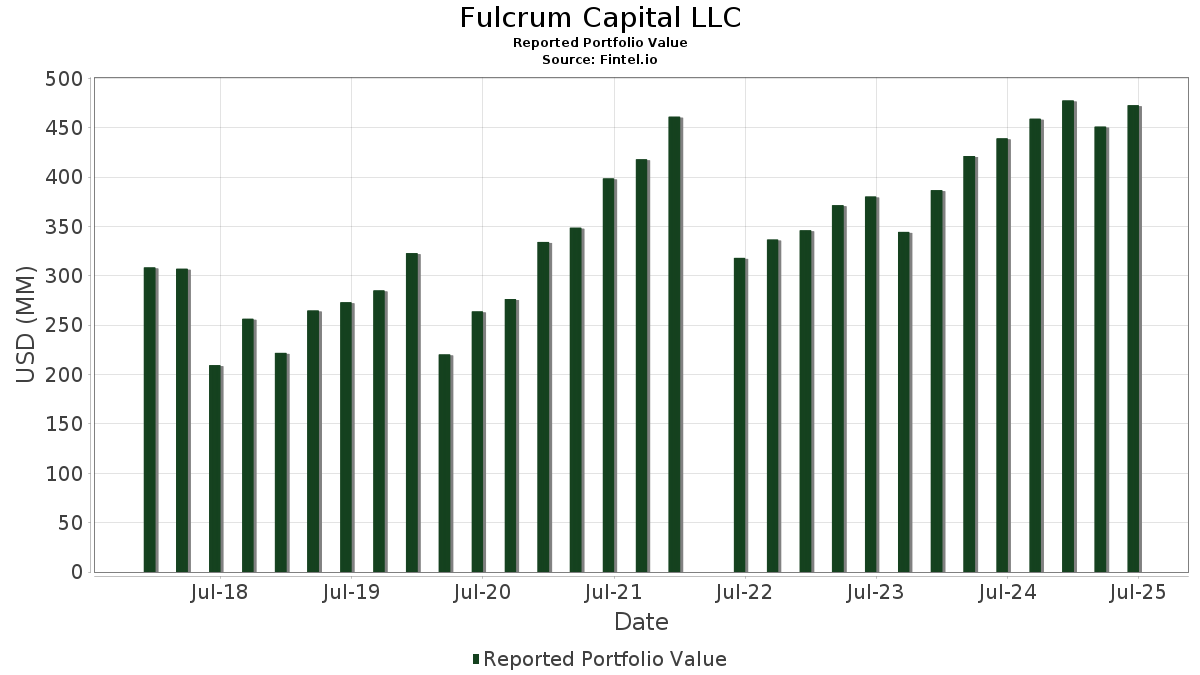
Fulcrum Capital LLC a déclaré un total de 99 positions dans ses derniers dépôts auprès de la SEC. La valeur la plus récente du portefeuille est calculée à 472 768 679 USD. Les actifs sous gestion réels (ASG) sont cette valeur plus les liquidités (qui ne sont pas divulguées). Les principales positions de Fulcrum Capital LLC sont Microsoft Corporation (US:MSFT) , Vanguard Index Funds - Vanguard Mid-Cap ETF (US:VO) , Amazon.com, Inc. (US:AMZN) , NVIDIA Corporation (US:NVDA) , and Apple Inc. (US:AAPL) . Les nouvelles positions de Fulcrum Capital LLC incluent Uber Technologies, Inc. (US:UBER) , Mondelez International, Inc. (US:MDLZ) , .
Meilleures augmentations ce trimestre
Nous utilisons la variation de l'allocation du portefeuille car il s'agit de l'indicateur le plus significatif. Les changements peuvent être dus à des transactions ou à des variations de prix des actions.
| Titre | Actions (en millions) |
Valeur ($ en millions) |
% du portefeuille | ΔPortefeuille % |
|---|---|---|---|---|
| 0,11 | 18,76 | 3,9688 | 3,9688 | |
| 0,08 | 39,10 | 8,2694 | 1,7196 | |
| 0,07 | 6,37 | 1,3480 | 1,3480 | |
| 0,01 | 15,33 | 3,2418 | 0,8905 | |
| 0,04 | 18,16 | 3,8411 | 0,7006 | |
| 0,03 | 13,42 | 2,8389 | 0,6468 | |
| 0,14 | 22,34 | 4,7255 | 0,5251 | |
| 0,10 | 22,91 | 4,8449 | 0,5164 | |
| 0,08 | 7,59 | 1,6057 | 0,4117 | |
| 0,01 | 9,76 | 2,0637 | 0,4042 |
Principales baisses ce trimestre
Nous utilisons la variation de l'allocation du portefeuille car il s'agit de l'indicateur le plus significatif. Les changements peuvent être dus à des transactions ou à des variations de prix des actions.
| Titre | Actions (en millions) |
Valeur ($ en millions) |
% du portefeuille | ΔPortefeuille % |
|---|---|---|---|---|
| 0,01 | 1,64 | 0,3474 | -3,5310 | |
| 0,11 | 21,59 | 4,5670 | -2,7954 | |
| 0,13 | 37,76 | 7,9865 | -2,3565 | |
| 0,03 | 7,87 | 1,6642 | -1,1239 | |
| 0,01 | 4,83 | 1,0208 | -0,3064 | |
| 0,00 | 0,00 | -0,3030 | ||
| 0,05 | 6,57 | 1,3887 | -0,2909 | |
| 0,02 | 7,03 | 1,4877 | -0,1866 | |
| 0,05 | 10,91 | 2,3079 | -0,1437 | |
| 0,05 | 5,48 | 1,1582 | -0,1182 |
Déclarations 13F et dépôts de fonds
Ce formulaire a été déposé le 2025-07-24 pour la période de déclaration 2025-06-30. Cliquez sur l'icône du lien pour voir l'historique complet des transactions.
Mettre à niveau pour débloquer les données premium et exporter vers Excel ![]() .
.
| Titre | Type | Prix moyen de l'action | Actions (en millions) |
ΔActions (%) |
ΔActions (%) |
Valeur ($ en millions) |
Portefeuille (%) |
ΔPortefeuille (%) |
|
|---|---|---|---|---|---|---|---|---|---|
| MSFT / Microsoft Corporation | 0,08 | -0,14 | 39,10 | 32,32 | 8,2694 | 1,7196 | |||
| VO / Vanguard Index Funds - Vanguard Mid-Cap ETF | 0,13 | -25,21 | 37,76 | -19,07 | 7,9865 | -2,3565 | |||
| AMZN / Amazon.com, Inc. | 0,10 | 1,74 | 22,91 | 17,31 | 4,8449 | 0,5164 | |||
| NVDA / NVIDIA Corporation | 0,14 | -19,11 | 22,34 | 17,91 | 4,7255 | 0,5251 | |||
| AAPL / Apple Inc. | 0,11 | -29,61 | 21,59 | -34,99 | 4,5670 | -2,7954 | |||
| GOOGL / Alphabet Inc. | 0,11 | 18,76 | 3,9688 | 3,9688 | |||||
| TT / Trane Technologies plc | 0,04 | -1,26 | 18,16 | 28,19 | 3,8411 | 0,7006 | |||
| NFLX / Netflix, Inc. | 0,01 | 0,62 | 15,33 | 44,50 | 3,2418 | 0,8905 | |||
| MA / Mastercard Incorporated | 0,03 | -0,41 | 15,10 | 2,10 | 3,1931 | -0,0846 | |||
| FTNT / Fortinet, Inc. | 0,13 | 3,38 | 14,04 | 13,55 | 2,9706 | 0,2286 | |||
| JPM / JPMorgan Chase & Co. | 0,05 | -3,51 | 13,58 | 14,05 | 2,8734 | 0,2327 | |||
| ADBE / Adobe Inc. | 0,03 | 34,56 | 13,42 | 35,73 | 2,8389 | 0,6468 | |||
| CME / CME Group Inc. | 0,04 | -2,22 | 11,69 | 1,59 | 2,4735 | -0,0785 | |||
| SPGI / S&P Global Inc. | 0,02 | 0,16 | 11,06 | 3,95 | 2,3398 | -0,0195 | |||
| WM / Waste Management, Inc. | 0,05 | -0,17 | 10,91 | -1,33 | 2,3079 | -0,1437 | |||
| EW / Edwards Lifesciences Corporation | 0,13 | 3,83 | 10,25 | 12,05 | 2,1689 | 0,1401 | |||
| INTU / Intuit Inc. | 0,01 | 1,60 | 9,76 | 30,34 | 2,0637 | 0,4042 | |||
| ZTS / Zoetis Inc. | 0,06 | 7,32 | 8,79 | 1,65 | 1,8602 | -0,0578 | |||
| ULTA / Ulta Beauty, Inc. | 0,02 | 0,89 | 8,60 | 28,77 | 1,8188 | 0,3385 | |||
| UNH / UnitedHealth Group Incorporated | 0,03 | 5,02 | 7,87 | -37,44 | 1,6642 | -1,1239 | |||
| XYL / Xylem Inc. | 0,06 | 1,89 | 7,63 | 10,34 | 1,6143 | 0,0808 | |||
| LRCX / Lam Research Corporation | 0,08 | 5,26 | 7,59 | 40,94 | 1,6057 | 0,4117 | |||
| EA / Electronic Arts Inc. | 0,05 | 0,63 | 7,35 | 11,21 | 1,5553 | 0,0893 | |||
| VRTX / Vertex Pharmaceuticals Incorporated | 0,02 | 1,41 | 7,03 | -6,87 | 1,4877 | -0,1866 | |||
| LIN / Linde plc | 0,01 | 1,18 | 6,76 | 1,94 | 1,4308 | -0,0401 | |||
| PEP / PepsiCo, Inc. | 0,05 | -1,60 | 6,57 | -13,34 | 1,3887 | -0,2909 | |||
| FSLR / First Solar, Inc. | 0,04 | 8,84 | 6,54 | 42,52 | 1,3840 | 0,3661 | |||
| UBER / Uber Technologies, Inc. | 0,07 | 6,37 | 1,3480 | 1,3480 | |||||
| ABT / Abbott Laboratories | 0,05 | 1,95 | 6,34 | 4,53 | 1,3417 | -0,0036 | |||
| DHI / D.R. Horton, Inc. | 0,05 | 4,12 | 5,89 | 5,57 | 1,2463 | 0,0092 | |||
| EOG / EOG Resources, Inc. | 0,05 | 1,97 | 5,48 | -4,90 | 1,1582 | -0,1182 | |||
| VUG / Vanguard Index Funds - Vanguard Growth ETF | 0,01 | 9,41 | 5,10 | 29,34 | 1,0780 | 0,2045 | |||
| JQUA / J.P. Morgan Exchange-Traded Fund Trust - JPMorgan U.S. Quality Factor ETF | 0,08 | 9,80 | 4,86 | 16,74 | 1,0281 | 0,1052 | |||
| IVV / iShares Trust - iShares Core S&P 500 ETF | 0,01 | -27,05 | 4,83 | -19,39 | 1,0208 | -0,3064 | |||
| XBI / SPDR Series Trust - SPDR S&P Biotech ETF | 0,05 | 6,02 | 4,56 | 8,40 | 0,9641 | 0,0321 | |||
| PYPL / PayPal Holdings, Inc. | 0,05 | 0,93 | 3,93 | 14,95 | 0,8310 | 0,0734 | |||
| DXCM / DexCom, Inc. | 0,04 | 11,18 | 3,31 | 42,13 | 0,6994 | 0,1836 | |||
| AMGN / Amgen Inc. | 0,01 | -0,96 | 2,80 | -11,24 | 0,5928 | -0,1072 | |||
| ALGN / Align Technology, Inc. | 0,01 | 18,14 | 2,08 | 40,84 | 0,4392 | 0,1123 | |||
| CVLC / Morgan Stanley ETF Trust - Calvert US Large-Cap Core Responsible Index ETF | 0,02 | 9,95 | 1,90 | 22,07 | 0,4014 | 0,0568 | |||
| SPLG / SPDR Series Trust - SPDR Portfolio S&P 500 ETF | 0,03 | 0,00 | 1,84 | 10,50 | 0,3896 | 0,0202 | |||
| IWR / iShares Trust - iShares Russell Mid-Cap ETF | 0,02 | -13,20 | 1,70 | -6,18 | 0,3597 | -0,0420 | |||
| ECL / Ecolab Inc. | 0,01 | -3,43 | 1,68 | 2,68 | 0,3562 | -0,0075 | |||
| V / Visa Inc. | 0,00 | -2,19 | 1,65 | -0,90 | 0,3494 | -0,0201 | |||
| GOOG / Alphabet Inc. | 0,01 | -91,81 | 1,64 | -90,61 | 0,3474 | -3,5310 | |||
| BRK.B / Berkshire Hathaway Inc. | 0,00 | 0,63 | 1,47 | -8,24 | 0,3111 | -0,0441 | |||
| VAIGX / Vanguard Advice Select International Growth Fund | 0,01 | 0,00 | 1,44 | 3,39 | 0,3035 | -0,0042 | |||
| COST / Costco Wholesale Corporation | 0,00 | -7,38 | 1,39 | -3,07 | 0,2944 | -0,0239 | |||
| XLV / The Select Sector SPDR Trust - The Health Care Select Sector SPDR Fund | 0,01 | 0,00 | 1,17 | -7,72 | 0,2480 | -0,0336 | |||
| AWK / American Water Works Company, Inc. | 0,01 | 44,49 | 0,94 | 36,27 | 0,1996 | 0,0461 | |||
| IEFA / iShares Trust - iShares Core MSCI EAFE ETF | 0,01 | 31,56 | 0,92 | 45,11 | 0,1947 | 0,0541 | |||
| WELL / Welltower Inc. | 0,01 | -9,65 | 0,83 | -9,32 | 0,1750 | -0,0273 | |||
| AVGO / Broadcom Inc. | 0,00 | -4,59 | 0,72 | 57,02 | 0,1516 | 0,0504 | |||
| JNJ / Johnson & Johnson | 0,00 | -8,19 | 0,70 | -15,50 | 0,1478 | -0,0354 | |||
| ATO / Atmos Energy Corporation | 0,00 | 0,00 | 0,63 | -0,32 | 0,1336 | -0,0069 | |||
| SCHD / Schwab Strategic Trust - Schwab U.S. Dividend Equity ETF | 0,02 | 0,00 | 0,61 | -5,16 | 0,1283 | -0,0136 | |||
| SPY / SPDR S&P 500 ETF | 0,00 | -2,82 | 0,57 | 7,29 | 0,1215 | 0,0029 | |||
| MAR / Marriott International, Inc. | 0,00 | 0,00 | 0,56 | 14,85 | 0,1179 | 0,0102 | |||
| KO / The Coca-Cola Company | 0,01 | 0,00 | 0,55 | -1,25 | 0,1173 | -0,0072 | |||
| SBUX / Starbucks Corporation | 0,01 | 0,00 | 0,55 | -6,61 | 0,1167 | -0,0142 | |||
| VDC / Vanguard World Fund - Vanguard Consumer Staples ETF | 0,00 | 0,00 | 0,53 | 0,00 | 0,1121 | -0,0053 | |||
| ESGD / iShares Trust - iShares ESG Aware MSCI EAFE ETF | 0,01 | -5,79 | 0,50 | 2,90 | 0,1053 | -0,0020 | |||
| PG / The Procter & Gamble Company | 0,00 | 0,00 | 0,50 | -6,58 | 0,1053 | -0,0127 | |||
| IEMG / iShares, Inc. - iShares Core MSCI Emerging Markets ETF | 0,01 | 24,13 | 0,48 | 38,11 | 0,1020 | 0,0246 | |||
| LAMR / Lamar Advertising Company | 0,00 | 0,00 | 0,48 | 6,65 | 0,1019 | 0,0018 | |||
| ABBV / AbbVie Inc. | 0,00 | 0,00 | 0,48 | -11,36 | 0,1007 | -0,0184 | |||
| SPG / Simon Property Group, Inc. | 0,00 | 3,26 | 0,43 | 0,00 | 0,0915 | -0,0044 | |||
| MS / Morgan Stanley | 0,00 | 0,00 | 0,43 | 20,73 | 0,0914 | 0,0121 | |||
| PEG / Public Service Enterprise Group Incorporated | 0,00 | 0,00 | 0,40 | 2,28 | 0,0856 | -0,0021 | |||
| TXN / Texas Instruments Incorporated | 0,00 | 14,31 | 0,40 | 32,34 | 0,0849 | 0,0175 | |||
| ORI / Old Republic International Corporation | 0,01 | 0,00 | 0,39 | -2,00 | 0,0832 | -0,0058 | |||
| VTI / Vanguard Index Funds - Vanguard Total Stock Market ETF | 0,00 | 0,00 | 0,39 | 10,73 | 0,0830 | 0,0043 | |||
| DRI / Darden Restaurants, Inc. | 0,00 | 0,00 | 0,39 | 4,85 | 0,0825 | 0,0001 | |||
| UL / Unilever PLC - Depositary Receipt (Common Stock) | 0,01 | 0,00 | 0,38 | 2,69 | 0,0810 | -0,0016 | |||
| EPD / Enterprise Products Partners L.P. - Limited Partnership | 0,01 | 0,00 | 0,36 | -9,27 | 0,0768 | -0,0118 | |||
| VPU / Vanguard World Fund - Vanguard Utilities ETF | 0,00 | 0,00 | 0,36 | 3,14 | 0,0765 | -0,0011 | |||
| QCOM / QUALCOMM Incorporated | 0,00 | 0,00 | 0,35 | 3,82 | 0,0748 | -0,0008 | |||
| PAYX / Paychex, Inc. | 0,00 | 0,00 | 0,35 | -5,61 | 0,0747 | -0,0083 | |||
| ARES / Ares Management Corporation | 0,00 | -7,32 | 0,35 | 9,32 | 0,0746 | 0,0032 | |||
| ALSN / Allison Transmission Holdings, Inc. | 0,00 | 0,00 | 0,34 | -0,87 | 0,0723 | -0,0040 | |||
| CMI / Cummins Inc. | 0,00 | 0,00 | 0,34 | 4,32 | 0,0716 | -0,0002 | |||
| IWB / iShares Trust - iShares Russell 1000 ETF | 0,00 | 0,00 | 0,32 | 10,58 | 0,0687 | 0,0037 | |||
| META / Meta Platforms, Inc. | 0,00 | -24,25 | 0,32 | -2,75 | 0,0673 | -0,0054 | |||
| HD / The Home Depot, Inc. | 0,00 | -3,53 | 0,31 | -3,73 | 0,0658 | -0,0057 | |||
| WSO / Watsco, Inc. | 0,00 | 0,00 | 0,30 | -13,20 | 0,0627 | -0,0129 | |||
| COP / ConocoPhillips | 0,00 | -10,02 | 0,28 | -23,27 | 0,0588 | -0,0213 | |||
| SNA / Snap-on Incorporated | 0,00 | 0,00 | 0,28 | -7,67 | 0,0588 | -0,0079 | |||
| KDP / Keurig Dr Pepper Inc. | 0,01 | 0,00 | 0,27 | -3,52 | 0,0582 | -0,0049 | |||
| PCAR / PACCAR Inc | 0,00 | 0,00 | 0,27 | -2,50 | 0,0578 | -0,0043 | |||
| WCC / WESCO International, Inc. | 0,00 | 0,00 | 0,26 | 19,46 | 0,0560 | 0,0068 | |||
| IWF / iShares Trust - iShares Russell 1000 Growth ETF | 0,00 | 0,00 | 0,25 | 17,67 | 0,0536 | 0,0058 | |||
| EXR / Extra Space Storage Inc. | 0,00 | 0,00 | 0,25 | -0,80 | 0,0528 | -0,0029 | |||
| OKE / ONEOK, Inc. | 0,00 | 0,00 | 0,24 | -17,85 | 0,0518 | -0,0142 | |||
| WTRG / Essential Utilities, Inc. | 0,01 | 0,00 | 0,23 | -6,07 | 0,0491 | -0,0057 | |||
| CSCO / Cisco Systems, Inc. | 0,00 | -6,16 | 0,22 | 5,71 | 0,0470 | 0,0003 | |||
| BDX / Becton, Dickinson and Company | 0,00 | 0,00 | 0,22 | -25,00 | 0,0465 | -0,0183 | |||
| MDLZ / Mondelez International, Inc. | 0,00 | 0,22 | 0,0457 | 0,0457 | |||||
| EFA / iShares Trust - iShares MSCI EAFE ETF | 0,00 | 0,21 | 0,0436 | 0,0436 | |||||
| MPW / Medical Properties Trust, Inc. | 0,03 | 0,00 | 0,13 | -28,33 | 0,0273 | -0,0128 | |||
| GS / The Goldman Sachs Group, Inc. | 0,00 | -100,00 | 0,00 | 0,0000 | |||||
| AES / The AES Corporation | 0,00 | -100,00 | 0,00 | 0,0000 | |||||
| LLY / Eli Lilly and Company | 0,00 | -100,00 | 0,00 | 0,0000 | |||||
| VZ / Verizon Communications Inc. | 0,00 | -100,00 | 0,00 | -100,00 | -0,3030 | ||||
| WSM / Williams-Sonoma, Inc. | 0,00 | -100,00 | 0,00 | 0,0000 | |||||
| XOM / Exxon Mobil Corporation | 0,00 | -100,00 | 0,00 | 0,0000 | |||||
| SYK / Stryker Corporation | 0,00 | -100,00 | 0,00 | 0,0000 | |||||
| DFAC / Dimensional ETF Trust - Dimensional U.S. Core Equity 2 ETF | 0,00 | -100,00 | 0,00 | 0,0000 | |||||
| CHD / Church & Dwight Co., Inc. | 0,00 | -100,00 | 0,00 | 0,0000 | |||||
| BCC / Boise Cascade Company | 0,00 | -100,00 | 0,00 | 0,0000 | |||||
| FANG / Diamondback Energy, Inc. | 0,00 | -100,00 | 0,00 | 0,0000 |