Statistiques de base
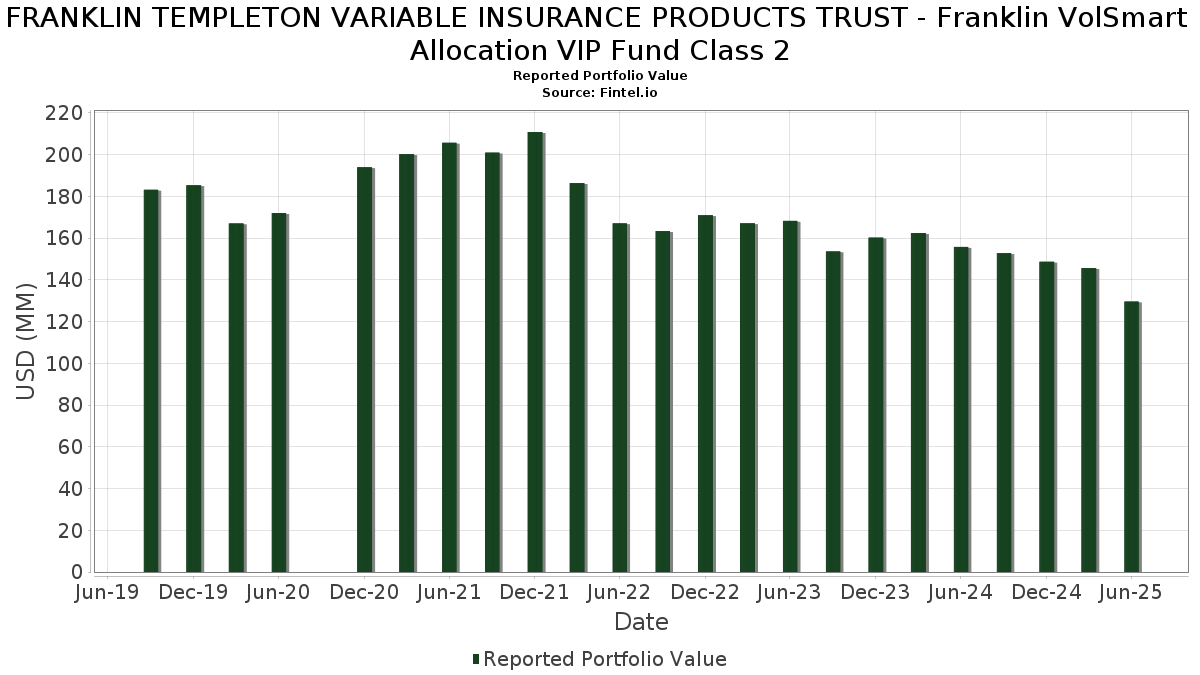
| Valeur du portefeuille | $ 129 565 651 |
| Positions actuelles | 253 |
Dernières positions, performances, ASG (à partir des dépôts 13F, 13D)
FRANKLIN TEMPLETON VARIABLE INSURANCE PRODUCTS TRUST - Franklin VolSmart Allocation VIP Fund Class 2 a déclaré un total de 253 positions dans ses derniers dépôts auprès de la SEC. La valeur la plus récente du portefeuille est calculée à 129 565 651 USD. Les actifs sous gestion réels (ASG) sont cette valeur plus les liquidités (qui ne sont pas divulguées). Les principales positions de FRANKLIN TEMPLETON VARIABLE INSURANCE PRODUCTS TRUST - Franklin VolSmart Allocation VIP Fund Class 2 sont Franklin Templeton ETF Trust - Franklin U.S. Core Bond ETF (US:FLCB) , Franklin Income VIP Fund CL 1 (US:US3551508894) , Microsoft Corporation (US:MSFT) , Apple Inc. (US:AAPL) , and NVIDIA Corporation (US:NVDA) . Les nouvelles positions de FRANKLIN TEMPLETON VARIABLE INSURANCE PRODUCTS TRUST - Franklin VolSmart Allocation VIP Fund Class 2 incluent Welltower Inc. (US:WELL) , DoorDash, Inc. (US:DASH) , Insulet Corporation (US:PODD) , Northern Trust Corporation (US:NTRS) , and Royalty Pharma plc (US:RPRX) .
Meilleures augmentations ce trimestre
Nous utilisons la variation de l'allocation du portefeuille car il s'agit de l'indicateur le plus significatif. Les changements peuvent être dus à des transactions ou à des variations de prix des actions.
| Titre | Actions (en millions) |
Valeur ($ en millions) |
% du portefeuille | ΔPortefeuille % |
|---|---|---|---|---|
| 0,01 | 6,44 | 4,8835 | 0,8236 | |
| 0,01 | 2,79 | 2,1138 | 0,8027 | |
| 0,02 | 3,40 | 2,5812 | 0,6763 | |
| 0,01 | 1,96 | 1,4840 | 0,5192 | |
| 1,08 | 23,34 | 17,6975 | 0,3294 | |
| 0,01 | 0,68 | 0,5192 | 0,3129 | |
| 0,00 | 0,99 | 0,7506 | 0,2812 | |
| 0,01 | 0,95 | 0,7229 | 0,2630 | |
| 0,00 | 1,55 | 1,1785 | 0,2593 | |
| 0,00 | 0,46 | 0,3514 | 0,2415 |
Principales baisses ce trimestre
Nous utilisons la variation de l'allocation du portefeuille car il s'agit de l'indicateur le plus significatif. Les changements peuvent être dus à des transactions ou à des variations de prix des actions.
| Titre | Actions (en millions) |
Valeur ($ en millions) |
% du portefeuille | ΔPortefeuille % |
|---|---|---|---|---|
| 1,48 | 1,48 | 1,1220 | -1,6389 | |
| 0,00 | 0,07 | 0,0542 | -1,0254 | |
| 0,68 | 10,20 | 7,7346 | -0,6386 | |
| -0,75 | -0,5712 | -0,5712 | ||
| 0,02 | 4,03 | 3,0550 | -0,3074 | |
| 0,00 | 0,23 | 0,1763 | -0,2747 | |
| 0,01 | 1,17 | 0,8874 | -0,2275 | |
| 0,00 | 0,57 | 0,4316 | -0,2160 | |
| 0,01 | 1,28 | 0,9707 | -0,1692 | |
| 0,00 | 0,15 | 0,1127 | -0,1304 |
Déclarations 13F et dépôts de fonds
Ce formulaire a été déposé le 2025-08-26 pour la période de déclaration 2025-06-30. Cliquez sur l'icône du lien pour voir l'historique complet des transactions.
Mettre à niveau pour débloquer les données premium et exporter vers Excel ![]() .
.
| Titre | Type | Prix moyen de l'action | Actions (en millions) |
ΔActions (%) |
ΔActions (%) |
Valeur ($ en millions) |
Portefeuille (%) |
ΔPortefeuille (%) |
|
|---|---|---|---|---|---|---|---|---|---|
| FLCB / Franklin Templeton ETF Trust - Franklin U.S. Core Bond ETF | 1,08 | 0,00 | 23,34 | 0,12 | 17,6975 | 0,3294 | |||
| Putnam Core Bond Fund, Class R6 / (US74676A4022) | 1,41 | 0,76 | 11,60 | 0,88 | 8,7926 | 0,2290 | |||
| US3551508894 / Franklin Income VIP Fund CL 1 | 0,68 | -6,15 | 10,20 | -9,23 | 7,7346 | -0,6386 | |||
| MSFT / Microsoft Corporation | 0,01 | -10,81 | 6,44 | 18,18 | 4,8835 | 0,8236 | |||
| AAPL / Apple Inc. | 0,02 | -3,35 | 4,03 | -10,72 | 3,0550 | -0,3074 | |||
| NVDA / NVIDIA Corporation | 0,02 | -8,67 | 3,40 | 33,12 | 2,5812 | 0,6763 | |||
| AVGO / Broadcom Inc. | 0,01 | -3,79 | 2,79 | 58,41 | 2,1138 | 0,8027 | |||
| ORCL / Oracle Corporation | 0,01 | -3,36 | 1,96 | 51,12 | 1,4840 | 0,5192 | |||
| WMT / Walmart Inc. | 0,02 | -8,89 | 1,74 | 1,46 | 1,3192 | 0,0419 | |||
| JPM / JPMorgan Chase & Co. | 0,01 | -6,77 | 1,70 | 10,20 | 1,2862 | 0,1393 | |||
| TXN / Texas Instruments Incorporated | 0,01 | -9,71 | 1,57 | 4,33 | 1,1867 | 0,0690 | |||
| META / Meta Platforms, Inc. | 0,00 | -1,63 | 1,55 | 26,03 | 1,1785 | 0,2593 | |||
| AMZN / Amazon.com, Inc. | 0,01 | -1,43 | 1,55 | 13,68 | 1,1725 | 0,1590 | |||
| V / Visa Inc. | 0,00 | 17,47 | 1,53 | 19,07 | 1,1602 | 0,2023 | |||
| INFXX / Institutional Fiduciary Trust - Institutional Fiduciary Trust Money Market Portfolio | 1,48 | -60,07 | 1,48 | -60,09 | 1,1220 | -1,6389 | |||
| SYK / Stryker Corporation | 0,00 | -11,68 | 1,42 | -6,09 | 1,0753 | -0,0502 | |||
| ABT / Abbott Laboratories | 0,01 | 7,29 | 1,32 | 10,08 | 1,0016 | 0,1070 | |||
| JNJ / Johnson & Johnson | 0,01 | -9,16 | 1,28 | -16,34 | 0,9707 | -0,1692 | |||
| ABBV / AbbVie Inc. | 0,01 | -11,73 | 1,17 | -21,79 | 0,8874 | -0,2275 | |||
| LIN / Linde plc | 0,00 | -7,63 | 1,02 | -6,92 | 0,7754 | -0,0431 | |||
| LLY / Eli Lilly and Company | 0,00 | 66,45 | 0,99 | 57,14 | 0,7506 | 0,2812 | |||
| MS / Morgan Stanley | 0,01 | 27,91 | 0,95 | 54,46 | 0,7229 | 0,2630 | |||
| GOOGL / Alphabet Inc. | 0,01 | 0,40 | 0,93 | 14,41 | 0,7050 | 0,0996 | |||
| ROP / Roper Technologies, Inc. | 0,00 | -7,55 | 0,92 | -11,07 | 0,6945 | -0,0732 | |||
| CTAS / Cintas Corporation | 0,00 | -10,23 | 0,82 | -2,74 | 0,6201 | -0,0058 | |||
| MA / Mastercard Incorporated | 0,00 | -13,51 | 0,81 | -11,34 | 0,6165 | -0,0666 | |||
| COST / Costco Wholesale Corporation | 0,00 | -10,45 | 0,79 | -6,30 | 0,5982 | -0,0289 | |||
| GOOG / Alphabet Inc. | 0,00 | 0,43 | 0,78 | 14,08 | 0,5904 | 0,0817 | |||
| ACN / Accenture plc | 0,00 | -7,30 | 0,76 | -11,18 | 0,5787 | -0,0616 | |||
| PM / Philip Morris International Inc. | 0,00 | -10,50 | 0,75 | 2,59 | 0,5708 | 0,0247 | |||
| NDAQ / Nasdaq, Inc. | 0,01 | -14,47 | 0,75 | 0,81 | 0,5676 | 0,0145 | |||
| IBM / International Business Machines Corporation | 0,00 | -14,70 | 0,75 | 1,09 | 0,5652 | 0,0160 | |||
| RTX / RTX Corporation | 0,01 | -7,57 | 0,74 | 1,94 | 0,5583 | 0,0199 | |||
| HD / The Home Depot, Inc. | 0,00 | 8,84 | 0,71 | 9,02 | 0,5406 | 0,0528 | |||
| ADI / Analog Devices, Inc. | 0,00 | -7,37 | 0,69 | 9,22 | 0,5215 | 0,0528 | |||
| PLTR / Palantir Technologies Inc. | 0,01 | 53,08 | 0,68 | 146,93 | 0,5192 | 0,3129 | |||
| MCD / McDonald's Corporation | 0,00 | -10,34 | 0,68 | -16,07 | 0,5188 | -0,0890 | |||
| TYIA / Johnson Controls International plc | 0,01 | -7,88 | 0,68 | 21,47 | 0,5148 | 0,0983 | |||
| GWW / W.W. Grainger, Inc. | 0,00 | -11,84 | 0,67 | -7,16 | 0,5110 | -0,0298 | |||
| PH / Parker-Hannifin Corporation | 0,00 | -10,31 | 0,66 | 2,98 | 0,4978 | 0,0232 | |||
| SCHW / The Charles Schwab Corporation | 0,01 | -8,04 | 0,66 | 7,20 | 0,4969 | 0,0414 | |||
| T / AT&T Inc. | 0,02 | -10,52 | 0,65 | -8,46 | 0,4927 | -0,0359 | |||
| PG / The Procter & Gamble Company | 0,00 | -13,16 | 0,65 | -18,87 | 0,4896 | -0,1029 | |||
| BKNG / Booking Holdings Inc. | 0,00 | -14,17 | 0,63 | 7,86 | 0,4784 | 0,0426 | |||
| TSLA / Tesla, Inc. | 0,00 | 3,73 | 0,63 | 27,24 | 0,4752 | 0,1080 | |||
| HON / Honeywell International Inc. | 0,00 | -7,64 | 0,62 | 1,63 | 0,4719 | 0,0155 | |||
| CSCO / Cisco Systems, Inc. | 0,01 | 41,34 | 0,62 | 59,17 | 0,4672 | 0,1783 | |||
| ISRG / Intuitive Surgical, Inc. | 0,00 | -10,57 | 0,59 | -1,99 | 0,4495 | -0,0006 | |||
| BRK.B / Berkshire Hathaway Inc. | 0,00 | 2,39 | 0,58 | -6,74 | 0,4412 | -0,0230 | |||
| NVT / nVent Electric plc | 0,01 | -7,36 | 0,57 | 29,35 | 0,4348 | 0,1048 | |||
| LOW / Lowe's Companies, Inc. | 0,00 | -31,17 | 0,57 | -34,52 | 0,4316 | -0,2160 | |||
| GS / The Goldman Sachs Group, Inc. | 0,00 | 2,88 | 0,56 | 33,33 | 0,4217 | 0,1109 | |||
| APD / Air Products and Chemicals, Inc. | 0,00 | 0,31 | 0,56 | -4,15 | 0,4213 | -0,0102 | |||
| CAT / Caterpillar Inc. | 0,00 | -22,20 | 0,55 | -8,46 | 0,4188 | -0,0305 | |||
| VZ / Verizon Communications Inc. | 0,01 | -20,94 | 0,54 | -24,62 | 0,4117 | -0,1246 | |||
| GD / General Dynamics Corporation | 0,00 | -7,55 | 0,54 | -1,10 | 0,4086 | 0,0027 | |||
| QCOM / QUALCOMM Incorporated | 0,00 | -14,92 | 0,54 | -11,80 | 0,4082 | -0,0465 | |||
| C / Citigroup Inc. | 0,01 | -10,52 | 0,52 | 7,19 | 0,3964 | 0,0334 | |||
| BSX / Boston Scientific Corporation | 0,00 | -5,31 | 0,52 | 0,98 | 0,3921 | 0,0100 | |||
| ARES / Ares Management Corporation | 0,00 | 166,00 | 0,46 | 214,97 | 0,3514 | 0,2415 | |||
| ECL / Ecolab Inc. | 0,00 | -7,49 | 0,46 | -1,51 | 0,3458 | 0,0002 | |||
| CSL / Carlisle Companies Incorporated | 0,00 | -27,36 | 0,44 | -20,29 | 0,3338 | -0,0779 | |||
| ROST / Ross Stores, Inc. | 0,00 | -7,19 | 0,44 | -7,42 | 0,3320 | -0,0201 | |||
| TJX / The TJX Companies, Inc. | 0,00 | -19,87 | 0,43 | -18,74 | 0,3224 | -0,0675 | |||
| PEP / PepsiCo, Inc. | 0,00 | -9,78 | 0,41 | -20,54 | 0,3140 | -0,0743 | |||
| DHR / Danaher Corporation | 0,00 | -7,19 | 0,41 | -10,48 | 0,3112 | -0,0307 | |||
| CVX / Chevron Corporation | 0,00 | -7,25 | 0,41 | -20,54 | 0,3111 | -0,0739 | |||
| MO / Altria Group, Inc. | 0,01 | -17,73 | 0,40 | -19,68 | 0,3035 | -0,0676 | |||
| NEE / NextEra Energy, Inc. | 0,01 | -7,34 | 0,40 | -9,30 | 0,3034 | -0,0251 | |||
| CASY / Casey's General Stores, Inc. | 0,00 | -10,36 | 0,39 | 5,38 | 0,2979 | 0,0202 | |||
| TMUS / T-Mobile US, Inc. | 0,00 | -1,32 | 0,36 | -11,85 | 0,2708 | -0,0310 | |||
| APH / Amphenol Corporation | 0,00 | -18,25 | 0,35 | 23,34 | 0,2685 | 0,0542 | |||
| GILD / Gilead Sciences, Inc. | 0,00 | 49,07 | 0,35 | 47,66 | 0,2638 | 0,0881 | |||
| ANET / Arista Networks Inc | 0,00 | -18,55 | 0,34 | 7,57 | 0,2588 | 0,0224 | |||
| MMC / Marsh & McLennan Companies, Inc. | 0,00 | -6,87 | 0,34 | -16,42 | 0,2586 | -0,0459 | |||
| STE / STERIS plc | 0,00 | -7,48 | 0,33 | -2,08 | 0,2501 | -0,0005 | |||
| BDX / Becton, Dickinson and Company | 0,00 | -7,19 | 0,33 | -30,36 | 0,2494 | -0,1017 | |||
| SPOT / Spotify Technology S.A. | 0,00 | 9,25 | 0,33 | 53,05 | 0,2472 | 0,0879 | |||
| EOG / EOG Resources, Inc. | 0,00 | -9,61 | 0,32 | -15,55 | 0,2389 | -0,0395 | |||
| XOM / Exxon Mobil Corporation | 0,00 | -8,14 | 0,30 | -16,85 | 0,2250 | -0,0405 | |||
| ADP / Automatic Data Processing, Inc. | 0,00 | 39,43 | 0,29 | 40,89 | 0,2174 | 0,0656 | |||
| SHW / The Sherwin-Williams Company | 0,00 | -7,85 | 0,28 | -9,32 | 0,2140 | -0,0180 | |||
| ERIE / Erie Indemnity Company | 0,00 | -6,81 | 0,27 | -22,86 | 0,2051 | -0,0562 | |||
| CL / Colgate-Palmolive Company | 0,00 | -15,85 | 0,27 | -18,24 | 0,2042 | -0,0416 | |||
| MKC / McCormick & Company, Incorporated | 0,00 | -7,64 | 0,27 | -14,97 | 0,2029 | -0,0314 | |||
| MCO / Moody's Corporation | 0,00 | -17,09 | 0,26 | -10,65 | 0,1974 | -0,0198 | |||
| TSCO / Tractor Supply Company | 0,00 | 10,47 | 0,24 | 6,09 | 0,1853 | 0,0132 | |||
| WST / West Pharmaceutical Services, Inc. | 0,00 | -7,15 | 0,24 | -9,40 | 0,1831 | -0,0152 | |||
| AMAT / Applied Materials, Inc. | 0,00 | -69,56 | 0,23 | -61,65 | 0,1763 | -0,2747 | |||
| HWM / Howmet Aerospace Inc. | 0,00 | -2,06 | 0,23 | 41,10 | 0,1747 | 0,0526 | |||
| FI / Fiserv, Inc. | 0,00 | 43,37 | 0,23 | 11,82 | 0,1724 | 0,0211 | |||
| BMY / Bristol-Myers Squibb Company | 0,00 | 26,53 | 0,23 | -3,83 | 0,1714 | -0,0040 | |||
| MSI / Motorola Solutions, Inc. | 0,00 | -20,79 | 0,22 | -23,96 | 0,1664 | -0,0485 | |||
| MMM / 3M Company | 0,00 | 32,54 | 0,21 | 37,66 | 0,1612 | 0,0459 | |||
| RCL / Royal Caribbean Cruises Ltd. | 0,00 | 2,05 | 0,20 | 55,38 | 0,1536 | 0,0566 | |||
| DHI / D.R. Horton, Inc. | 0,00 | -9,66 | 0,19 | -8,82 | 0,1417 | -0,0103 | |||
| HLT / Hilton Worldwide Holdings Inc. | 0,00 | -10,63 | 0,18 | 4,14 | 0,1341 | 0,0081 | |||
| FTNT / Fortinet, Inc. | 0,00 | 29,44 | 0,18 | 42,28 | 0,1332 | 0,0411 | |||
| SPG / Simon Property Group, Inc. | 0,00 | -21,46 | 0,17 | -23,77 | 0,1289 | -0,0377 | |||
| FAST / Fastenal Company | 0,00 | 66,71 | 0,17 | -9,63 | 0,1285 | -0,0113 | |||
| CRH / CRH plc | 0,00 | -10,47 | 0,17 | -6,67 | 0,1280 | -0,0066 | |||
| ORLY / O'Reilly Automotive, Inc. | 0,00 | 1 837,50 | 0,17 | 21,90 | 0,1271 | 0,0247 | |||
| NKE / NIKE, Inc. | 0,00 | -7,67 | 0,16 | 3,16 | 0,1238 | 0,0061 | |||
| ITW / Illinois Tool Works Inc. | 0,00 | 31,45 | 0,16 | 30,89 | 0,1222 | 0,0306 | |||
| PCAR / PACCAR Inc | 0,00 | -20,32 | 0,16 | -22,17 | 0,1199 | -0,0315 | |||
| AON / Aon plc | 0,00 | 35,40 | 0,16 | 21,09 | 0,1179 | 0,0222 | |||
| BK / The Bank of New York Mellon Corporation | 0,00 | 37,05 | 0,15 | 49,50 | 0,1147 | 0,0390 | |||
| GM / General Motors Company | 0,00 | -19,47 | 0,15 | -15,82 | 0,1134 | -0,0188 | |||
| MDT / Medtronic plc | 0,00 | -64,55 | 0,15 | -60,85 | 0,1127 | -0,1304 | |||
| RSG / Republic Services, Inc. | 0,00 | -21,32 | 0,15 | -20,11 | 0,1118 | -0,0253 | |||
| WELL / Welltower Inc. | 0,00 | 0,14 | 0,1071 | 0,1071 | |||||
| TGT / Target Corporation | 0,00 | -6,69 | 0,14 | -11,95 | 0,1064 | -0,0121 | |||
| SBUX / Starbucks Corporation | 0,00 | -48,14 | 0,14 | -39,11 | 0,1044 | -0,0404 | |||
| CMI / Cummins Inc. | 0,00 | -10,68 | 0,13 | -6,29 | 0,1018 | -0,0054 | |||
| GLW / Corning Incorporated | 0,00 | -10,58 | 0,12 | 3,33 | 0,0941 | 0,0041 | |||
| DASH / DoorDash, Inc. | 0,00 | 0,12 | 0,0891 | 0,0891 | |||||
| GRMN / Garmin Ltd. | 0,00 | -10,65 | 0,12 | -13,97 | 0,0889 | -0,0128 | |||
| KMB / Kimberly-Clark Corporation | 0,00 | 3,12 | 0,12 | -6,50 | 0,0873 | -0,0045 | |||
| CTSH / Cognizant Technology Solutions Corporation | 0,00 | -19,26 | 0,11 | -17,99 | 0,0870 | -0,0168 | |||
| COF / Capital One Financial Corporation | 0,00 | -72,96 | 0,11 | -37,78 | 0,0852 | -0,0261 | |||
| FICO / Fair Isaac Corporation | 0,00 | -10,29 | 0,11 | -11,20 | 0,0845 | -0,0089 | |||
| EBAY / eBay Inc. | 0,00 | -10,65 | 0,11 | -1,79 | 0,0838 | -0,0000 | |||
| O / Realty Income Corporation | 0,00 | -10,57 | 0,11 | -11,57 | 0,0816 | -0,0087 | |||
| SYF / Synchrony Financial | 0,00 | -10,67 | 0,11 | 12,77 | 0,0805 | 0,0103 | |||
| KR / The Kroger Co. | 0,00 | 37,80 | 0,11 | 47,22 | 0,0805 | 0,0263 | |||
| VST / Vistra Corp. | 0,00 | -60,83 | 0,10 | -11,97 | 0,0786 | 0,0032 | |||
| ETR / Entergy Corporation | 0,00 | -10,51 | 0,10 | -12,71 | 0,0783 | -0,0101 | |||
| RMD / ResMed Inc. | 0,00 | -10,72 | 0,10 | 2,08 | 0,0749 | 0,0034 | |||
| VICI / VICI Properties Inc. | 0,00 | 3,32 | 0,09 | 3,45 | 0,0685 | 0,0033 | |||
| HPE / Hewlett Packard Enterprise Company | 0,00 | -10,54 | 0,09 | 18,92 | 0,0671 | 0,0115 | |||
| NEM / Newmont Corporation | 0,00 | 0,09 | 0,0667 | 0,0667 | |||||
| DAL / Delta Air Lines, Inc. | 0,00 | -10,58 | 0,09 | 1,19 | 0,0646 | 0,0017 | |||
| WSM / Williams-Sonoma, Inc. | 0,00 | -23,19 | 0,08 | -21,43 | 0,0591 | -0,0141 | |||
| NTAP / NetApp, Inc. | 0,00 | -26,99 | 0,08 | -10,59 | 0,0577 | -0,0063 | |||
| HPQ / HP Inc. | 0,00 | -22,16 | 0,08 | -31,19 | 0,0572 | -0,0245 | |||
| EME / EMCOR Group, Inc. | 0,00 | -10,19 | 0,08 | 29,31 | 0,0572 | 0,0140 | |||
| TRGP / Targa Resources Corp. | 0,00 | 21,02 | 0,07 | 5,71 | 0,0562 | 0,0037 | |||
| FIX / Comfort Systems USA, Inc. | 0,00 | -11,26 | 0,07 | 47,92 | 0,0545 | 0,0182 | |||
| UNH / UnitedHealth Group Incorporated | 0,00 | -91,72 | 0,07 | -95,10 | 0,0542 | -1,0254 | |||
| NRG / NRG Energy, Inc. | 0,00 | -37,99 | 0,07 | 9,23 | 0,0541 | 0,0114 | |||
| LII / Lennox International Inc. | 0,00 | -10,14 | 0,07 | -7,79 | 0,0539 | -0,0038 | |||
| PAYX / Paychex, Inc. | 0,00 | 0,07 | 0,0533 | 0,0533 | |||||
| UAL / United Airlines Holdings, Inc. | 0,00 | 34,75 | 0,07 | 58,14 | 0,0517 | 0,0190 | |||
| IP / International Paper Company | 0,00 | 13,06 | 0,07 | -1,52 | 0,0498 | 0,0005 | |||
| TPL / Texas Pacific Land Corporation | 0,00 | -10,29 | 0,06 | -28,89 | 0,0489 | -0,0183 | |||
| TPR / Tapestry, Inc. | 0,00 | -10,50 | 0,06 | 12,28 | 0,0488 | 0,0058 | |||
| MTB / M&T Bank Corporation | 0,00 | 17,08 | 0,06 | 26,00 | 0,0484 | 0,0110 | |||
| AVB / AvalonBay Communities, Inc. | 0,00 | -10,89 | 0,06 | -14,86 | 0,0480 | -0,0078 | |||
| THC / Tenet Healthcare Corporation | 0,00 | -10,47 | 0,06 | 18,87 | 0,0479 | 0,0077 | |||
| CAH / Cardinal Health, Inc. | 0,00 | -70,44 | 0,06 | -50,00 | 0,0462 | -0,0313 | |||
| CFG / Citizens Financial Group, Inc. | 0,00 | -10,67 | 0,06 | -1,64 | 0,0457 | -0,0003 | |||
| AWI / Armstrong World Industries, Inc. | 0,00 | -10,41 | 0,06 | 3,45 | 0,0456 | 0,0022 | |||
| EHC / Encompass Health Corporation | 0,00 | -10,60 | 0,06 | 7,27 | 0,0455 | 0,0042 | |||
| STLD / Steel Dynamics, Inc. | 0,00 | -22,94 | 0,06 | -21,33 | 0,0453 | -0,0111 | |||
| YUM / Yum! Brands, Inc. | 0,00 | -70,58 | 0,06 | -65,50 | 0,0453 | -0,0660 | |||
| RGLD / Royal Gold, Inc. | 0,00 | -10,54 | 0,06 | -3,33 | 0,0446 | -0,0004 | |||
| MRP / Millrose Properties, Inc. | 0,00 | 214,07 | 0,06 | 241,18 | 0,0444 | 0,0315 | |||
| EXEL / Exelixis, Inc. | 0,00 | -10,67 | 0,06 | 5,56 | 0,0439 | 0,0035 | |||
| K / Kellanova | 0,00 | -10,58 | 0,06 | -14,93 | 0,0438 | -0,0061 | |||
| GWRE / Guidewire Software, Inc. | 0,00 | -10,62 | 0,06 | 11,76 | 0,0436 | 0,0055 | |||
| GDDY / GoDaddy Inc. | 0,00 | 15,16 | 0,06 | 16,33 | 0,0435 | 0,0064 | |||
| CF / CF Industries Holdings, Inc. | 0,00 | -10,52 | 0,06 | 5,56 | 0,0433 | 0,0029 | |||
| NEU / NewMarket Corporation | 0,00 | -8,89 | 0,06 | 12,00 | 0,0429 | 0,0050 | |||
| UI / Ubiquiti Inc. | 0,00 | 0,06 | 0,0428 | 0,0428 | |||||
| RL / Ralph Lauren Corporation | 0,00 | -10,87 | 0,06 | 12,00 | 0,0426 | 0,0048 | |||
| PKG / Packaging Corporation of America | 0,00 | -10,30 | 0,06 | -15,38 | 0,0423 | -0,0064 | |||
| IBKR / Interactive Brokers Group, Inc. | 0,00 | 256,99 | 0,06 | 19,57 | 0,0418 | 0,0074 | |||
| FFIV / F5, Inc. | 0,00 | -10,68 | 0,05 | 0,00 | 0,0411 | 0,0002 | |||
| PODD / Insulet Corporation | 0,00 | 0,05 | 0,0410 | 0,0410 | |||||
| NTRS / Northern Trust Corporation | 0,00 | 0,05 | 0,0409 | 0,0409 | |||||
| DTM / DT Midstream, Inc. | 0,00 | -24,34 | 0,05 | -14,52 | 0,0407 | -0,0057 | |||
| DGX / Quest Diagnostics Incorporated | 0,00 | -10,54 | 0,05 | -5,36 | 0,0404 | -0,0014 | |||
| MTG / MGIC Investment Corporation | 0,00 | -10,60 | 0,05 | 1,92 | 0,0403 | 0,0009 | |||
| NFG / National Fuel Gas Company | 0,00 | -28,49 | 0,05 | -24,64 | 0,0401 | -0,0114 | |||
| R / Ryder System, Inc. | 0,00 | -10,51 | 0,05 | -1,89 | 0,0400 | 0,0003 | |||
| DPZ / Domino's Pizza, Inc. | 0,00 | -10,69 | 0,05 | -13,33 | 0,0400 | -0,0049 | |||
| SEIC / SEI Investments Company | 0,00 | -10,60 | 0,05 | 4,00 | 0,0396 | 0,0020 | |||
| ROL / Rollins, Inc. | 0,00 | -10,77 | 0,05 | -7,27 | 0,0394 | -0,0021 | |||
| ESS / Essex Property Trust, Inc. | 0,00 | -10,73 | 0,05 | -17,74 | 0,0393 | -0,0075 | |||
| SSNC / SS&C Technologies Holdings, Inc. | 0,00 | -10,47 | 0,05 | -12,07 | 0,0392 | -0,0042 | |||
| EPR / EPR Properties | 0,00 | -24,91 | 0,05 | -10,53 | 0,0390 | 0,0013 | |||
| DRI / Darden Restaurants, Inc. | 0,00 | -45,71 | 0,05 | -21,54 | 0,0387 | -0,0032 | |||
| TXRH / Texas Roadhouse, Inc. | 0,00 | -10,82 | 0,05 | 0,00 | 0,0386 | 0,0008 | |||
| LNC / Lincoln National Corporation | 0,00 | -10,64 | 0,05 | -15,25 | 0,0385 | -0,0054 | |||
| SCCO / Southern Copper Corporation | 0,00 | -4,76 | 0,05 | 2,04 | 0,0384 | 0,0018 | |||
| AXV / AXIS Capital Holdings Limited | 0,00 | -25,42 | 0,05 | -23,08 | 0,0381 | -0,0104 | |||
| RPRX / Royalty Pharma plc | 0,00 | 0,05 | 0,0381 | 0,0381 | |||||
| UGI / UGI Corporation | 0,00 | -33,88 | 0,05 | -26,47 | 0,0379 | -0,0133 | |||
| BJ / BJ's Wholesale Club Holdings, Inc. | 0,00 | -34,74 | 0,05 | -13,79 | 0,0379 | -0,0004 | |||
| AOS / Amdocs Limited | 0,00 | -10,49 | 0,05 | -10,91 | 0,0378 | -0,0038 | |||
| ATO / Atmos Energy Corporation | 0,00 | -10,53 | 0,05 | -10,91 | 0,0377 | -0,0038 | |||
| LOPE / Grand Canyon Education, Inc. | 0,00 | -27,22 | 0,05 | -20,97 | 0,0375 | -0,0089 | |||
| CUZ / Cousins Properties Incorporated | 0,00 | -10,64 | 0,05 | -9,26 | 0,0375 | -0,0030 | |||
| LH / Labcorp Holdings Inc. | 0,00 | 0,05 | 0,0374 | 0,0374 | |||||
| TOST / Toast, Inc. | 0,00 | -10,65 | 0,05 | 19,51 | 0,0372 | 0,0066 | |||
| AVT / Avnet, Inc. | 0,00 | -10,74 | 0,05 | -2,04 | 0,0371 | 0,0001 | |||
| INGR / Ingredion Incorporated | 0,00 | -10,42 | 0,05 | -11,11 | 0,0371 | -0,0035 | |||
| TWLO / Twilio Inc. | 0,00 | 0,05 | 0,0370 | 0,0370 | |||||
| JHG / Janus Henderson Group plc | 0,00 | -10,71 | 0,05 | -4,00 | 0,0368 | -0,0009 | |||
| UNM / Unum Group | 0,00 | -10,64 | 0,05 | -11,11 | 0,0365 | -0,0040 | |||
| EQH / Equitable Holdings, Inc. | 0,00 | 0,05 | 0,0362 | 0,0362 | |||||
| ALSN / Allison Transmission Holdings, Inc. | 0,00 | -10,59 | 0,05 | -11,32 | 0,0359 | -0,0038 | |||
| HIW / Highwoods Properties, Inc. | 0,00 | -10,59 | 0,05 | -6,00 | 0,0358 | -0,0017 | |||
| MEDP / Medpace Holdings, Inc. | 0,00 | -10,71 | 0,05 | -7,84 | 0,0357 | -0,0024 | |||
| FOXA / Fox Corporation | 0,00 | -33,39 | 0,05 | -33,80 | 0,0357 | -0,0175 | |||
| PINC / Premier, Inc. | 0,00 | -10,61 | 0,05 | 0,00 | 0,0356 | 0,0012 | |||
| DKS / DICK'S Sporting Goods, Inc. | 0,00 | -10,90 | 0,05 | -13,21 | 0,0355 | -0,0044 | |||
| EVRG / Evergy, Inc. | 0,00 | -64,98 | 0,05 | -65,41 | 0,0355 | -0,0277 | |||
| LPLA / LPL Financial Holdings Inc. | 0,00 | -58,47 | 0,05 | -45,24 | 0,0355 | -0,0184 | |||
| KRC / Kilroy Realty Corporation | 0,00 | -10,66 | 0,05 | -6,12 | 0,0353 | -0,0018 | |||
| DVN / Devon Energy Corporation | 0,00 | -10,55 | 0,05 | -23,33 | 0,0352 | -0,0102 | |||
| ADC / Agree Realty Corporation | 0,00 | -10,58 | 0,05 | -14,81 | 0,0351 | -0,0056 | |||
| SNX / TD SYNNEX Corporation | 0,00 | 0,05 | 0,0351 | 0,0351 | |||||
| HLI / Houlihan Lokey, Inc. | 0,00 | -10,49 | 0,05 | 0,00 | 0,0349 | 0,0005 | |||
| AYI / Acuity Inc. | 0,00 | -10,53 | 0,05 | 0,00 | 0,0346 | 0,0011 | |||
| MDU / MDU Resources Group, Inc. | 0,00 | 21,58 | 0,05 | 21,62 | 0,0344 | 0,0062 | |||
| DOCU / DocuSign, Inc. | 0,00 | -10,60 | 0,05 | -13,46 | 0,0344 | -0,0051 | |||
| PPC / Pilgrim's Pride Corporation | 0,00 | -10,69 | 0,05 | -26,23 | 0,0342 | -0,0114 | |||
| TNL / Travel + Leisure Co. | 0,00 | -10,79 | 0,04 | -2,22 | 0,0340 | 0,0004 | |||
| FOX / Fox Corporation | 0,00 | -36,34 | 0,04 | -38,03 | 0,0339 | -0,0195 | |||
| DVA / DaVita Inc. | 0,00 | -10,80 | 0,04 | -16,98 | 0,0339 | -0,0062 | |||
| OHI / Omega Healthcare Investors, Inc. | 0,00 | -10,72 | 0,04 | -13,73 | 0,0338 | -0,0048 | |||
| NNN / NNN REIT, Inc. | 0,00 | -10,71 | 0,04 | -8,33 | 0,0336 | -0,0029 | |||
| BBY / Best Buy Co., Inc. | 0,00 | -10,75 | 0,04 | -18,52 | 0,0334 | -0,0069 | |||
| JEF / Jefferies Financial Group Inc. | 0,00 | -10,68 | 0,04 | -10,42 | 0,0333 | -0,0026 | |||
| VMI / Valmont Industries, Inc. | 0,00 | 0,04 | 0,0332 | 0,0332 | |||||
| RITM / Rithm Capital Corp. | 0,00 | -22,74 | 0,04 | -23,21 | 0,0331 | -0,0040 | |||
| GLPI / Gaming and Leisure Properties, Inc. | 0,00 | -10,63 | 0,04 | -18,87 | 0,0330 | -0,0066 | |||
| UTHR / United Therapeutics Corporation | 0,00 | -10,65 | 0,04 | -17,31 | 0,0329 | -0,0059 | |||
| AMCR / Amcor plc | 0,00 | -3,48 | 0,04 | -21,82 | 0,0329 | -0,0033 | |||
| MASI / Masimo Corporation | 0,00 | 0,04 | 0,0318 | 0,0318 | |||||
| WAT / Waters Corporation | 0,00 | -10,45 | 0,04 | -16,33 | 0,0318 | -0,0050 | |||
| DOCS / Doximity, Inc. | 0,00 | -30,55 | 0,04 | -26,79 | 0,0317 | -0,0107 | |||
| SNA / Snap-on Incorporated | 0,00 | -11,56 | 0,04 | -18,37 | 0,0307 | -0,0062 | |||
| BROS / Dutch Bros Inc. | 0,00 | 0,04 | 0,0306 | 0,0306 | |||||
| EXPE / Expedia Group, Inc. | 0,00 | -39,85 | 0,04 | -33,90 | 0,0303 | -0,0071 | |||
| COKE / Coca-Cola Consolidated, Inc. | 0,00 | 797,44 | 0,04 | -25,00 | 0,0296 | -0,0096 | |||
| CHE / Chemed Corporation | 0,00 | -9,09 | 0,04 | -29,63 | 0,0295 | -0,0108 | |||
| G / Genpact Limited | 0,00 | -33,78 | 0,04 | -42,42 | 0,0294 | -0,0205 | |||
| LULU / lululemon athletica inc. | 0,00 | 0,04 | 0,0286 | 0,0286 | |||||
| EMN / Eastman Chemical Company | 0,00 | -10,59 | 0,04 | -24,49 | 0,0282 | -0,0084 | |||
| BRBR / BellRing Brands, Inc. | 0,00 | -10,82 | 0,04 | -31,37 | 0,0271 | -0,0113 | |||
| JAZZ / Jazz Pharmaceuticals plc | 0,00 | 0,04 | 0,0271 | 0,0271 | |||||
| WH / Wyndham Hotels & Resorts, Inc. | 0,00 | 0,04 | 0,0267 | 0,0267 | |||||
| GMED / Globus Medical, Inc. | 0,00 | -5,58 | 0,03 | -24,44 | 0,0265 | -0,0077 | |||
| APA / APA Corporation | 0,00 | -5,48 | 0,03 | -19,05 | 0,0263 | -0,0051 | |||
| PK / Park Hotels & Resorts Inc. | 0,00 | -10,59 | 0,03 | -15,00 | 0,0261 | -0,0038 | |||
| MPW / Medical Properties Trust, Inc. | 0,01 | 0,03 | 0,0260 | 0,0260 | |||||
| WU / The Western Union Company | 0,00 | -10,57 | 0,03 | -28,26 | 0,0252 | -0,0096 | |||
| OGN / Organon & Co. | 0,00 | -5,46 | 0,03 | -38,00 | 0,0235 | -0,0141 | |||
| CIVI / Civitas Resources, Inc. | 0,00 | -5,48 | 0,02 | -25,81 | 0,0180 | -0,0057 | |||
| ETRSI / DE (N/A) | -0,00 | -0,0008 | -0,0008 | ||||||
| S&P 500 E-Mini Index / DE (N/A) | -0,75 | -0,5712 | -0,5712 |