Statistiques de base
| Valeur du portefeuille | $ 367 202 179 |
| Positions actuelles | 83 |
Dernières positions, performances, ASG (à partir des dépôts 13F, 13D)
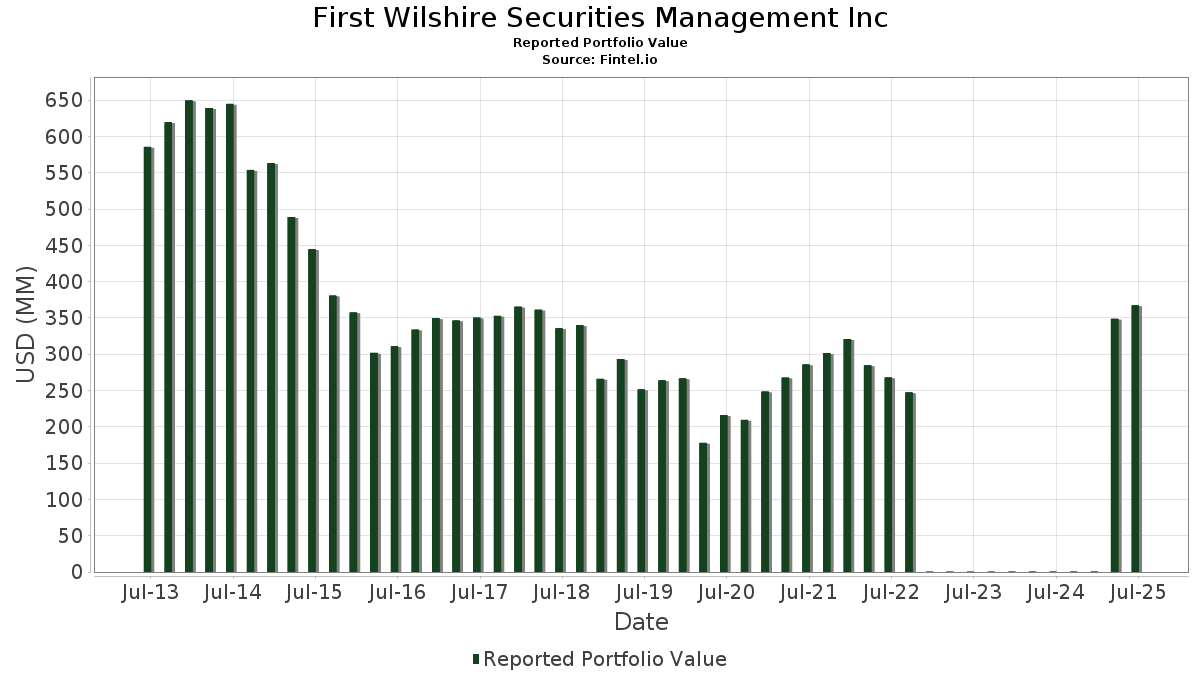
First Wilshire Securities Management Inc a déclaré un total de 83 positions dans ses derniers dépôts auprès de la SEC. La valeur la plus récente du portefeuille est calculée à 367 202 179 USD. Les actifs sous gestion réels (ASG) sont cette valeur plus les liquidités (qui ne sont pas divulguées). Les principales positions de First Wilshire Securities Management Inc sont iShares Trust - iShares 0-3 Month Treasury Bond ETF (US:SGOV) , EZCORP, Inc. (US:EZPW) , Camtek Ltd. (US:CAMT) , Liberty Global Ltd. (US:LBTYA) , and Ecovyst Inc. (US:ECVT) . Les nouvelles positions de First Wilshire Securities Management Inc incluent Orion Group Holdings, Inc. (US:ORN) , Magnachip Semiconductor Corporation (US:MX) , Pure Cycle Corporation (US:PCYO) , Citigroup Inc. (US:C) , and . Les principales industries de First Wilshire Securities Management Inc sont "Petroleum Refining And Related Industries" (sic 29) , "Motor Freight Transportation And Warehousing" (sic 42) , and "Mining And Quarrying Of Nonmetallic Minerals, Except Fuels" (sic 14) .
Meilleures augmentations ce trimestre
Nous utilisons la variation de l'allocation du portefeuille car il s'agit de l'indicateur le plus significatif. Les changements peuvent être dus à des transactions ou à des variations de prix des actions.
| Titre | Actions (en millions) |
Valeur ($ en millions) |
% du portefeuille | ΔPortefeuille % |
|---|---|---|---|---|
| 0,29 | 24,36 | 6,6326 | 3,3571 | |
| 0,70 | 7,26 | 1,9783 | 1,9783 | |
| 0,53 | 4,81 | 1,3108 | 1,3108 | |
| 0,47 | 15,16 | 4,1284 | 1,2642 | |
| 0,22 | 4,94 | 1,3461 | 1,0994 | |
| 0,53 | 12,78 | 3,4804 | 1,0887 | |
| 2,20 | 18,11 | 4,9321 | 0,9857 | |
| 1,30 | 3,80 | 1,0349 | 0,5885 | |
| 4,06 | 9,98 | 2,7191 | 0,5065 | |
| 0,46 | 1,83 | 0,4994 | 0,4994 |
Principales baisses ce trimestre
Nous utilisons la variation de l'allocation du portefeuille car il s'agit de l'indicateur le plus significatif. Les changements peuvent être dus à des transactions ou à des variations de prix des actions.
| Titre | Actions (en millions) |
Valeur ($ en millions) |
% du portefeuille | ΔPortefeuille % |
|---|---|---|---|---|
| 0,38 | 38,26 | 10,4199 | -1,7591 | |
| 0,90 | 12,17 | 3,3150 | -1,4234 | |
| 0,70 | 4,55 | 1,2380 | -1,2560 | |
| 2,33 | 23,29 | 6,3424 | -1,2457 | |
| 2,26 | 31,35 | 8,5382 | -1,2199 | |
| 0,07 | 6,85 | 1,8661 | -1,0755 | |
| 0,19 | 5,33 | 1,4524 | -0,7027 | |
| 0,02 | 8,67 | 2,3611 | -0,3813 | |
| 0,46 | 4,76 | 1,2953 | -0,2907 | |
| 0,26 | 4,07 | 1,1079 | -0,2205 |
Déclarations 13D/G
Il s'agit d'une liste des déclarations 13D et 13G déposées au cours de la dernière année (le cas échéant). Cliquez sur l'icône du lien pour voir l'historique complet des transactions. Les lignes vertes indiquent de nouvelles positions. Les lignes rouges indiquent des positions fermées.
| Date de dépôt | Formulaire | Titre | Actions précédentes |
Actions actuelles |
ΔActions % | % de participation |
% ΔParticipation | |
|---|---|---|---|---|---|---|---|---|
| 2025-02-13 | GIFI / Gulf Island Fabrication, Inc. | 1 002 339 | 980 333 | -2,20 | 6,00 | -3,23 | ||
| 2025-02-13 | MTRX / Matrix Service Company | 2 169 925 | 1 346 563 | -37,94 | 4,90 | -38,75 | ||
| 2025-02-13 | FGI / FGI Industries Ltd. | 872 056 | 745 183 | -14,55 | 7,80 | -17,89 | ||
| 2025-02-13 | SONX / Sonendo, Inc. | 33 000 | 7,90 | |||||
| 2025-02-13 | SILC / Silicom Ltd. | 499 563 | 390 700 | -21,79 | 6,30 | -7,35 |
Déclarations 13F et dépôts de fonds
Ce formulaire a été déposé le 2025-08-14 pour la période de déclaration 2025-06-30. Cliquez sur l'icône du lien pour voir l'historique complet des transactions.
Mettre à niveau pour débloquer les données premium et exporter vers Excel ![]() .
.
| Titre | Type | Prix moyen de l'action | Actions (en millions) |
ΔActions (%) |
ΔActions (%) |
Valeur ($ en millions) |
Portefeuille (%) |
ΔPortefeuille (%) |
|
|---|---|---|---|---|---|---|---|---|---|
| SGOV / iShares Trust - iShares 0-3 Month Treasury Bond ETF | 0,38 | -9,92 | 38,26 | -9,90 | 10,4199 | -1,7591 | |||
| EZPW / EZCORP, Inc. | 2,26 | -2,28 | 31,35 | -7,86 | 8,5382 | -1,2199 | |||
| CAMT / Camtek Ltd. | 0,29 | 47,85 | 24,36 | 113,25 | 6,6326 | 3,3571 | |||
| LBTYA / Liberty Global Ltd. | 2,33 | 1,21 | 23,29 | -11,98 | 6,3424 | -1,2457 | |||
| ECVT / Ecovyst Inc. | 2,20 | -0,85 | 18,11 | 31,61 | 4,9321 | 0,9857 | |||
| TPH / Tri Pointe Homes, Inc. | 0,47 | 51,65 | 15,16 | 51,79 | 4,1284 | 1,2642 | |||
| SD / SandRidge Energy, Inc. | 1,24 | 7,27 | 13,40 | 1,64 | 3,6496 | -0,1320 | |||
| NWPX / NWPX Infrastructure, Inc. | 0,33 | 0,01 | 13,35 | -0,69 | 3,6367 | -0,2199 | |||
| AVNW / Aviat Networks, Inc. | 0,53 | 22,15 | 12,78 | 53,26 | 3,4804 | 1,0887 | |||
| MTRX / Matrix Service Company | 0,90 | -32,21 | 12,17 | -26,32 | 3,3150 | -1,4234 | |||
| GILT / Gilat Satellite Networks Ltd. | 1,47 | 1,02 | 10,41 | 12,79 | 2,8345 | 0,1880 | |||
| CRNT / Ceragon Networks Ltd. | 4,06 | 23,63 | 9,98 | 29,41 | 2,7191 | 0,5065 | |||
| BRK.B / Berkshire Hathaway Inc. | 0,02 | -0,60 | 8,67 | -9,33 | 2,3611 | -0,3813 | |||
| RELL / Richardson Electronics, Ltd. | 0,84 | 11,97 | 8,09 | -3,17 | 2,2024 | -0,1931 | |||
| TPC / Tutor Perini Corporation | 0,16 | -38,15 | 7,66 | 24,82 | 2,0861 | 0,3260 | |||
| HUN / Huntsman Corporation | 0,70 | 7,26 | 1,9783 | 1,9783 | |||||
| BIL / SPDR Series Trust - SPDR Bloomberg 1-3 Month T-Bill ETF | 0,07 | -33,19 | 6,85 | -33,20 | 1,8661 | -1,0755 | |||
| GIFI / Gulf Island Fabrication, Inc. | 1,02 | 4,14 | 6,78 | 7,21 | 1,8457 | 0,0327 | |||
| SILC / Silicom Ltd. | 0,39 | -1,03 | 6,02 | 2,85 | 1,6402 | -0,0389 | |||
| RBBN / Ribbon Communications Inc. | 1,33 | -0,45 | 5,34 | 1,85 | 1,4537 | -0,0496 | |||
| IMAX / IMAX Corporation | 0,19 | -33,11 | 5,33 | -29,03 | 1,4524 | -0,7027 | |||
| AGM / Federal Agricultural Mortgage Corporation | 0,03 | -0,50 | 5,31 | 3,09 | 1,4451 | -0,0310 | |||
| VTS / Vitesse Energy, Inc. | 0,22 | 539,66 | 4,94 | 474,65 | 1,3461 | 1,0994 | |||
| ORN / Orion Group Holdings, Inc. | 0,53 | 4,81 | 1,3108 | 1,3108 | |||||
| LBTYK / Liberty Global Ltd. | 0,46 | -0,15 | 4,76 | -14,00 | 1,2953 | -0,2907 | |||
| EWBC / East West Bancorp, Inc. | 0,05 | -3,18 | 4,75 | 8,92 | 1,2931 | 0,0429 | |||
| SIGA / SIGA Technologies, Inc. | 0,70 | -56,06 | 4,55 | -47,73 | 1,2380 | -1,2560 | |||
| LXFR / Luxfer Holdings PLC | 0,35 | -1,20 | 4,27 | 1,47 | 1,1626 | -0,0440 | |||
| LMNR / Limoneira Company | 0,26 | -0,55 | 4,07 | -12,18 | 1,1079 | -0,2205 | |||
| SATX / Satixfy Communications Ltd. | 1,30 | 0,00 | 3,80 | 144,22 | 1,0349 | 0,5885 | |||
| CRDA / Crawford & Co. - Class A | 0,35 | -0,95 | 3,69 | -8,25 | 1,0062 | -0,1485 | |||
| ANDE / The Andersons, Inc. | 0,10 | 3,10 | 3,56 | -11,74 | 0,9683 | -0,1870 | |||
| JEF / Jefferies Financial Group Inc. | 0,05 | -0,45 | 2,90 | 1,61 | 0,7891 | -0,0286 | |||
| MSFT / Microsoft Corporation | 0,00 | 0,00 | 1,99 | 32,51 | 0,5418 | 0,1112 | |||
| MX / Magnachip Semiconductor Corporation | 0,46 | 1,83 | 0,4994 | 0,4994 | |||||
| CRD.B / Crawford & Company | 0,14 | -2,31 | 1,50 | -10,61 | 0,4083 | -0,0729 | |||
| SGC / Superior Group of Companies, Inc. | 0,14 | -0,66 | 1,46 | -6,49 | 0,3967 | -0,0500 | |||
| SIRI / Sirius XM Holdings Inc. | 0,06 | -0,05 | 1,40 | 1,82 | 0,3818 | -0,0130 | |||
| PCYO / Pure Cycle Corporation | 0,12 | 1,27 | 0,3461 | 0,3461 | |||||
| XLY / The Select Sector SPDR Trust - The Consumer Discretionary Select Sector SPDR Fund | 0,01 | 0,00 | 1,26 | 10,14 | 0,3432 | 0,0148 | |||
| SCHD / Schwab Strategic Trust - Schwab U.S. Dividend Equity ETF | 0,04 | 0,00 | 1,16 | -5,22 | 0,3166 | -0,0352 | |||
| XLK / The Select Sector SPDR Trust - The Technology Select Sector SPDR Fund | 0,00 | 0,00 | 1,00 | 22,70 | 0,2724 | 0,0385 | |||
| CHKP / Check Point Software Technologies Ltd. | 0,00 | 0,00 | 0,95 | -2,86 | 0,2593 | -0,0220 | |||
| VOO / Vanguard Index Funds - Vanguard S&P 500 ETF | 0,00 | 0,00 | 0,87 | 10,55 | 0,2371 | 0,0112 | |||
| GE / General Electric Company | 0,00 | 0,00 | 0,82 | 28,68 | 0,2236 | 0,0405 | |||
| MPC / Marathon Petroleum Corporation | 0,00 | 0,00 | 0,80 | 14,06 | 0,2165 | 0,0165 | |||
| TTEK / Tetra Tech, Inc. | 0,02 | 0,00 | 0,77 | 23,09 | 0,2105 | 0,0302 | |||
| VHT / Vanguard World Fund - Vanguard Health Care ETF | 0,00 | 0,00 | 0,76 | -6,20 | 0,2063 | -0,0253 | |||
| ATLX / Atlas Lithium Corporation | 0,19 | 210,31 | 0,71 | 126,92 | 0,1929 | 0,1034 | |||
| IHI / iShares Trust - iShares U.S. Medical Devices ETF | 0,01 | 0,00 | 0,71 | 3,97 | 0,1928 | -0,0023 | |||
| SHEL / Shell plc - Depositary Receipt (Common Stock) | 0,01 | 1,26 | 0,68 | -2,74 | 0,1841 | -0,0152 | |||
| BAC / Bank of America Corporation | 0,01 | 0,00 | 0,64 | 13,37 | 0,1734 | 0,0124 | |||
| XLF / The Select Sector SPDR Trust - The Financial Select Sector SPDR Fund | 0,01 | 0,00 | 0,63 | 5,04 | 0,1704 | -0,0003 | |||
| AMZN / Amazon.com, Inc. | 0,00 | 0,00 | 0,60 | 15,41 | 0,1633 | 0,0142 | |||
| SHV / iShares Trust - iShares Short Treasury Bond ETF | 0,01 | 1,05 | 0,58 | 0,88 | 0,1568 | -0,0067 | |||
| ABT / Abbott Laboratories | 0,00 | 0,00 | 0,54 | 2,64 | 0,1482 | -0,0040 | |||
| CSCO / Cisco Systems, Inc. | 0,01 | 0,00 | 0,53 | 12,47 | 0,1450 | 0,0092 | |||
| HD / The Home Depot, Inc. | 0,00 | 0,00 | 0,49 | 0,00 | 0,1323 | -0,0070 | |||
| DGX / Quest Diagnostics Incorporated | 0,00 | 0,00 | 0,42 | 6,30 | 0,1150 | 0,0009 | |||
| J / Jacobs Solutions Inc. | 0,00 | 0,00 | 0,40 | 8,77 | 0,1083 | 0,0034 | |||
| BABA / Alibaba Group Holding Limited - Depositary Receipt (Common Stock) | 0,00 | 0,00 | 0,39 | -14,32 | 0,1061 | -0,0242 | |||
| IYT / iShares Trust - iShares U.S. Transportation ETF | 0,01 | 0,00 | 0,38 | 6,98 | 0,1045 | 0,0017 | |||
| XLC / The Select Sector SPDR Trust - The Communication Services Select Sector SPDR Fund | 0,00 | 0,00 | 0,38 | 12,46 | 0,1034 | 0,0066 | |||
| JNJ / Johnson & Johnson | 0,00 | 9,38 | 0,37 | 0,82 | 0,1000 | -0,0045 | |||
| FGI / FGI Industries Ltd. | 0,56 | -25,50 | 0,36 | -37,46 | 0,0978 | -0,0670 | |||
| GOOGL / Alphabet Inc. | 0,00 | 2,16 | 0,36 | 16,29 | 0,0975 | 0,0093 | |||
| VYM / Vanguard Whitehall Funds - Vanguard High Dividend Yield ETF | 0,00 | 0,00 | 0,35 | 3,28 | 0,0944 | -0,0018 | |||
| JPM / JPMorgan Chase & Co. | 0,00 | 0,00 | 0,35 | 18,15 | 0,0942 | 0,0103 | |||
| PG / The Procter & Gamble Company | 0,00 | 0,00 | 0,32 | -6,47 | 0,0868 | -0,0110 | |||
| CMC / Commercial Metals Company | 0,01 | 0,00 | 0,32 | 6,02 | 0,0866 | 0,0008 | |||
| CUBI / Customers Bancorp, Inc. | 0,00 | 0,00 | 0,29 | 17,14 | 0,0784 | 0,0078 | |||
| GEV / GE Vernova Inc. | 0,00 | 0,28 | 0,0768 | 0,0768 | |||||
| IVV / iShares Trust - iShares Core S&P 500 ETF | 0,00 | 0,00 | 0,28 | 10,67 | 0,0764 | 0,0036 | |||
| SHY / iShares Trust - iShares 1-3 Year Treasury Bond ETF | 0,00 | -4,50 | 0,28 | -4,45 | 0,0762 | -0,0077 | |||
| CVX / Chevron Corporation | 0,00 | 3,33 | 0,24 | -11,59 | 0,0665 | -0,0127 | |||
| NEAR / iShares U.S. ETF Trust - iShares Short Duration Bond Active ETF | 0,00 | 0,00 | 0,24 | 0,43 | 0,0642 | -0,0031 | |||
| C / Citigroup Inc. | 0,00 | 0,21 | 0,0585 | 0,0585 | |||||
| BILS / SPDR Series Trust - SPDR Bloomberg 3-12 Month T-Bill ETF | 0,00 | -2,42 | 0,21 | -2,30 | 0,0578 | -0,0046 | |||
| CHN / The China Fund, Inc. | 0,01 | -4,37 | 0,21 | 10,70 | 0,0565 | 0,0028 | |||
| PFE / Pfizer Inc. | 0,01 | -2,32 | 0,20 | -6,88 | 0,0555 | -0,0071 | |||
| PSTL / Postal Realty Trust, Inc. | 0,01 | 20,34 | 0,19 | 23,72 | 0,0528 | 0,0080 | |||
| PFXF / VanEck ETF Trust - VanEck Preferred Securities ex Financials ETF | 0,01 | -4,90 | 0,18 | -2,67 | 0,0496 | -0,0042 | |||
| SEED / Origin Agritech Limited | 0,02 | 0,00 | 0,02 | -50,00 | 0,0054 | -0,0055 | |||
| SNRE / Sunrise Communications AG - Depositary Receipt (Common Stock) | 0,00 | -100,00 | 0,00 | 0,0000 |