Statistiques de base
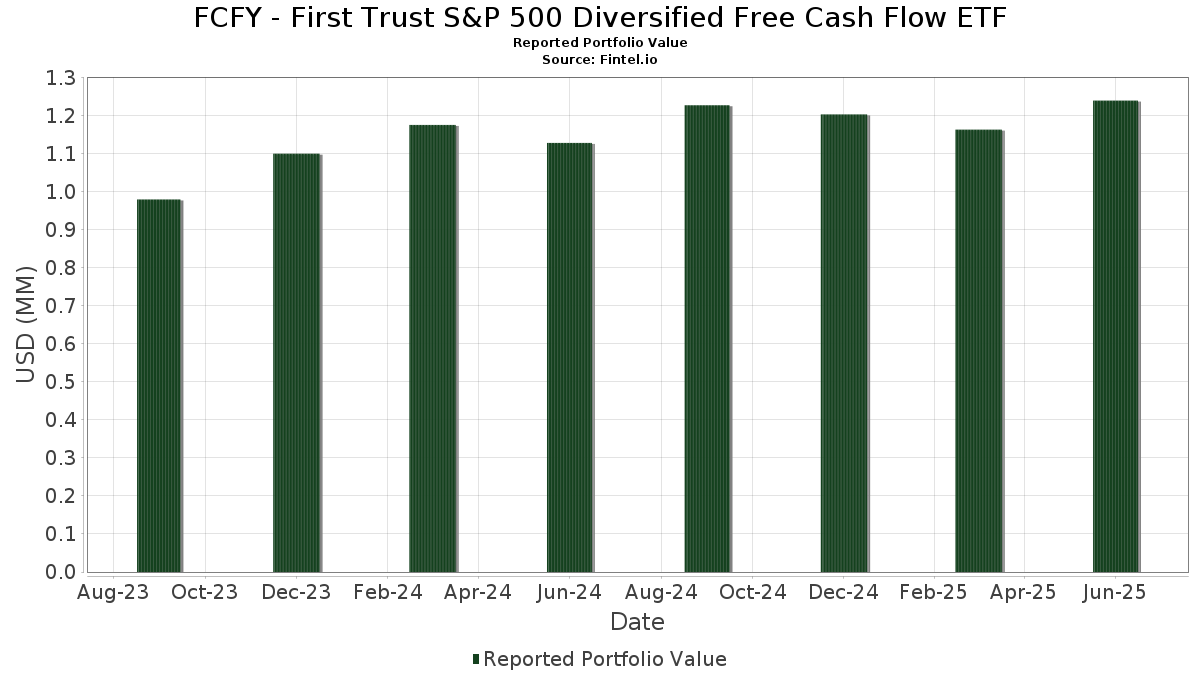
| Valeur du portefeuille | $ 1 239 539 |
| Positions actuelles | 103 |
Dernières positions, performances, ASG (à partir des dépôts 13F, 13D)
FCFY - First Trust S&P 500 Diversified Free Cash Flow ETF a déclaré un total de 103 positions dans ses derniers dépôts auprès de la SEC. La valeur la plus récente du portefeuille est calculée à 1 239 539 USD. Les actifs sous gestion réels (ASG) sont cette valeur plus les liquidités (qui ne sont pas divulguées). Les principales positions de FCFY - First Trust S&P 500 Diversified Free Cash Flow ETF sont Skyworks Solutions, Inc. (US:SWKS) , Jabil Inc. (US:JBL) , Synchrony Financial (US:SYF) , Hewlett Packard Enterprise Company (US:HPE) , and HP Inc. (US:HPQ) . Les nouvelles positions de FCFY - First Trust S&P 500 Diversified Free Cash Flow ETF incluent ON Semiconductor Corporation (US:ON) , Zebra Technologies Corporation (US:ZBRA) , Omnicom Group Inc. (US:OMC) , Dollar Tree, Inc. (US:DLTR) , and Merck & Co., Inc. (US:MRK) .
Meilleures augmentations ce trimestre
Nous utilisons la variation de l'allocation du portefeuille car il s'agit de l'indicateur le plus significatif. Les changements peuvent être dus à des transactions ou à des variations de prix des actions.
| Titre | Actions (en millions) |
Valeur ($ en millions) |
% du portefeuille | ΔPortefeuille % |
|---|---|---|---|---|
| 0,00 | 0,03 | 2,3946 | 2,3946 | |
| 0,00 | 0,03 | 2,0872 | 2,0872 | |
| 0,00 | 0,03 | 2,0753 | 2,0753 | |
| 0,00 | 0,05 | 4,3596 | 1,9236 | |
| 0,00 | 0,01 | 1,1023 | 1,1023 | |
| 0,00 | 0,01 | 1,0375 | 1,0375 | |
| 0,00 | 0,01 | 0,8484 | 0,8484 | |
| 0,00 | 0,04 | 2,9633 | 0,8267 | |
| 0,00 | 0,02 | 1,3055 | 0,8227 | |
| 0,00 | 0,01 | 0,7781 | 0,7781 |
Principales baisses ce trimestre
Nous utilisons la variation de l'allocation du portefeuille car il s'agit de l'indicateur le plus significatif. Les changements peuvent être dus à des transactions ou à des variations de prix des actions.
| Titre | Actions (en millions) |
Valeur ($ en millions) |
% du portefeuille | ΔPortefeuille % |
|---|---|---|---|---|
| 0,00 | 0,03 | 2,3354 | -2,5167 | |
| 0,00 | 0,02 | 1,5179 | -1,0255 | |
| 0,00 | 0,03 | 2,4473 | -0,5765 | |
| 0,00 | 0,02 | 1,2505 | -0,5432 | |
| 0,00 | 0,01 | 0,5015 | -0,5425 | |
| 0,00 | 0,01 | 0,8803 | -0,5157 | |
| 0,00 | 0,01 | 0,5696 | -0,4465 | |
| 0,00 | 0,01 | 0,8413 | -0,4209 | |
| 0,00 | 0,01 | 0,8032 | -0,3279 | |
| 0,00 | 0,01 | 0,8041 | -0,2469 |
Déclarations 13F et dépôts de fonds
Ce formulaire a été déposé le 2025-08-26 pour la période de déclaration 2025-06-30. Cliquez sur l'icône du lien pour voir l'historique complet des transactions.
Mettre à niveau pour débloquer les données premium et exporter vers Excel ![]() .
.
| Titre | Type | Prix moyen de l'action | Actions (en millions) |
ΔActions (%) |
ΔActions (%) |
Valeur ($ en millions) |
Portefeuille (%) |
ΔPortefeuille (%) |
|
|---|---|---|---|---|---|---|---|---|---|
| SWKS / Skyworks Solutions, Inc. | 0,00 | 65,75 | 0,05 | 92,86 | 4,3596 | 1,9236 | |||
| JBL / Jabil Inc. | 0,00 | -18,94 | 0,04 | 33,33 | 3,2337 | 0,5758 | |||
| SYF / Synchrony Financial | 0,00 | 17,48 | 0,04 | 50,00 | 2,9633 | 0,8267 | |||
| HPE / Hewlett Packard Enterprise Company | 0,00 | -5,85 | 0,03 | 24,00 | 2,5196 | 0,3633 | |||
| HPQ / HP Inc. | 0,00 | 28,95 | 0,03 | 14,81 | 2,5111 | 0,1569 | |||
| GEN / Gen Digital Inc. | 0,00 | -21,98 | 0,03 | -14,29 | 2,4473 | -0,5765 | |||
| ON / ON Semiconductor Corporation | 0,00 | 0,03 | 2,3946 | 2,3946 | |||||
| WBD / Warner Bros. Discovery, Inc. | 0,00 | -51,87 | 0,03 | -50,00 | 2,3354 | -2,5167 | |||
| MTCH / Match Group, Inc. | 0,00 | 31,49 | 0,03 | 28,57 | 2,2552 | 0,4053 | |||
| NTAP / NetApp, Inc. | 0,00 | 34,38 | 0,03 | 68,75 | 2,2152 | 0,7639 | |||
| QCOM / QUALCOMM Incorporated | 0,00 | 1,79 | 0,03 | 8,00 | 2,1945 | -0,0262 | |||
| ZBRA / Zebra Technologies Corporation | 0,00 | 0,03 | 2,0872 | 2,0872 | |||||
| OMC / Omnicom Group Inc. | 0,00 | 0,03 | 2,0753 | 2,0753 | |||||
| TE Connectivity PLC / EC (IE000IVNQZ81) | 0,00 | -16,20 | 0,03 | 0,00 | 2,0387 | -0,1380 | |||
| IPG / The Interpublic Group of Companies, Inc. | 0,00 | 41,25 | 0,02 | 26,32 | 2,0062 | 0,3234 | |||
| NRG / NRG Energy, Inc. | 0,00 | -25,00 | 0,02 | 26,32 | 1,9798 | 0,3040 | |||
| EPAM / EPAM Systems, Inc. | 0,00 | 0,00 | 0,02 | 4,76 | 1,8238 | -0,0359 | |||
| COF / Capital One Financial Corporation | 0,00 | -16,96 | 0,02 | -5,00 | 1,5944 | -0,1336 | |||
| FFIV / F5, Inc. | 0,00 | -42,34 | 0,02 | -37,93 | 1,5179 | -1,0255 | |||
| AKAM / Akamai Technologies, Inc. | 0,00 | 10,66 | 0,02 | 13,33 | 1,4011 | 0,0365 | |||
| BIIB / Biogen Inc. | 0,00 | 214,63 | 0,02 | 220,00 | 1,3055 | 0,8227 | |||
| EXPE / Expedia Group, Inc. | 0,00 | -25,81 | 0,02 | -25,00 | 1,2505 | -0,5432 | |||
| MET / MetLife, Inc. | 0,00 | 31,88 | 0,01 | 27,27 | 1,1794 | 0,2260 | |||
| RL / Ralph Lauren Corporation | 0,00 | -20,31 | 0,01 | -7,14 | 1,1272 | -0,0885 | |||
| PRU / Prudential Financial, Inc. | 0,00 | 58,54 | 0,01 | 44,44 | 1,1255 | 0,3375 | |||
| VTRS / Viatris Inc. | 0,00 | 64,70 | 0,01 | 62,50 | 1,1046 | 0,4060 | |||
| ENPH / Enphase Energy, Inc. | 0,00 | 0,01 | 1,1023 | 1,1023 | |||||
| Aptiv PLC / EC (JE00BTDN8H13) | 0,00 | 43,07 | 0,01 | 62,50 | 1,0775 | 0,3760 | |||
| DLTR / Dollar Tree, Inc. | 0,00 | 0,01 | 1,0375 | 1,0375 | |||||
| BBY / Best Buy Co., Inc. | 0,00 | 84,47 | 0,01 | 71,43 | 1,0278 | 0,3754 | |||
| HOLX / Hologic, Inc. | 0,00 | 56,52 | 0,01 | 57,14 | 0,9451 | 0,3339 | |||
| IVZ / Invesco Ltd. | 0,00 | 36,65 | 0,01 | 37,50 | 0,9429 | 0,2341 | |||
| CI / The Cigna Group | 0,00 | 6,25 | 0,01 | 10,00 | 0,9057 | -0,0002 | |||
| C / Citigroup Inc. | 0,00 | -5,04 | 0,01 | 37,50 | 0,9054 | 0,1582 | |||
| UAL / United Airlines Holdings, Inc. | 0,00 | 27,78 | 0,01 | 100,00 | 0,8855 | 0,4459 | |||
| LEN / Lennar Corporation | 0,00 | 1,02 | 0,01 | -9,09 | 0,8824 | -0,0855 | |||
| BMY / Bristol-Myers Squibb Company | 0,00 | -11,28 | 0,01 | -37,50 | 0,8803 | -0,5157 | |||
| ABNB / Airbnb, Inc. | 0,00 | 2,50 | 0,01 | 11,11 | 0,8745 | 0,0521 | |||
| VLO / Valero Energy Corporation | 0,00 | 0,00 | 0,01 | 0,00 | 0,8665 | -0,0426 | |||
| MRK / Merck & Co., Inc. | 0,00 | 0,01 | 0,8484 | 0,8484 | |||||
| PHM / PulteGroup, Inc. | 0,00 | -8,33 | 0,01 | -33,33 | 0,8413 | -0,4209 | |||
| TFC / Truist Financial Corporation | 0,00 | 18,59 | 0,01 | 25,00 | 0,8175 | 0,1129 | |||
| TGT / Target Corporation | 0,00 | 88,89 | 0,01 | 100,00 | 0,8108 | 0,3259 | |||
| GILD / Gilead Sciences, Inc. | 0,00 | -17,43 | 0,01 | -25,00 | 0,8041 | -0,2469 | |||
| MO / Altria Group, Inc. | 0,00 | -22,37 | 0,01 | -30,77 | 0,8032 | -0,3279 | |||
| MHK / Mohawk Industries, Inc. | 0,00 | 58,33 | 0,01 | 50,00 | 0,8026 | 0,2131 | |||
| CFG / Citizens Financial Group, Inc. | 0,00 | 10,61 | 0,01 | 12,50 | 0,7897 | 0,0917 | |||
| ALGN / Align Technology, Inc. | 0,00 | 0,01 | 0,7781 | 0,7781 | |||||
| USB / U.S. Bancorp | 0,00 | 24,56 | 0,01 | 28,57 | 0,7767 | 0,1269 | |||
| MPC / Marathon Petroleum Corporation | 0,00 | 5,45 | 0,01 | 12,50 | 0,7763 | 0,0868 | |||
| GNRC / Generac Holdings Inc. | 0,00 | 78,38 | 0,01 | 125,00 | 0,7616 | 0,3584 | |||
| UHS / Universal Health Services, Inc. | 0,00 | 0,01 | 0,7591 | 0,7591 | |||||
| HBAN / Huntington Bancshares Incorporated | 0,00 | 31,01 | 0,01 | 50,00 | 0,7360 | 0,1987 | |||
| VST / Vistra Corp. | 0,00 | 11,90 | 0,01 | 125,00 | 0,7340 | 0,3096 | |||
| WFC / Wells Fargo & Company | 0,00 | -23,65 | 0,01 | -10,00 | 0,7295 | -0,1847 | |||
| DHI / D.R. Horton, Inc. | 0,00 | 27,27 | 0,01 | -10,00 | 0,7272 | -0,1271 | |||
| BAC / Bank of America Corporation | 0,00 | 0,01 | 0,7092 | 0,7092 | |||||
| EOG / EOG Resources, Inc. | 0,00 | 0,01 | 0,6940 | 0,6940 | |||||
| RF / Regions Financial Corporation | 0,00 | 0,01 | 0,6899 | 0,6899 | |||||
| CF / CF Industries Holdings, Inc. | 0,00 | 121,95 | 0,01 | 166,67 | 0,6746 | 0,3882 | |||
| HAL / Halliburton Company | 0,00 | 102,01 | 0,01 | 60,00 | 0,6602 | 0,2257 | |||
| DECK / Deckers Outdoor Corporation | 0,00 | 0,01 | 0,6561 | 0,6561 | |||||
| MTB / M&T Bank Corporation | 0,00 | -18,00 | 0,01 | -12,50 | 0,6409 | -0,0843 | |||
| REGN / Regeneron Pharmaceuticals, Inc. | 0,00 | 0,01 | 0,6346 | 0,6346 | |||||
| DVA / DaVita Inc. | 0,00 | 1,92 | 0,01 | 0,00 | 0,6084 | -0,0761 | |||
| BLDR / Builders FirstSource, Inc. | 0,00 | 52,38 | 0,01 | 40,00 | 0,6018 | 0,1502 | |||
| NVR / NVR, Inc. | 0,00 | 0,00 | 0,01 | -22,22 | 0,5951 | -0,2038 | |||
| CAG / Conagra Brands, Inc. | 0,00 | 18,92 | 0,01 | 0,00 | 0,5806 | -0,0987 | |||
| DAL / Delta Air Lines, Inc. | 0,00 | 0,01 | 0,5707 | 0,5707 | |||||
| TAP / Molson Coors Beverage Company | 0,00 | -24,23 | 0,01 | -36,36 | 0,5696 | -0,4465 | |||
| HUM / Humana Inc. | 0,00 | 3,70 | 0,01 | -25,00 | 0,5516 | -0,1447 | |||
| HSY / The Hershey Company | 0,00 | 0,01 | 0,5349 | 0,5349 | |||||
| SLB / Schlumberger Limited | 0,00 | 0,01 | 0,5175 | 0,5175 | |||||
| KHC / The Kraft Heinz Company | 0,00 | 0,01 | 0,5118 | 0,5118 | |||||
| SNA / Snap-on Incorporated | 0,00 | -44,44 | 0,01 | -50,00 | 0,5015 | -0,5425 | |||
| CAT / Caterpillar Inc. | 0,00 | 0,00 | 0,01 | 20,00 | 0,5005 | 0,0464 | |||
| GIS / General Mills, Inc. | 0,00 | 21,43 | 0,01 | 20,00 | 0,4968 | -0,0074 | |||
| LDOS / Leidos Holdings, Inc. | 0,00 | -9,30 | 0,01 | 20,00 | 0,4958 | -0,0035 | |||
| EMR / Emerson Electric Co. | 0,00 | 0,01 | 0,4942 | 0,4942 | |||||
| UBER / Uber Technologies, Inc. | 0,00 | 0,01 | 0,4887 | 0,4887 | |||||
| WAB / Westinghouse Air Brake Technologies Corporation | 0,00 | -12,50 | 0,01 | 0,00 | 0,4723 | -0,0270 | |||
| UPS / United Parcel Service, Inc. | 0,00 | 0,01 | 0,4718 | 0,4718 | |||||
| MAS / Masco Corporation | 0,00 | 5,00 | 0,01 | 0,00 | 0,4356 | -0,0431 | |||
| AOS / A. O. Smith Corporation | 0,00 | 49,09 | 0,01 | 25,00 | 0,4333 | 0,0310 | |||
| PCAR / PACCAR Inc | 0,00 | -17,91 | 0,01 | -16,67 | 0,4213 | -0,1401 | |||
| SWK / Stanley Black & Decker, Inc. | 0,00 | 24,56 | 0,00 | 0,00 | 0,3876 | 0,0105 | |||
| NEE / NextEra Energy, Inc. | 0,00 | 7,81 | 0,00 | 0,00 | 0,3860 | -0,0044 | |||
| BXP / Boston Properties, Inc. | 0,00 | 15,25 | 0,00 | 33,33 | 0,3697 | 0,0286 | |||
| HST / Host Hotels & Resorts, Inc. | 0,00 | 12,20 | 0,00 | 33,33 | 0,3528 | 0,0422 | |||
| ARE / Alexandria Real Estate Equities, Inc. | 0,00 | 40,48 | 0,00 | 33,33 | 0,3453 | 0,0110 | |||
| FTV / Fortive Corporation | 0,00 | 3,90 | 0,00 | -20,00 | 0,3361 | -0,1488 | |||
| LYB / LyondellBasell Industries N.V. | 0,00 | 18,64 | 0,00 | 0,00 | 0,3264 | -0,0311 | |||
| NEM / Newmont Corporation | 0,00 | 0,00 | 0,3005 | 0,3005 | |||||
| SPG / Simon Property Group, Inc. | 0,00 | -22,22 | 0,00 | -25,00 | 0,2720 | -0,1138 | |||
| VICI / VICI Properties Inc. | 0,00 | -19,84 | 0,00 | -25,00 | 0,2653 | -0,0884 | |||
| O / Realty Income Corporation | 0,00 | 0,00 | 0,00 | 0,00 | 0,2600 | -0,0196 | |||
| DD / DuPont de Nemours, Inc. | 0,00 | 0,00 | 0,2542 | 0,2542 | |||||
| WEC / WEC Energy Group, Inc. | 0,00 | -16,67 | 0,00 | 0,00 | 0,2519 | -0,0857 | |||
| AVY / Avery Dennison Corporation | 0,00 | 0,00 | 0,2404 | 0,2404 | |||||
| EMN / Eastman Chemical Company | 0,00 | 0,00 | 0,2346 | 0,2346 | |||||
| DOC / Healthpeak Properties, Inc. | 0,00 | 8,90 | 0,00 | 0,00 | 0,2243 | -0,0297 | |||
| RAL / Ralliant Corporation | 0,00 | 0,00 | 0,1042 | 0,1042 | |||||
| DGCXX / Dreyfus Government Cash Management Funds - Dreyfus Government Cash Management Fund Institutional Shares | 0,00 | -64,13 | 0,00 | -50,00 | 0,0866 | -0,1710 |