Statistiques de base
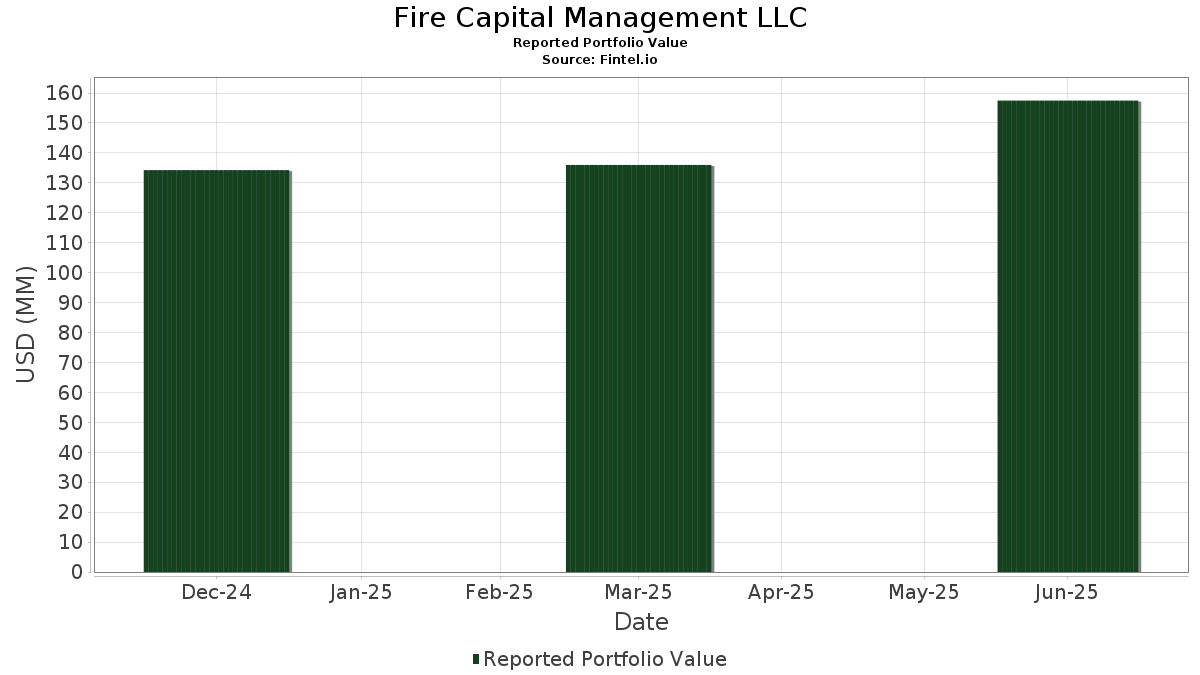
| Valeur du portefeuille | $ 157 483 258 |
| Positions actuelles | 93 |
Dernières positions, performances, ASG (à partir des dépôts 13F, 13D)
Fire Capital Management LLC a déclaré un total de 93 positions dans ses derniers dépôts auprès de la SEC. La valeur la plus récente du portefeuille est calculée à 157 483 258 USD. Les actifs sous gestion réels (ASG) sont cette valeur plus les liquidités (qui ne sont pas divulguées). Les principales positions de Fire Capital Management LLC sont NVIDIA Corporation (US:NVDA) , iShares Trust - iShares Russell 1000 ETF (US:IWB) , Microsoft Corporation (US:MSFT) , Invesco Exchange-Traded Fund Trust - Invesco S&P 500 Equal Weight ETF (US:RSP) , and SPDR S&P 500 ETF (US:SPY) . Les nouvelles positions de Fire Capital Management LLC incluent Vanguard Scottsdale Funds - Vanguard Russell 2000 ETF (US:VTWO) , SPDR Series Trust - SPDR Portfolio Long Term Treasury ETF (MX:SPTL) , HCA Healthcare, Inc. (US:HCA) , Celsius Holdings, Inc. (US:CELH) , and Taiwan Semiconductor Manufacturing Company Limited - Depositary Receipt (Common Stock) (US:TSM) .
Meilleures augmentations ce trimestre
Nous utilisons la variation de l'allocation du portefeuille car il s'agit de l'indicateur le plus significatif. Les changements peuvent être dus à des transactions ou à des variations de prix des actions.
| Titre | Actions (en millions) |
Valeur ($ en millions) |
% du portefeuille | ΔPortefeuille % |
|---|---|---|---|---|
| 0,11 | 17,36 | 11,0224 | 2,1721 | |
| 0,03 | 2,41 | 1,5312 | 1,5312 | |
| 0,05 | 1,38 | 0,8779 | 0,8779 | |
| 0,01 | 6,78 | 4,3044 | 0,5677 | |
| 0,03 | 6,24 | 3,9644 | 0,5577 | |
| 0,06 | 3,11 | 1,9767 | 0,5574 | |
| 0,05 | 3,22 | 2,0439 | 0,5558 | |
| 0,01 | 1,72 | 1,0897 | 0,4022 | |
| 0,01 | 2,04 | 1,2930 | 0,3658 | |
| 0,00 | 0,57 | 0,3612 | 0,3612 |
Principales baisses ce trimestre
Nous utilisons la variation de l'allocation du portefeuille car il s'agit de l'indicateur le plus significatif. Les changements peuvent être dus à des transactions ou à des variations de prix des actions.
| Titre | Actions (en millions) |
Valeur ($ en millions) |
% du portefeuille | ΔPortefeuille % |
|---|---|---|---|---|
| 0,02 | 3,44 | 2,1846 | -1,4589 | |
| 0,01 | 2,60 | 1,6487 | -0,8859 | |
| 0,01 | 3,86 | 2,4523 | -0,7427 | |
| 0,01 | 6,15 | 3,9048 | -0,5054 | |
| 0,04 | 2,28 | 1,4493 | -0,4868 | |
| 0,02 | 1,97 | 1,2513 | -0,3475 | |
| 0,01 | 1,81 | 1,1484 | -0,2743 | |
| 0,00 | 1,10 | 0,6954 | -0,2300 | |
| 0,03 | 9,91 | 6,2947 | -0,1885 | |
| 0,01 | 1,35 | 0,8578 | -0,1662 |
Déclarations 13F et dépôts de fonds
Ce formulaire a été déposé le 2025-08-01 pour la période de déclaration 2025-06-30. Cliquez sur l'icône du lien pour voir l'historique complet des transactions.
Mettre à niveau pour débloquer les données premium et exporter vers Excel ![]() .
.
| Titre | Type | Prix moyen de l'action | Actions (en millions) |
ΔActions (%) |
ΔActions (%) |
Valeur ($ en millions) |
Portefeuille (%) |
ΔPortefeuille (%) |
|
|---|---|---|---|---|---|---|---|---|---|
| NVDA / NVIDIA Corporation | 0,11 | -1,06 | 17,36 | 44,24 | 11,0224 | 2,1721 | |||
| IWB / iShares Trust - iShares Russell 1000 ETF | 0,03 | 1,57 | 9,91 | 12,44 | 6,2947 | -0,1885 | |||
| MSFT / Microsoft Corporation | 0,01 | 0,68 | 6,78 | 33,40 | 4,3044 | 0,5677 | |||
| RSP / Invesco Exchange-Traded Fund Trust - Invesco S&P 500 Equal Weight ETF | 0,03 | 28,46 | 6,24 | 34,78 | 3,9644 | 0,5577 | |||
| SPY / SPDR S&P 500 ETF | 0,01 | -7,16 | 6,15 | 2,53 | 3,9048 | -0,5054 | |||
| JPM / JPMorgan Chase & Co. | 0,02 | 0,15 | 6,08 | 18,36 | 3,8596 | 0,0833 | |||
| TSLA / Tesla, Inc. | 0,01 | -4,16 | 4,24 | 17,48 | 2,6924 | 0,0382 | |||
| BEN / Franklin Resources, Inc. | 0,17 | 0,00 | 4,11 | 23,91 | 2,6099 | 0,1703 | |||
| GLD / SPDR Gold Trust | 0,01 | -15,98 | 3,86 | -11,12 | 2,4523 | -0,7427 | |||
| AMZN / Amazon.com, Inc. | 0,02 | 2,46 | 3,68 | 18,17 | 2,3336 | 0,0461 | |||
| IWM / iShares Trust - iShares Russell 2000 ETF | 0,02 | -35,81 | 3,44 | -30,56 | 2,1846 | -1,4589 | |||
| VXUS / Vanguard STAR Funds - Vanguard Total International Stock ETF | 0,05 | 42,97 | 3,22 | 59,07 | 2,0439 | 0,5558 | |||
| VWO / Vanguard International Equity Index Funds - Vanguard FTSE Emerging Markets ETF | 0,06 | 47,60 | 3,11 | 61,33 | 1,9767 | 0,5574 | |||
| AXP / American Express Company | 0,01 | -0,56 | 3,01 | 17,92 | 1,9094 | 0,0338 | |||
| DE / Deere & Company | 0,01 | 0,12 | 2,89 | 8,47 | 1,8379 | -0,1243 | |||
| AAPL / Apple Inc. | 0,01 | -18,44 | 2,60 | -24,67 | 1,6487 | -0,8859 | |||
| VTWO / Vanguard Scottsdale Funds - Vanguard Russell 2000 ETF | 0,03 | 2,41 | 1,5312 | 1,5312 | |||||
| IEFA / iShares Trust - iShares Core MSCI EAFE ETF | 0,03 | 1,69 | 2,37 | 12,23 | 1,5037 | -0,0482 | |||
| IGSB / iShares Trust - iShares 1-5 Year Investment Grade Corporate Bond ETF | 0,04 | -13,95 | 2,28 | -13,30 | 1,4493 | -0,4868 | |||
| AVGO / Broadcom Inc. | 0,01 | -1,90 | 2,04 | 61,59 | 1,2930 | 0,3658 | |||
| PM / Philip Morris International Inc. | 0,01 | 0,00 | 1,99 | 14,74 | 1,2606 | -0,0117 | |||
| XOM / Exxon Mobil Corporation | 0,02 | 0,00 | 1,97 | -9,38 | 1,2513 | -0,3475 | |||
| WMT / Walmart Inc. | 0,02 | -3,25 | 1,85 | 7,81 | 1,1742 | -0,0877 | |||
| ZTS / Zoetis Inc. | 0,01 | -1,30 | 1,81 | -6,51 | 1,1484 | -0,2743 | |||
| ORCL / Oracle Corporation | 0,01 | 17,39 | 1,72 | 83,73 | 1,0897 | 0,4022 | |||
| ISRG / Intuitive Surgical, Inc. | 0,00 | -1,44 | 1,71 | 8,19 | 1,0828 | -0,0769 | |||
| CAT / Caterpillar Inc. | 0,00 | 8,12 | 1,70 | 27,33 | 1,0770 | 0,0969 | |||
| DIS / The Walt Disney Company | 0,01 | -5,22 | 1,51 | 19,04 | 0,9612 | 0,0264 | |||
| MDLZ / Mondelez International, Inc. | 0,02 | -0,87 | 1,48 | -1,46 | 0,9422 | -0,1652 | |||
| SPTL / SPDR Series Trust - SPDR Portfolio Long Term Treasury ETF | 0,05 | 1,38 | 0,8779 | 0,8779 | |||||
| COST / Costco Wholesale Corporation | 0,00 | 3,04 | 1,38 | 7,92 | 0,8744 | -0,0646 | |||
| CL / Colgate-Palmolive Company | 0,01 | 0,00 | 1,35 | -3,02 | 0,8578 | -0,1662 | |||
| CRM / Salesforce, Inc. | 0,00 | 7,80 | 1,27 | 9,55 | 0,8085 | -0,0463 | |||
| ADBE / Adobe Inc. | 0,00 | 1,30 | 1,27 | 2,18 | 0,8050 | -0,1074 | |||
| V / Visa Inc. | 0,00 | 0,74 | 1,27 | 2,10 | 0,8033 | -0,1083 | |||
| LNG / Cheniere Energy, Inc. | 0,01 | 0,28 | 1,23 | 5,57 | 0,7820 | -0,0762 | |||
| UNP / Union Pacific Corporation | 0,01 | 3,60 | 1,21 | 0,92 | 0,7701 | -0,1138 | |||
| LLY / Eli Lilly and Company | 0,00 | 12,83 | 1,18 | 6,50 | 0,7489 | -0,0655 | |||
| BRK.B / Berkshire Hathaway Inc. | 0,00 | 93,41 | 1,15 | 76,45 | 0,7332 | 0,2519 | |||
| ANET / Arista Networks Inc | 0,01 | -3,92 | 1,14 | 26,89 | 0,7254 | 0,0633 | |||
| VXF / Vanguard Index Funds - Vanguard Extended Market ETF | 0,01 | 0,00 | 1,12 | 11,89 | 0,7115 | -0,0251 | |||
| TMO / Thermo Fisher Scientific Inc. | 0,00 | 6,80 | 1,10 | -12,96 | 0,6954 | -0,2300 | |||
| BLK / BlackRock, Inc. | 0,00 | -3,79 | 1,09 | 6,63 | 0,6942 | -0,0596 | |||
| CASY / Casey's General Stores, Inc. | 0,00 | 17,24 | 1,04 | 37,91 | 0,6633 | 0,1060 | |||
| ROK / Rockwell Automation, Inc. | 0,00 | 4,67 | 1,01 | 34,54 | 0,6387 | 0,0890 | |||
| JMBS / Janus Detroit Street Trust - Janus Henderson Mortgage-Backed Securities ETF | 0,02 | 11,76 | 0,99 | 11,29 | 0,6267 | -0,0249 | |||
| PFE / Pfizer Inc. | 0,04 | 0,00 | 0,93 | -4,32 | 0,5905 | -0,1244 | |||
| NFLX / Netflix, Inc. | 0,00 | -5,83 | 0,91 | 35,27 | 0,5774 | 0,0829 | |||
| GS / The Goldman Sachs Group, Inc. | 0,00 | -3,88 | 0,89 | 24,55 | 0,5672 | 0,0397 | |||
| HD / The Home Depot, Inc. | 0,00 | 0,00 | 0,88 | 0,11 | 0,5583 | -0,0880 | |||
| META / Meta Platforms, Inc. | 0,00 | -25,83 | 0,88 | -4,98 | 0,5573 | -0,1222 | |||
| NEE / NextEra Energy, Inc. | 0,01 | -1,25 | 0,85 | -3,29 | 0,5411 | -0,1070 | |||
| CTVA / Corteva, Inc. | 0,01 | 0,73 | 0,85 | 19,41 | 0,5392 | 0,0158 | |||
| AMT / American Tower Corporation | 0,00 | 2,94 | 0,84 | 4,63 | 0,5315 | -0,0572 | |||
| CEG / Constellation Energy Corporation | 0,00 | -4,90 | 0,78 | 52,33 | 0,4972 | 0,1190 | |||
| DHR / Danaher Corporation | 0,00 | 4,63 | 0,78 | 0,78 | 0,4936 | -0,0734 | |||
| VOO / Vanguard Index Funds - Vanguard S&P 500 ETF | 0,00 | 144,55 | 0,76 | 170,92 | 0,4855 | 0,2776 | |||
| WM / Waste Management, Inc. | 0,00 | 0,25 | 0,73 | -0,95 | 0,4651 | -0,0785 | |||
| OTIS / Otis Worldwide Corporation | 0,01 | 0,00 | 0,73 | -4,09 | 0,4619 | -0,0956 | |||
| APD / Air Products and Chemicals, Inc. | 0,00 | 1,60 | 0,72 | -2,85 | 0,4546 | -0,0872 | |||
| RTX / RTX Corporation | 0,00 | 0,00 | 0,69 | 10,35 | 0,4401 | -0,0223 | |||
| AWK / American Water Works Company, Inc. | 0,00 | -0,91 | 0,68 | -6,60 | 0,4315 | -0,1033 | |||
| MCD / McDonald's Corporation | 0,00 | 4,79 | 0,66 | -2,06 | 0,4221 | -0,0766 | |||
| ROP / Roper Technologies, Inc. | 0,00 | 37,59 | 0,66 | 32,33 | 0,4190 | 0,0522 | |||
| CRWD / CrowdStrike Holdings, Inc. | 0,00 | -18,58 | 0,62 | 17,65 | 0,3939 | 0,0060 | |||
| AMP / Ameriprise Financial, Inc. | 0,00 | 0,00 | 0,61 | 10,25 | 0,3897 | -0,0197 | |||
| MCK / McKesson Corporation | 0,00 | -4,24 | 0,60 | 4,20 | 0,3788 | -0,0419 | |||
| CVX / Chevron Corporation | 0,00 | 0,00 | 0,58 | -14,35 | 0,3678 | -0,1298 | |||
| MA / Mastercard Incorporated | 0,00 | 0,00 | 0,57 | 2,52 | 0,3618 | -0,0469 | |||
| HCA / HCA Healthcare, Inc. | 0,00 | 0,57 | 0,3612 | 0,3612 | |||||
| CELH / Celsius Holdings, Inc. | 0,01 | 0,56 | 0,3541 | 0,3541 | |||||
| AEP / American Electric Power Company, Inc. | 0,01 | 0,12 | 0,53 | -5,00 | 0,3381 | -0,0738 | |||
| BAC / Bank of America Corporation | 0,01 | 9,27 | 0,51 | 23,96 | 0,3223 | 0,0211 | |||
| GOOG / Alphabet Inc. | 0,00 | 4,32 | 0,45 | 18,47 | 0,2853 | 0,0064 | |||
| IBIT / iShares Bitcoin Trust ETF | 0,01 | 0,00 | 0,44 | 30,59 | 0,2825 | 0,0323 | |||
| HON / Honeywell International Inc. | 0,00 | 0,00 | 0,44 | 9,98 | 0,2805 | -0,0149 | |||
| AVAV / AeroVironment, Inc. | 0,00 | 0,38 | 0,2444 | 0,2444 | |||||
| NSC / Norfolk Southern Corporation | 0,00 | 0,00 | 0,38 | 7,89 | 0,2438 | -0,0175 | |||
| CSCO / Cisco Systems, Inc. | 0,01 | 0,00 | 0,38 | 12,46 | 0,2409 | -0,0072 | |||
| ADI / Analog Devices, Inc. | 0,00 | -10,75 | 0,35 | 5,41 | 0,2234 | -0,0222 | |||
| CARR / Carrier Global Corporation | 0,00 | 0,00 | 0,34 | 15,49 | 0,2181 | -0,0007 | |||
| AZO / AutoZone, Inc. | 0,00 | 0,00 | 0,33 | -2,62 | 0,2122 | -0,0402 | |||
| CMG / Chipotle Mexican Grill, Inc. | 0,01 | -17,19 | 0,32 | -7,45 | 0,2055 | -0,0515 | |||
| TJX / The TJX Companies, Inc. | 0,00 | 0,00 | 0,31 | 1,30 | 0,1978 | -0,0281 | |||
| PANW / Palo Alto Networks, Inc. | 0,00 | 1,34 | 0,31 | 21,65 | 0,1963 | 0,0092 | |||
| TMUS / T-Mobile US, Inc. | 0,00 | 0,00 | 0,29 | -10,70 | 0,1858 | -0,0551 | |||
| BKNG / Booking Holdings Inc. | 0,00 | 0,00 | 0,29 | 25,65 | 0,1838 | 0,0144 | |||
| TXN / Texas Instruments Incorporated | 0,00 | 0,00 | 0,27 | 15,68 | 0,1735 | -0,0004 | |||
| ELV / Elevance Health, Inc. | 0,00 | 0,00 | 0,24 | -10,33 | 0,1544 | -0,0455 | |||
| GOOGL / Alphabet Inc. | 0,00 | -33,57 | 0,23 | -24,26 | 0,1468 | -0,0778 | |||
| TSM / Taiwan Semiconductor Manufacturing Company Limited - Depositary Receipt (Common Stock) | 0,00 | 0,23 | 0,1438 | 0,1438 | |||||
| PH / Parker-Hannifin Corporation | 0,00 | 0,21 | 0,1331 | 0,1331 | |||||
| BK / The Bank of New York Mellon Corporation | 0,00 | 0,20 | 0,1273 | 0,1273 | |||||
| UNH / UnitedHealth Group Incorporated | 0,00 | -100,00 | 0,00 | 0,0000 | |||||
| MINV / Matthews International Funds - Matthews Asia Innovators Active ETF | 0,00 | -100,00 | 0,00 | 0,0000 | |||||
| BYON / Beyond, Inc. | 0,00 | -100,00 | 0,00 | 0,0000 | |||||
| CRDO / Credo Technology Group Holding Ltd | 0,00 | -100,00 | 0,00 | 0,0000 |