Statistiques de base
| Valeur du portefeuille | $ 215 422 889 |
| Positions actuelles | 141 |
Dernières positions, performances, ASG (à partir des dépôts 13F, 13D)
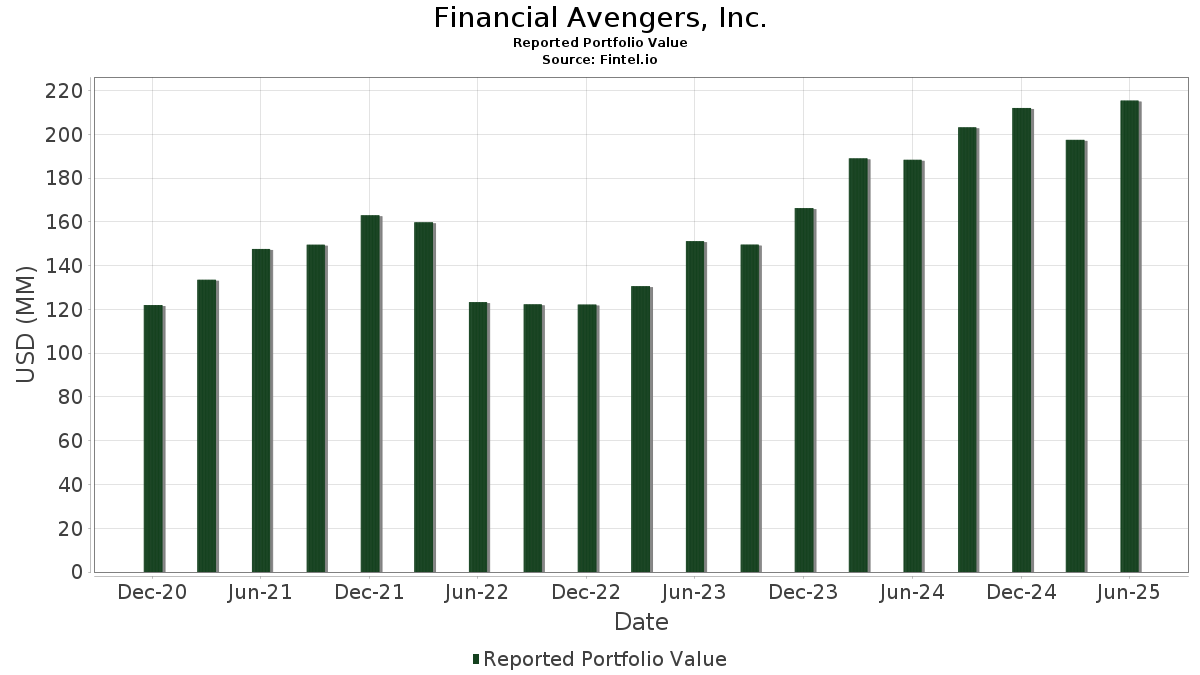
Financial Avengers, Inc. a déclaré un total de 141 positions dans ses derniers dépôts auprès de la SEC. La valeur la plus récente du portefeuille est calculée à 215 422 889 USD. Les actifs sous gestion réels (ASG) sont cette valeur plus les liquidités (qui ne sont pas divulguées). Les principales positions de Financial Avengers, Inc. sont NVIDIA Corporation (US:NVDA) , Amazon.com, Inc. (US:AMZN) , Apple Inc. (US:AAPL) , Berkshire Hathaway Inc. (US:BRK.B) , and Alphabet Inc. (US:GOOG) . Les nouvelles positions de Financial Avengers, Inc. incluent iShares Trust - iShares Russell 2000 Value ETF (US:IWN) , .
Meilleures augmentations ce trimestre
Nous utilisons la variation de l'allocation du portefeuille car il s'agit de l'indicateur le plus significatif. Les changements peuvent être dus à des transactions ou à des variations de prix des actions.
| Titre | Actions (en millions) |
Valeur ($ en millions) |
% du portefeuille | ΔPortefeuille % |
|---|---|---|---|---|
| 0,19 | 30,39 | 14,1078 | 3,4291 | |
| 0,02 | 8,06 | 3,7407 | 0,6694 | |
| 0,04 | 12,88 | 5,9812 | 0,4701 | |
| 0,12 | 26,25 | 12,1843 | 0,4629 | |
| 0,15 | 14,10 | 6,5454 | 0,3594 | |
| 0,05 | 6,38 | 2,9594 | 0,3116 | |
| 0,09 | 15,47 | 7,1835 | 0,2431 | |
| 0,05 | 5,24 | 2,4347 | 0,2313 | |
| 0,04 | 2,64 | 1,2236 | 0,1872 | |
| 0,06 | 3,31 | 1,5345 | 0,1216 |
Principales baisses ce trimestre
Nous utilisons la variation de l'allocation du portefeuille car il s'agit de l'indicateur le plus significatif. Les changements peuvent être dus à des transactions ou à des variations de prix des actions.
| Titre | Actions (en millions) |
Valeur ($ en millions) |
% du portefeuille | ΔPortefeuille % |
|---|---|---|---|---|
| 0,09 | 19,46 | 9,0335 | -1,8658 | |
| 0,04 | 18,64 | 8,6534 | -1,7316 | |
| 0,01 | 0,09 | 0,0418 | -1,0558 | |
| 0,05 | 7,54 | 3,4989 | -0,5719 | |
| 0,04 | 6,05 | 2,8099 | -0,4646 | |
| 0,04 | 3,90 | 1,8114 | -0,2741 | |
| 0,09 | 4,03 | 1,8707 | -0,1927 | |
| 0,00 | 1,46 | 0,6766 | -0,1321 | |
| 0,10 | 2,13 | 0,9883 | -0,1265 | |
| 0,00 | 1,23 | 0,5716 | -0,0904 |
Déclarations 13F et dépôts de fonds
Ce formulaire a été déposé le 2025-08-13 pour la période de déclaration 2025-06-30. Cliquez sur l'icône du lien pour voir l'historique complet des transactions.
Mettre à niveau pour débloquer les données premium et exporter vers Excel ![]() .
.
| Titre | Type | Prix moyen de l'action | Actions (en millions) |
ΔActions (%) |
ΔActions (%) |
Valeur ($ en millions) |
Portefeuille (%) |
ΔPortefeuille (%) |
|
|---|---|---|---|---|---|---|---|---|---|
| NVDA / NVIDIA Corporation | 0,19 | -1,13 | 30,39 | 44,13 | 14,1078 | 3,4291 | |||
| AMZN / Amazon.com, Inc. | 0,12 | -1,66 | 26,25 | 13,40 | 12,1843 | 0,4629 | |||
| AAPL / Apple Inc. | 0,09 | -2,11 | 19,46 | -9,58 | 9,0335 | -1,8658 | |||
| BRK.B / Berkshire Hathaway Inc. | 0,04 | -0,34 | 18,64 | -9,09 | 8,6534 | -1,7316 | |||
| GOOG / Alphabet Inc. | 0,09 | -0,56 | 15,47 | 12,91 | 7,1835 | 0,2431 | |||
| SCHW / The Charles Schwab Corporation | 0,15 | -0,97 | 14,10 | 15,43 | 6,5454 | 0,3594 | |||
| AXP / American Express Company | 0,04 | -0,14 | 12,88 | 18,40 | 5,9812 | 0,4701 | |||
| BAC / Bank of America Corporation | 0,19 | -1,06 | 9,02 | 12,19 | 4,1860 | 0,1158 | |||
| MSFT / Microsoft Corporation | 0,02 | 0,28 | 8,06 | 32,88 | 3,7407 | 0,6694 | |||
| JNJ / Johnson & Johnson | 0,05 | 1,80 | 7,54 | -6,23 | 3,4989 | -0,5719 | |||
| DIS / The Walt Disney Company | 0,05 | -2,96 | 6,38 | 21,94 | 2,9594 | 0,3116 | |||
| PG / The Procter & Gamble Company | 0,04 | 0,14 | 6,05 | -6,37 | 2,8099 | -0,4646 | |||
| SHOP / Shopify Inc. | 0,05 | -0,22 | 5,24 | 20,52 | 2,4347 | 0,2313 | |||
| VZ / Verizon Communications Inc. | 0,09 | 3,68 | 4,03 | -1,08 | 1,8707 | -0,1927 | |||
| SBUX / Starbucks Corporation | 0,04 | 1,44 | 3,90 | -5,25 | 1,8114 | -0,2741 | |||
| USIG / iShares Trust - iShares Broad USD Investment Grade Corporate Bond ETF | 0,06 | 17,65 | 3,31 | 18,50 | 1,5345 | 0,1216 | |||
| ADBE / Adobe Inc. | 0,01 | 7,44 | 3,06 | 8,36 | 1,4209 | -0,0093 | |||
| BND / Vanguard Bond Index Funds - Vanguard Total Bond Market ETF | 0,04 | 28,48 | 2,64 | 28,84 | 1,2236 | 0,1872 | |||
| PFE / Pfizer Inc. | 0,09 | 19,30 | 2,18 | 14,11 | 1,0104 | 0,0445 | |||
| KVUE / Kenvue Inc. | 0,10 | 10,81 | 2,13 | -3,27 | 0,9883 | -0,1265 | |||
| TSLA / Tesla, Inc. | 0,01 | -14,53 | 1,87 | 4,71 | 0,8671 | -0,0359 | |||
| BRK.A / Berkshire Hathaway Inc. | 0,00 | 0,00 | 1,46 | -8,71 | 0,6766 | -0,1321 | |||
| MMM / 3M Company | 0,01 | 7,41 | 1,39 | 11,33 | 0,6433 | 0,0130 | |||
| GOOGL / Alphabet Inc. | 0,01 | -1,51 | 1,35 | 12,20 | 0,6279 | 0,0176 | |||
| LLY / Eli Lilly and Company | 0,00 | -0,19 | 1,23 | -5,81 | 0,5716 | -0,0904 | |||
| RYCEY / Rolls-Royce Holdings plc - Depositary Receipt (Common Stock) | 0,05 | -13,79 | 0,79 | 38,91 | 0,3665 | 0,0783 | |||
| META / Meta Platforms, Inc. | 0,00 | -10,57 | 0,69 | 14,55 | 0,3217 | 0,0152 | |||
| AMD / Advanced Micro Devices, Inc. | 0,00 | 0,00 | 0,53 | 38,02 | 0,2465 | 0,0518 | |||
| COST / Costco Wholesale Corporation | 0,00 | 0,33 | 0,30 | 4,83 | 0,1413 | -0,0058 | |||
| ADP / Automatic Data Processing, Inc. | 0,00 | 0,58 | 0,27 | 1,52 | 0,1242 | -0,0094 | |||
| V / Visa Inc. | 0,00 | 0,15 | 0,24 | 1,69 | 0,1121 | -0,0084 | |||
| JPM / JPMorgan Chase & Co. | 0,00 | 0,37 | 0,24 | 18,59 | 0,1100 | 0,0089 | |||
| GE / General Electric Company | 0,00 | 0,25 | 0,21 | 28,40 | 0,0970 | 0,0149 | |||
| T / AT&T Inc. | 0,01 | 0,72 | 0,20 | 3,06 | 0,0941 | -0,0055 | |||
| IBM / International Business Machines Corporation | 0,00 | 0,55 | 0,16 | 19,26 | 0,0751 | 0,0064 | |||
| NFLX / Netflix, Inc. | 0,00 | -25,81 | 0,15 | 6,94 | 0,0715 | -0,0017 | |||
| ACGL / Arch Capital Group Ltd. | 0,00 | 0,00 | 0,15 | -5,62 | 0,0704 | -0,0107 | |||
| GILD / Gilead Sciences, Inc. | 0,00 | 0,77 | 0,15 | 0,00 | 0,0674 | -0,0064 | |||
| CSCO / Cisco Systems, Inc. | 0,00 | -21,60 | 0,14 | -12,10 | 0,0644 | -0,0153 | |||
| NVEE / NV5 Global, Inc. | 0,01 | -40,00 | 0,14 | -28,12 | 0,0643 | -0,0333 | |||
| GEV / GE Vernova Inc. | 0,00 | 0,00 | 0,13 | 72,97 | 0,0597 | 0,0222 | |||
| FTNT / Fortinet, Inc. | 0,00 | 0,00 | 0,13 | 9,57 | 0,0589 | 0,0004 | |||
| HD / The Home Depot, Inc. | 0,00 | 0,63 | 0,12 | 0,86 | 0,0543 | -0,0045 | |||
| TXN / Texas Instruments Incorporated | 0,00 | 0,57 | 0,11 | 16,13 | 0,0506 | 0,0031 | |||
| UNH / UnitedHealth Group Incorporated | 0,00 | 0,92 | 0,10 | -40,00 | 0,0476 | -0,0389 | |||
| ABT / Abbott Laboratories | 0,00 | 0,42 | 0,10 | 3,16 | 0,0456 | -0,0027 | |||
| DBX / Dropbox, Inc. | 0,00 | 0,00 | 0,10 | 6,67 | 0,0450 | -0,0008 | |||
| F / Ford Motor Company | 0,01 | -96,16 | 0,09 | -95,85 | 0,0418 | -1,0558 | |||
| ADSK / Autodesk, Inc. | 0,00 | 0,00 | 0,09 | 19,44 | 0,0399 | 0,0031 | |||
| NKE / NIKE, Inc. | 0,00 | 0,63 | 0,08 | 12,86 | 0,0367 | 0,0012 | |||
| ISRG / Intuitive Surgical, Inc. | 0,00 | 0,00 | 0,07 | 10,17 | 0,0303 | 0,0002 | |||
| MCHP / Microchip Technology Incorporated | 0,00 | 0,65 | 0,07 | 47,73 | 0,0302 | 0,0077 | |||
| AVGO / Broadcom Inc. | 0,00 | -54,02 | 0,06 | -24,10 | 0,0293 | -0,0130 | |||
| VRTX / Vertex Pharmaceuticals Incorporated | 0,00 | 0,00 | 0,06 | -7,46 | 0,0289 | -0,0054 | |||
| AEP / American Electric Power Company, Inc. | 0,00 | -14,41 | 0,06 | -18,42 | 0,0289 | -0,0099 | |||
| KO / The Coca-Cola Company | 0,00 | 0,80 | 0,06 | 0,00 | 0,0288 | -0,0028 | |||
| IRM / Iron Mountain Incorporated | 0,00 | 1,01 | 0,06 | 19,61 | 0,0287 | 0,0027 | |||
| TMO / Thermo Fisher Scientific Inc. | 0,00 | 0,00 | 0,06 | -18,67 | 0,0284 | -0,0096 | |||
| CLX / The Clorox Company | 0,00 | 0,87 | 0,06 | -17,91 | 0,0259 | -0,0085 | |||
| WMT / Walmart Inc. | 0,00 | 0,53 | 0,06 | 12,24 | 0,0257 | 0,0007 | |||
| TAK / Takeda Pharmaceutical Company Limited - Depositary Receipt (Common Stock) | 0,00 | -16,12 | 0,05 | -13,56 | 0,0241 | -0,0060 | |||
| ED / Consolidated Edison, Inc. | 0,00 | 0,83 | 0,05 | -9,43 | 0,0225 | -0,0043 | |||
| LC / LendingClub Corporation | 0,00 | -20,00 | 0,05 | -5,88 | 0,0223 | -0,0038 | |||
| ASML / ASML Holding N.V. - Depositary Receipt (Common Stock) | 0,00 | 0,05 | 0,0223 | 0,0223 | |||||
| FSLR / First Solar, Inc. | 0,00 | -7,14 | 0,05 | 23,68 | 0,0220 | 0,0023 | |||
| TMFG / The RBB Fund, Inc. - Motley Fool Global Opportunities ETF | 0,00 | 0,00 | 0,05 | 11,90 | 0,0219 | 0,0001 | |||
| GLW / Corning Incorporated | 0,00 | -38,54 | 0,04 | -29,31 | 0,0193 | -0,0105 | |||
| PEP / PepsiCo, Inc. | 0,00 | 1,02 | 0,04 | -11,36 | 0,0182 | -0,0041 | |||
| EQR / Equity Residential | 0,00 | 1,11 | 0,04 | -5,26 | 0,0171 | -0,0025 | |||
| UL / Unilever PLC - Depositary Receipt (Common Stock) | 0,00 | 0,50 | 0,04 | 2,86 | 0,0170 | -0,0010 | |||
| DHR / Danaher Corporation | 0,00 | 0,54 | 0,04 | -2,70 | 0,0169 | -0,0022 | |||
| AHR / American Healthcare REIT, Inc. | 0,00 | 0,00 | 0,03 | 21,43 | 0,0158 | 0,0016 | |||
| SSNC / SS&C Technologies Holdings, Inc. | 0,00 | -20,55 | 0,03 | -21,43 | 0,0155 | -0,0059 | |||
| EBAY / eBay Inc. | 0,00 | 0,45 | 0,03 | 10,00 | 0,0154 | 0,0002 | |||
| JSTC / Tidal Trust I - Adasina Social Justice All Cap Global ETF | 0,00 | 0,46 | 0,03 | 11,11 | 0,0142 | 0,0001 | |||
| EVRG / Evergy, Inc. | 0,00 | 0,94 | 0,03 | 0,00 | 0,0137 | -0,0011 | |||
| VEEV / Veeva Systems Inc. | 0,00 | 0,00 | 0,03 | 21,74 | 0,0134 | 0,0016 | |||
| HSY / The Hershey Company | 0,00 | 0,60 | 0,03 | 0,00 | 0,0130 | -0,0015 | |||
| XLV / The Select Sector SPDR Trust - The Health Care Select Sector SPDR Fund | 0,00 | 0,49 | 0,03 | -10,00 | 0,0129 | -0,0023 | |||
| XLK / The Select Sector SPDR Trust - The Technology Select Sector SPDR Fund | 0,00 | 0,00 | 0,03 | 25,00 | 0,0119 | 0,0013 | |||
| UNP / Union Pacific Corporation | 0,00 | 0,91 | 0,03 | -3,85 | 0,0119 | -0,0013 | |||
| TGT / Target Corporation | 0,00 | 1,24 | 0,02 | -4,00 | 0,0112 | -0,0016 | |||
| TSM / Taiwan Semiconductor Manufacturing Company Limited - Depositary Receipt (Common Stock) | 0,00 | 0,00 | 0,02 | 35,29 | 0,0110 | 0,0022 | |||
| INTC / Intel Corporation | 0,00 | 0,00 | 0,02 | 0,00 | 0,0109 | -0,0012 | |||
| KMI / Kinder Morgan, Inc. | 0,00 | 1,15 | 0,02 | 4,55 | 0,0108 | -0,0005 | |||
| LEVI / Levi Strauss & Co. | 0,00 | 0,73 | 0,02 | 15,79 | 0,0107 | 0,0009 | |||
| USB / U.S. Bancorp | 0,00 | 1,31 | 0,02 | 5,26 | 0,0097 | -0,0000 | |||
| GLD / SPDR Gold Trust | 0,00 | 0,00 | 0,02 | 5,56 | 0,0092 | -0,0003 | |||
| CAT / Caterpillar Inc. | 0,00 | 0,00 | 0,02 | 18,75 | 0,0090 | 0,0007 | |||
| AMAT / Applied Materials, Inc. | 0,00 | 0,00 | 0,02 | 26,67 | 0,0088 | 0,0012 | |||
| PEBO / Peoples Bancorp Inc. | 0,00 | 1,32 | 0,02 | 0,00 | 0,0087 | -0,0004 | |||
| MDB / MongoDB, Inc. | 0,00 | 0,00 | 0,02 | 21,43 | 0,0083 | 0,0007 | |||
| GEHC / GE HealthCare Technologies Inc. | 0,00 | 0,00 | 0,02 | -5,56 | 0,0080 | -0,0015 | |||
| NI / NiSource Inc. | 0,00 | 0,74 | 0,02 | 0,00 | 0,0077 | -0,0006 | |||
| YUM / Yum! Brands, Inc. | 0,00 | 0,97 | 0,02 | -6,25 | 0,0071 | -0,0011 | |||
| GM / General Motors Company | 0,00 | 0,33 | 0,01 | 0,00 | 0,0069 | -0,0003 | |||
| MGV / Vanguard World Fund - Vanguard Mega Cap Value ETF | 0,00 | 0,00 | 0,01 | 8,33 | 0,0061 | -0,0004 | |||
| LVMUY / LVMH Moët Hennessy - Louis Vuitton, Société Européenne - Depositary Receipt (Common Stock) | 0,00 | 400,00 | 0,01 | 333,33 | 0,0061 | 0,0045 | |||
| AMT / American Tower Corporation | 0,00 | 0,00 | 0,01 | 8,33 | 0,0061 | -0,0004 | |||
| CMI / Cummins Inc. | 0,00 | 2,56 | 0,01 | 0,00 | 0,0060 | -0,0002 | |||
| PBE / Invesco Exchange-Traded Fund Trust - Invesco Biotechnology & Genome ETF | 0,00 | 0,00 | 0,01 | 0,00 | 0,0060 | -0,0005 | |||
| DAL / Delta Air Lines, Inc. | 0,00 | 0,39 | 0,01 | 9,09 | 0,0058 | 0,0002 | |||
| MA / Mastercard Incorporated | 0,00 | 5,00 | 0,01 | 0,00 | 0,0054 | -0,0003 | |||
| MRK / Merck & Co., Inc. | 0,00 | -32,86 | 0,01 | -42,11 | 0,0052 | -0,0045 | |||
| CSX / CSX Corporation | 0,00 | 0,29 | 0,01 | 10,00 | 0,0052 | 0,0001 | |||
| OMCL / Omnicell, Inc. | 0,00 | 0,00 | 0,01 | -16,67 | 0,0048 | -0,0014 | |||
| PSA / Public Storage | 0,00 | 0,00 | 0,01 | 0,00 | 0,0048 | -0,0005 | |||
| APH / Amphenol Corporation | 0,00 | 0,00 | 0,01 | 66,67 | 0,0047 | 0,0013 | |||
| CVX / Chevron Corporation | 0,00 | 1,45 | 0,01 | -18,18 | 0,0046 | -0,0012 | |||
| KD / Kyndryl Holdings, Inc. | 0,00 | 0,00 | 0,01 | 28,57 | 0,0045 | 0,0008 | |||
| VGT / Vanguard World Fund - Vanguard Information Technology ETF | 0,00 | 0,00 | 0,01 | 28,57 | 0,0044 | 0,0005 | |||
| EIX / Edison International | 0,00 | 1,13 | 0,01 | -10,00 | 0,0043 | -0,0010 | |||
| ABBV / AbbVie Inc. | 0,00 | 2,08 | 0,01 | -10,00 | 0,0042 | -0,0009 | |||
| TCOM / Trip.com Group Limited - Depositary Receipt (Common Stock) | 0,00 | 0,00 | 0,01 | -11,11 | 0,0041 | -0,0007 | |||
| IWN / iShares Trust - iShares Russell 2000 Value ETF | 0,00 | 0,01 | 0,0039 | 0,0039 | |||||
| STAG / STAG Industrial, Inc. | 0,00 | 0,90 | 0,01 | 14,29 | 0,0038 | -0,0003 | |||
| HESAY / Hermès International Société en commandite par actions - Depositary Receipt (Common Stock) | 0,00 | 0,00 | 0,01 | 0,00 | 0,0031 | -0,0002 | |||
| ABNB / Airbnb, Inc. | 0,00 | 0,00 | 0,01 | 20,00 | 0,0031 | 0,0000 | |||
| BMY / Bristol-Myers Squibb Company | 0,00 | 1,52 | 0,01 | -25,00 | 0,0029 | -0,0012 | |||
| AMGN / Amgen Inc. | 0,00 | 0,00 | 0,01 | -16,67 | 0,0027 | -0,0006 | |||
| COTY / Coty Inc. | 0,00 | 0,00 | 0,01 | -16,67 | 0,0027 | -0,0008 | |||
| WBD / Warner Bros. Discovery, Inc. | 0,00 | 0,00 | 0,01 | 0,00 | 0,0026 | -0,0001 | |||
| BMO / Bank of Montreal | 0,00 | 0,00 | 0,01 | 25,00 | 0,0026 | 0,0001 | |||
| SJM / The J. M. Smucker Company | 0,00 | 1,82 | 0,01 | -16,67 | 0,0025 | -0,0008 | |||
| RBLX / Roblox Corporation | 0,00 | 0,00 | 0,01 | 150,00 | 0,0024 | 0,0010 | |||
| BOX / Box, Inc. | 0,00 | 0,00 | 0,01 | 25,00 | 0,0024 | 0,0000 | |||
| LYFT / Lyft, Inc. | 0,00 | 0,00 | 0,00 | 33,33 | 0,0022 | 0,0004 | |||
| PBI / Pitney Bowes Inc. | 0,00 | 0,74 | 0,00 | 33,33 | 0,0021 | 0,0002 | |||
| WBA / Walgreens Boots Alliance, Inc. | 0,00 | 0,00 | 0,00 | 0,00 | 0,0020 | -0,0001 | |||
| AIG / American International Group, Inc. | 0,00 | 0,00 | 0,00 | 0,00 | 0,0019 | -0,0002 | |||
| CRI / Carter's, Inc. | 0,00 | 0,77 | 0,00 | -40,00 | 0,0018 | -0,0009 | |||
| LUMN / Lumen Technologies, Inc. | 0,00 | 0,00 | 0,00 | 50,00 | 0,0015 | 0,0000 | |||
| MPW / Medical Properties Trust, Inc. | 0,00 | 1,55 | 0,00 | -33,33 | 0,0013 | -0,0007 | |||
| PRDSY / Prada S.p.A. - Depositary Receipt (Common Stock) | 0,00 | 0,00 | 0,00 | 0,00 | 0,0011 | -0,0003 | |||
| GIS / General Mills, Inc. | 0,00 | 0,00 | 0,00 | -50,00 | 0,0009 | -0,0002 | |||
| WAB / Westinghouse Air Brake Technologies Corporation | 0,00 | 0,00 | 0,00 | 0,00 | 0,0009 | 0,0000 | |||
| TMUS / T-Mobile US, Inc. | 0,00 | 0,00 | 0,00 | 0,00 | 0,0008 | -0,0002 | |||
| ZM / Zoom Communications Inc. | 0,00 | 0,00 | 0,00 | 0,0002 | -0,0000 | ||||
| VTRS / Viatris Inc. | 0,00 | 0,00 | 0,00 | 0,0001 | -0,0000 | ||||
| GSAT / Globalstar, Inc. | 0,00 | 0,00 | 0,00 | 0,0000 | 0,0000 | ||||
| BBWI / Bath & Body Works, Inc. | 0,00 | 0,00 | 0,0000 | -0,0000 | |||||
| PLTR / Palantir Technologies Inc. | 0,00 | -100,00 | 0,00 | -100,00 | -0,0107 | ||||
| UBER / Uber Technologies, Inc. | 0,00 | -100,00 | 0,00 | 0,0000 | |||||
| PYPL / PayPal Holdings, Inc. | 0,00 | -100,00 | 0,00 | 0,0000 | |||||
| CDE / Coeur Mining, Inc. | 0,00 | -100,00 | 0,00 | 0,0000 | |||||
| SPY / SPDR S&P 500 ETF | 0,00 | -100,00 | 0,00 | 0,0000 | |||||
| CSL / Carlisle Companies Incorporated | 0,00 | -100,00 | 0,00 | 0,0000 | |||||
| HON / Honeywell International Inc. | 0,00 | -100,00 | 0,00 | 0,0000 | |||||
| IYG / iShares Trust - iShares U.S. Financial Services ETF | 0,00 | -100,00 | 0,00 | 0,0000 | |||||
| MS / Morgan Stanley | 0,00 | -100,00 | 0,00 | 0,0000 |