Statistiques de base
| Profil de l'initié | FIDUCIARY MANAGEMENT INC /WI/ |
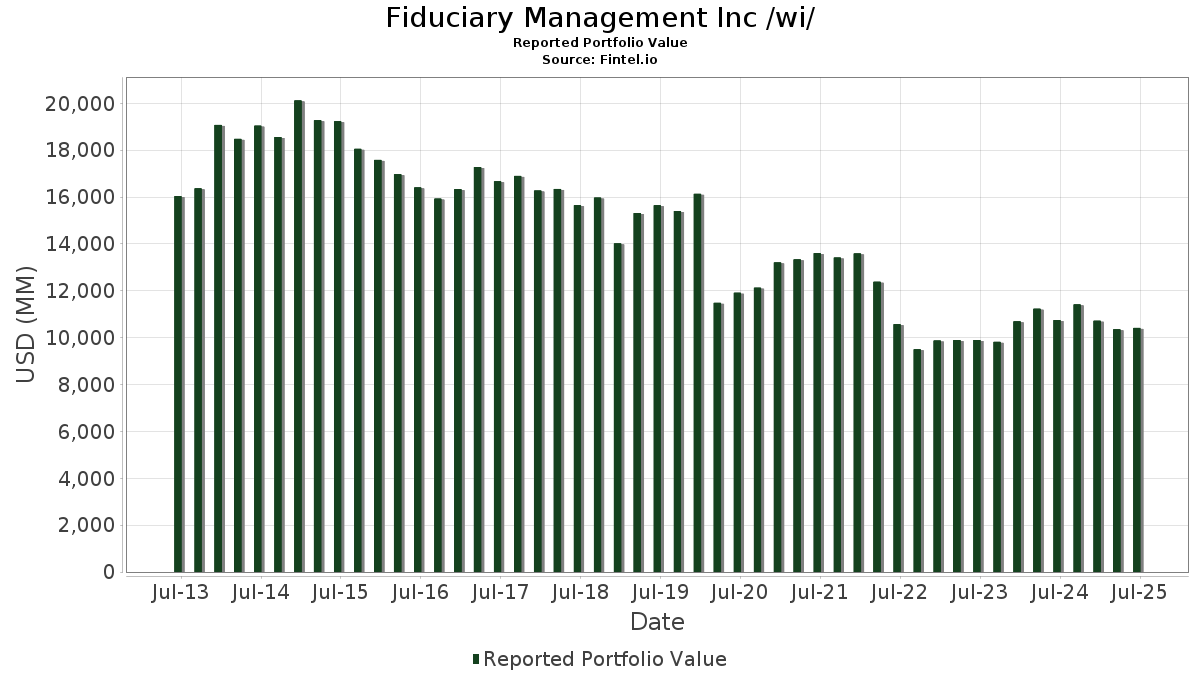
| Valeur du portefeuille | $ 10 413 172 311 |
| Positions actuelles | 67 |
Dernières positions, performances, ASG (à partir des dépôts 13F, 13D)
Fiduciary Management Inc /wi/ a déclaré un total de 67 positions dans ses derniers dépôts auprès de la SEC. La valeur la plus récente du portefeuille est calculée à 10 413 172 311 USD. Les actifs sous gestion réels (ASG) sont cette valeur plus les liquidités (qui ne sont pas divulguées). Les principales positions de Fiduciary Management Inc /wi/ sont Ferguson Enterprises Inc. (US:FERG) , Booking Holdings Inc. (US:BKNG) , Aramark (US:ARMK) , The Charles Schwab Corporation (US:SCHW) , and Carrier Global Corporation (US:CARR) . Les nouvelles positions de Fiduciary Management Inc /wi/ incluent Capital One Financial Corporation (US:COF) , Becton, Dickinson and Company (US:BDX) , MSA Safety Incorporated (US:MSA) , Louisiana-Pacific Corporation (US:LPX) , and . Les principales industries de Fiduciary Management Inc /wi/ sont "Holding And Other Investment Offices" (sic 67) , "Personal Services" (sic 72) , and "Health Services" (sic 80) .
Meilleures augmentations ce trimestre
Nous utilisons la variation de l'allocation du portefeuille car il s'agit de l'indicateur le plus significatif. Les changements peuvent être dus à des transactions ou à des variations de prix des actions.
| Titre | Actions (en millions) |
Valeur ($ en millions) |
% du portefeuille | ΔPortefeuille % |
|---|---|---|---|---|
| 0,73 | 154,69 | 1,4856 | 1,4856 | |
| 0,90 | 154,28 | 1,4816 | 1,4816 | |
| 2,72 | 591,42 | 5,6796 | 1,2607 | |
| 0,53 | 88,50 | 0,8499 | 0,8499 | |
| 12,66 | 530,04 | 5,0901 | 0,7423 | |
| 0,89 | 76,60 | 0,7356 | 0,7356 | |
| 2,42 | 176,91 | 1,6989 | 0,6252 | |
| 0,10 | 568,08 | 5,4554 | 0,6030 | |
| 1,70 | 216,79 | 2,0819 | 0,5408 | |
| 2,99 | 170,49 | 1,6373 | 0,3869 |
Principales baisses ce trimestre
Nous utilisons la variation de l'allocation du portefeuille car il s'agit de l'indicateur le plus significatif. Les changements peuvent être dus à des transactions ou à des variations de prix des actions.
| Titre | Actions (en millions) |
Valeur ($ en millions) |
% du portefeuille | ΔPortefeuille % |
|---|---|---|---|---|
| 4,24 | 186,47 | 1,7907 | -1,5955 | |
| 0,45 | 218,25 | 2,0959 | -1,2806 | |
| 0,77 | 82,83 | 0,7955 | -1,0502 | |
| 0,45 | 139,79 | 1,3425 | -1,0493 | |
| 0,90 | 81,35 | 0,7813 | -0,8258 | |
| 1,89 | 77,38 | 0,7431 | -0,6148 | |
| 5,41 | 182,77 | 1,7552 | -0,5957 | |
| 1,97 | 124,61 | 1,1966 | -0,3578 | |
| 8,33 | 216,74 | 2,0814 | -0,3354 | |
| 0,81 | 216,24 | 2,0766 | -0,2691 |
Déclarations 13D/G
Il s'agit d'une liste des déclarations 13D et 13G déposées au cours de la dernière année (le cas échéant). Cliquez sur l'icône du lien pour voir l'historique complet des transactions. Les lignes vertes indiquent de nouvelles positions. Les lignes rouges indiquent des positions fermées.
| Date de dépôt | Formulaire | Titre | Actions précédentes |
Actions actuelles |
ΔActions % | % de participation |
% ΔParticipation | |
|---|---|---|---|---|---|---|---|---|
| 2025-02-20 | G / Genpact Limited | 8 737 813 | 5,00 | |||||
| 2025-02-20 | TRS / TriMas Corporation | 2 013 835 | 5,00 |
Déclarations 13F et dépôts de fonds
Ce formulaire a été déposé le 2025-08-14 pour la période de déclaration 2025-06-30. Cliquez sur l'icône du lien pour voir l'historique complet des transactions.
Mettre à niveau pour débloquer les données premium et exporter vers Excel ![]() .
.
| Titre | Type | Prix moyen de l'action | Actions (en millions) |
ΔActions (%) |
ΔActions (%) |
Valeur ($ en millions) |
Portefeuille (%) |
ΔPortefeuille (%) |
|
|---|---|---|---|---|---|---|---|---|---|
| FERG / Ferguson Enterprises Inc. | 2,72 | -4,86 | 591,42 | 29,30 | 5,6796 | 1,2607 | |||
| BKNG / Booking Holdings Inc. | 0,10 | -10,00 | 568,08 | 13,10 | 5,4554 | 0,6030 | |||
| ARMK / Aramark | 12,66 | -2,90 | 530,04 | 17,77 | 5,0901 | 0,7423 | |||
| SCHW / The Charles Schwab Corporation | 4,39 | -5,32 | 400,13 | 10,36 | 3,8426 | 0,3398 | |||
| CARR / Carrier Global Corporation | 3,50 | -4,75 | 256,06 | 9,95 | 2,4590 | 0,2093 | |||
| BRK.B / Berkshire Hathaway Inc. | 0,45 | -31,54 | 218,25 | -37,56 | 2,0959 | -1,2806 | |||
| ARW / Arrow Electronics, Inc. | 1,70 | 10,73 | 216,79 | 35,90 | 2,0819 | 0,5408 | |||
| SONY / Sony Group Corporation - Depositary Receipt (Common Stock) | 8,33 | -15,49 | 216,74 | -13,36 | 2,0814 | -0,3354 | |||
| PGR / The Progressive Corporation | 0,81 | -5,55 | 216,24 | -10,94 | 2,0766 | -0,2691 | |||
| AVY / Avery Dennison Corporation | 1,23 | -5,14 | 215,14 | -6,47 | 2,0661 | -0,1561 | |||
| DGX / Quest Diagnostics Incorporated | 1,19 | -5,28 | 212,92 | 0,56 | 2,0447 | -0,0008 | |||
| UL / Unilever PLC - Depositary Receipt (Common Stock) | 3,29 | -5,16 | 201,12 | -2,58 | 1,9314 | -0,0631 | |||
| CSX / CSX Corporation | 6,03 | -3,84 | 196,84 | 6,62 | 1,8903 | 0,1067 | |||
| CSL / Carlisle Companies Incorporated | 0,52 | -2,53 | 195,04 | 6,89 | 1,8730 | 0,1102 | |||
| MAS / Masco Corporation | 3,02 | -4,97 | 194,11 | -12,05 | 1,8641 | -0,2680 | |||
| KMX / CarMax, Inc. | 2,87 | 8,37 | 193,13 | -6,53 | 1,8547 | -0,1414 | |||
| G / Genpact Limited | 4,24 | -39,10 | 186,47 | -46,80 | 1,7907 | -1,5955 | |||
| GOOGL / Alphabet Inc. | 1,05 | -23,24 | 184,34 | -12,53 | 1,7702 | -0,2656 | |||
| SLB / Schlumberger Limited | 5,41 | -7,12 | 182,77 | -24,89 | 1,7552 | -0,5957 | |||
| VVV / Valvoline Inc. | 4,78 | 0,17 | 180,92 | 8,97 | 1,7374 | 0,1335 | |||
| HSIC / Henry Schein, Inc. | 2,45 | -0,39 | 179,11 | 6,24 | 1,7201 | 0,0914 | |||
| SYY / Sysco Corporation | 2,36 | -4,74 | 178,98 | -3,85 | 1,7188 | -0,0795 | |||
| PHG / Koninklijke Philips N.V. - Depositary Receipt (Common Stock) | 7,46 | -0,70 | 178,97 | -6,25 | 1,7187 | -0,1255 | |||
| NVT / nVent Electric plc | 2,42 | 13,91 | 176,91 | 59,18 | 1,6989 | 0,6252 | |||
| FCFS / FirstCash Holdings, Inc. | 1,29 | -0,38 | 174,35 | 11,89 | 1,6743 | 0,1690 | |||
| DCI / Donaldson Company, Inc. | 2,49 | -0,43 | 172,61 | 2,97 | 1,6576 | 0,0381 | |||
| GTES / Gates Industrial Corporation plc | 7,43 | 2,20 | 171,02 | 27,85 | 1,6424 | 0,3501 | |||
| OMF / OneMain Holdings, Inc. | 2,99 | 12,96 | 170,49 | 31,73 | 1,6373 | 0,3869 | |||
| FMS / Fresenius Medical Care AG - Depositary Receipt (Common Stock) | 5,66 | -4,94 | 161,60 | 9,08 | 1,5519 | 0,1206 | |||
| SSD / Simpson Manufacturing Co., Inc. | 1,02 | 11,69 | 158,92 | 10,43 | 1,5262 | 0,1359 | |||
| CCEP / Coca-Cola Europacific Partners PLC | 1,70 | -17,11 | 157,19 | -11,70 | 1,5096 | -0,2101 | |||
| COF / Capital One Financial Corporation | 0,73 | 154,69 | 1,4856 | 1,4856 | |||||
| BDX / Becton, Dickinson and Company | 0,90 | 154,28 | 1,4816 | 1,4816 | |||||
| NSIT / Insight Enterprises, Inc. | 1,09 | 14,81 | 150,49 | 5,70 | 1,4452 | 0,0698 | |||
| RYAAY / Ryanair Holdings plc - Depositary Receipt (Common Stock) | 2,54 | -17,11 | 146,76 | 12,83 | 1,4094 | 0,1528 | |||
| UNH / UnitedHealth Group Incorporated | 0,45 | -5,21 | 139,79 | -43,54 | 1,3425 | -1,0493 | |||
| CNM / Core & Main, Inc. | 2,31 | -18,65 | 139,51 | 1,62 | 1,3398 | 0,0135 | |||
| ZION / Zions Bancorporation, National Association | 2,65 | 15,69 | 137,69 | 20,51 | 1,3223 | 0,2185 | |||
| HLI / Houlihan Lokey, Inc. | 0,75 | -0,48 | 135,20 | 10,89 | 1,2984 | 0,1205 | |||
| PRI / Primerica, Inc. | 0,49 | -0,37 | 133,85 | -4,18 | 1,2854 | -0,0640 | |||
| DLTR / Dollar Tree, Inc. | 1,33 | -5,19 | 132,19 | 25,08 | 1,2694 | 0,2485 | |||
| WTM / White Mountains Insurance Group, Ltd. | 0,07 | -0,44 | 128,35 | -7,17 | 1,2326 | -0,1031 | |||
| PLXS / Plexus Corp. | 0,93 | -0,38 | 126,43 | 5,20 | 1,2141 | 0,0531 | |||
| SKX / Skechers U.S.A., Inc. | 1,97 | -30,31 | 124,61 | -22,56 | 1,1966 | -0,3578 | |||
| CDW / CDW Corporation | 0,68 | -5,35 | 121,50 | 5,47 | 1,1668 | 0,0539 | |||
| ATR / AptarGroup, Inc. | 0,76 | -0,45 | 119,54 | 4,95 | 1,1479 | 0,0476 | |||
| ALLE / Allegion plc | 0,82 | -5,88 | 117,84 | 3,98 | 1,1316 | 0,0368 | |||
| FBIN / Fortune Brands Innovations, Inc. | 2,28 | -0,40 | 117,51 | -15,78 | 1,1285 | -0,2194 | |||
| HAYW / Hayward Holdings, Inc. | 8,05 | 20,04 | 111,15 | 19,00 | 1,0674 | 0,1651 | |||
| ICLR / ICON Public Limited Company | 0,65 | 50,10 | 94,62 | 24,76 | 0,9087 | 0,1760 | |||
| MSA / MSA Safety Incorporated | 0,53 | 88,50 | 0,8499 | 0,8499 | |||||
| BLK / BlackRock, Inc. | 0,08 | -4,13 | 88,41 | 6,27 | 0,8490 | 0,0454 | |||
| TKR / The Timken Company | 1,14 | -0,42 | 82,92 | 0,52 | 0,7963 | -0,0006 | |||
| BJ / BJ's Wholesale Club Holdings, Inc. | 0,77 | -54,12 | 82,83 | -56,64 | 0,7955 | -1,0502 | |||
| ORLY / O'Reilly Automotive, Inc. | 0,90 | 677,30 | 81,35 | -51,10 | 0,7813 | -0,8258 | |||
| RHI / Robert Half Inc. | 1,89 | -26,85 | 77,38 | -44,95 | 0,7431 | -0,6148 | |||
| LPX / Louisiana-Pacific Corporation | 0,89 | 76,60 | 0,7356 | 0,7356 | |||||
| AIT / Applied Industrial Technologies, Inc. | 0,23 | -0,73 | 54,58 | 2,40 | 0,5241 | 0,0092 | |||
| CTS / CTS Corporation | 1,19 | -0,58 | 50,51 | 1,95 | 0,4850 | 0,0064 | |||
| WEIR / The Weir Group PLC | 0,07 | -1,63 | 2,31 | 12,07 | 0,0222 | 0,0023 | |||
| SDXAY / Sodexo S.A. - Depositary Receipt (Common Stock) | 0,13 | 6,13 | 1,58 | 1,86 | 0,0152 | 0,0002 | |||
| ASHTY / Ashtead Group plc - Depositary Receipt (Common Stock) | 0,01 | 6,91 | 1,31 | 27,57 | 0,0126 | 0,0027 | |||
| BMRRY / B&M European Value Retail S.A. - Depositary Receipt (Common Stock) | 0,08 | -1,62 | 1,22 | 8,47 | 0,0117 | 0,0008 | |||
| IFJPY / Informa plc - Depositary Receipt (Common Stock) | 0,01 | 15,47 | 0,29 | 22,88 | 0,0028 | 0,0005 | |||
| RHHBY / Roche Holding AG - Depositary Receipt (Common Stock) | 0,01 | -2,18 | 0,23 | -2,98 | 0,0022 | -0,0001 | |||
| RXEEY / Rexel S.A. - Depositary Receipt (Common Stock) | 0,01 | 0,23 | 0,0022 | 0,0022 | |||||
| EDNMY / Edenred SE - Depositary Receipt (Common Stock) | 0,01 | -2,16 | 0,18 | -7,29 | 0,0017 | -0,0001 | |||
| SNN / Smith & Nephew plc - Depositary Receipt (Common Stock) | 0,00 | -100,00 | 0,00 | 0,0000 | |||||
| IJR / iShares Trust - iShares Core S&P Small-Cap ETF | 0,00 | -100,00 | 0,00 | 0,0000 | |||||
| MCHP / Microchip Technology Incorporated | 0,00 | -100,00 | 0,00 | 0,0000 | |||||
| IVV / iShares Trust - iShares Core S&P 500 ETF | 0,00 | -100,00 | 0,00 | 0,0000 |