Statistiques de base
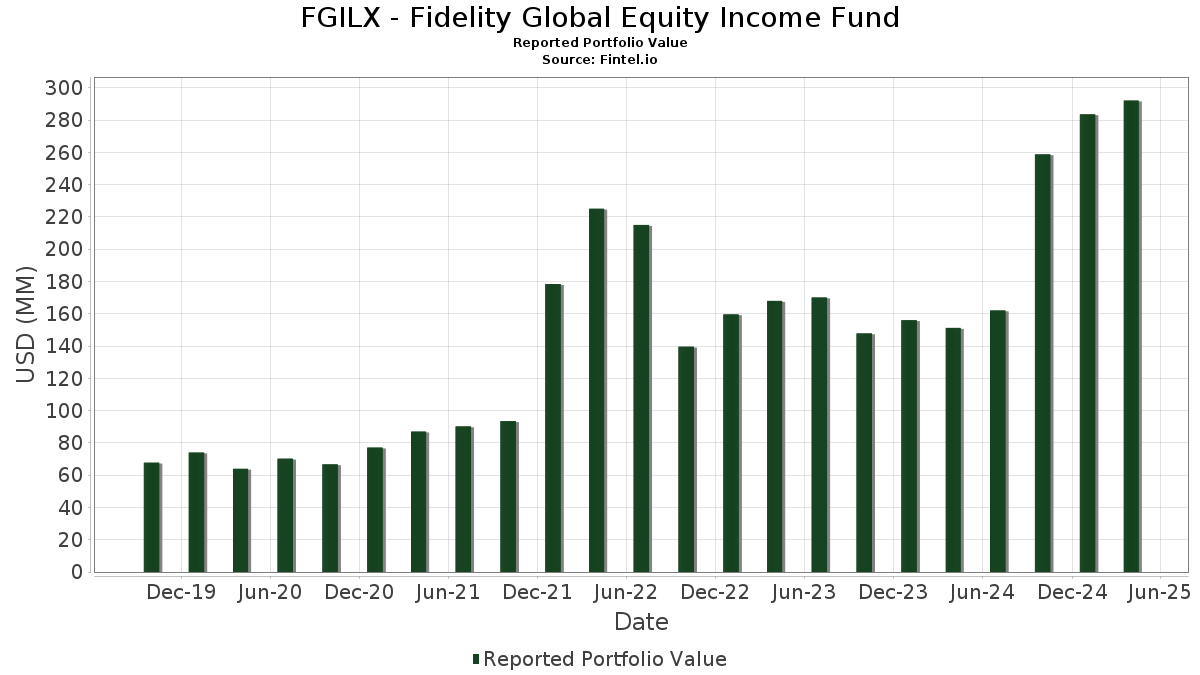
| Valeur du portefeuille | $ 292 053 860 |
| Positions actuelles | 150 |
Dernières positions, performances, ASG (à partir des dépôts 13F, 13D)
FGILX - Fidelity Global Equity Income Fund a déclaré un total de 150 positions dans ses derniers dépôts auprès de la SEC. La valeur la plus récente du portefeuille est calculée à 292 053 860 USD. Les actifs sous gestion réels (ASG) sont cette valeur plus les liquidités (qui ne sont pas divulguées). Les principales positions de FGILX - Fidelity Global Equity Income Fund sont Rheinmetall AG - Depositary Receipt (Common Stock) (US:RNMBY) , Apple Inc. (US:AAPL) , Microsoft Corporation (US:MSFT) , Taiwan Semiconductor Manufacturing Company Limited (TW:2330) , and JPMorgan Chase & Co. (US:JPM) . Les nouvelles positions de FGILX - Fidelity Global Equity Income Fund incluent The Charles Schwab Corporation (US:SCHW) , TEGNA Inc. (US:TGNA) , Burberry Group plc (US:BBRYF) , .
Meilleures augmentations ce trimestre
Nous utilisons la variation de l'allocation du portefeuille car il s'agit de l'indicateur le plus significatif. Les changements peuvent être dus à des transactions ou à des variations de prix des actions.
| Titre | Actions (en millions) |
Valeur ($ en millions) |
% du portefeuille | ΔPortefeuille % |
|---|---|---|---|---|
| 0,01 | 15,24 | 5,2091 | 2,2913 | |
| 0,03 | 2,04 | 0,6985 | 0,6985 | |
| 0,07 | 1,33 | 0,4547 | 0,3294 | |
| 0,11 | 2,45 | 0,8383 | 0,3037 | |
| 0,00 | 0,77 | 0,2618 | 0,2618 | |
| 0,07 | 0,65 | 0,2237 | 0,2237 | |
| 0,01 | 1,60 | 0,5459 | 0,2200 | |
| 0,14 | 3,78 | 1,2932 | 0,2198 | |
| 0,06 | 2,25 | 0,7684 | 0,1633 | |
| 0,29 | 1,86 | 0,6363 | 0,1599 |
Principales baisses ce trimestre
Nous utilisons la variation de l'allocation du portefeuille car il s'agit de l'indicateur le plus significatif. Les changements peuvent être dus à des transactions ou à des variations de prix des actions.
| Titre | Actions (en millions) |
Valeur ($ en millions) |
% du portefeuille | ΔPortefeuille % |
|---|---|---|---|---|
| 3,04 | 3,04 | 1,0394 | -2,2233 | |
| 0,06 | 13,32 | 4,5539 | -0,6269 | |
| 0,24 | 6,80 | 2,3245 | -0,4186 | |
| 0,02 | 3,58 | 1,2230 | -0,3995 | |
| 0,01 | 2,72 | 0,9282 | -0,2781 | |
| 0,02 | 2,88 | 0,9851 | -0,2742 | |
| 0,01 | 2,93 | 1,0009 | -0,2611 | |
| 0,03 | 12,43 | 4,2489 | -0,2412 | |
| 0,00 | 2,15 | 0,7361 | -0,2159 | |
| 0,02 | 2,12 | 0,7254 | -0,2058 |
Déclarations 13F et dépôts de fonds
Ce formulaire a été déposé le 2025-06-26 pour la période de déclaration 2025-04-30. Cliquez sur l'icône du lien pour voir l'historique complet des transactions.
Mettre à niveau pour débloquer les données premium et exporter vers Excel ![]() .
.
| Titre | Type | Prix moyen de l'action | Actions (en millions) |
ΔActions (%) |
ΔActions (%) |
Valeur ($ en millions) |
Portefeuille (%) |
ΔPortefeuille (%) |
|
|---|---|---|---|---|---|---|---|---|---|
| RNMBY / Rheinmetall AG - Depositary Receipt (Common Stock) | 0,01 | -15,17 | 15,24 | 84,36 | 5,2091 | 2,2913 | |||
| AAPL / Apple Inc. | 0,06 | 0,80 | 13,32 | -9,23 | 4,5539 | -0,6269 | |||
| MSFT / Microsoft Corporation | 0,03 | 2,61 | 12,43 | -2,29 | 4,2489 | -0,2412 | |||
| 2330 / Taiwan Semiconductor Manufacturing Company Limited | 0,24 | 2,56 | 6,80 | -12,50 | 2,3245 | -0,4186 | |||
| JPM / JPMorgan Chase & Co. | 0,02 | 6,12 | 5,09 | -2,88 | 1,7413 | -0,1103 | |||
| ABBV / AbbVie Inc. | 0,02 | 6,76 | 4,62 | 13,27 | 1,5790 | 0,1395 | |||
| NXPI / NXP Semiconductors N.V. | 0,02 | 8,35 | 4,54 | -4,24 | 1,5529 | -0,1217 | |||
| TMUS / T-Mobile US, Inc. | 0,02 | 7,75 | 4,12 | 14,23 | 1,4080 | 0,1351 | |||
| LLY / Eli Lilly and Company | 0,00 | 0,00 | 3,90 | 10,83 | 1,3332 | 0,0911 | |||
| LIN / Linde plc | 0,01 | 3,63 | 3,88 | 5,29 | 1,3276 | 0,0254 | |||
| SNEJF / Sony Group Corporation | 0,14 | 4,06 | 3,78 | 24,41 | 1,2932 | 0,2198 | |||
| GE / General Electric Company | 0,02 | 3,33 | 3,75 | 2,29 | 1,2832 | -0,0121 | |||
| GOOGL / Alphabet Inc. | 0,02 | 0,00 | 3,58 | -22,17 | 1,2230 | -0,3995 | |||
| HIG / The Hartford Insurance Group, Inc. | 0,03 | 4,33 | 3,55 | 14,71 | 1,2132 | 0,1212 | |||
| TJX / The TJX Companies, Inc. | 0,03 | 3,77 | 3,54 | 7,01 | 1,2109 | 0,0424 | |||
| XOM / Exxon Mobil Corporation | 0,03 | 9,65 | 3,36 | 8,42 | 1,1485 | 0,0547 | |||
| DTEGY / Deutsche Telekom AG - Depositary Receipt (Common Stock) | 0,09 | 0,11 | 3,30 | 7,18 | 1,1272 | 0,0412 | |||
| GILD / Gilead Sciences, Inc. | 0,03 | 3,85 | 3,16 | 13,81 | 1,0819 | 0,1004 | |||
| PG / The Procter & Gamble Company | 0,02 | 3,75 | 3,15 | 1,61 | 1,0777 | -0,0175 | |||
| AZN / AstraZeneca PLC - Depositary Receipt (Common Stock) | 0,04 | -3,54 | 3,13 | -2,12 | 1,0710 | -0,0590 | |||
| US31635A1051 / Fidelity Cash Central Fund | 3,04 | -67,10 | 3,04 | -67,11 | 1,0394 | -2,2233 | |||
| WMT / Walmart Inc. | 0,03 | 0,32 | 3,01 | -0,59 | 1,0288 | -0,0400 | |||
| BAC / Bank of America Corporation | 0,08 | 3,86 | 3,00 | -10,57 | 1,0273 | -0,1585 | |||
| HIA1 / Hitachi, Ltd. | 0,12 | 4,03 | 3,00 | 2,25 | 1,0245 | -0,0099 | |||
| ACN / Accenture plc | 0,01 | 5,38 | 2,93 | -18,13 | 1,0009 | -0,2611 | |||
| VST / Vistra Corp. | 0,02 | 4,71 | 2,88 | -19,23 | 0,9851 | -0,2742 | |||
| MTRAF / Metro Inc. | 0,04 | 0,00 | 2,87 | 23,34 | 0,9810 | 0,1597 | |||
| CSCO / Cisco Systems, Inc. | 0,05 | 4,04 | 2,83 | -0,88 | 0,9666 | -0,0405 | |||
| CMPGF / Compass Group PLC | 0,08 | 0,00 | 2,80 | -2,13 | 0,9583 | -0,0530 | |||
| KO / The Coca-Cola Company | 0,04 | 4,72 | 2,74 | 19,68 | 0,9359 | 0,1284 | |||
| WFC / Wells Fargo & Company | 0,04 | -0,26 | 2,74 | -10,09 | 0,9350 | -0,1392 | |||
| UNH / UnitedHealth Group Incorporated | 0,01 | 4,76 | 2,72 | -20,54 | 0,9282 | -0,2781 | |||
| TRV / The Travelers Companies, Inc. | 0,01 | 0,00 | 2,70 | 7,74 | 0,9232 | 0,0383 | |||
| HRB / H&R Block, Inc. | 0,04 | 0,00 | 2,68 | 9,16 | 0,9172 | 0,0495 | |||
| RELX / RELX PLC - Depositary Receipt (Common Stock) | 0,05 | 0,00 | 2,64 | 9,88 | 0,9011 | 0,0545 | |||
| ATD / Alimentation Couche-Tard Inc. | 0,05 | 0,20 | 2,64 | -0,94 | 0,9009 | -0,0384 | |||
| PNC / The PNC Financial Services Group, Inc. | 0,02 | 4,65 | 2,53 | -16,31 | 0,8651 | -0,2024 | |||
| BA. / BAE Systems plc | 0,11 | 5,59 | 2,45 | 61,96 | 0,8383 | 0,3037 | |||
| DHR / Danaher Corporation | 0,01 | 0,00 | 2,38 | -10,54 | 0,8154 | -0,1255 | |||
| LDNXF / London Stock Exchange Group plc | 0,02 | 0,00 | 2,37 | 4,64 | 0,8091 | 0,0106 | |||
| MCD / McDonald's Corporation | 0,01 | 7,25 | 2,36 | 18,74 | 0,8079 | 0,1054 | |||
| DOX / Amdocs Limited | 0,03 | 5,55 | 2,36 | 6,03 | 0,8063 | 0,0209 | |||
| MRK / Merck & Co., Inc. | 0,03 | 0,00 | 2,34 | -13,78 | 0,8001 | -0,1582 | |||
| MTB / M&T Bank Corporation | 0,01 | 0,00 | 2,30 | -15,63 | 0,7861 | -0,1762 | |||
| SSNLF / Samsung Electronics Co., Ltd. | 0,06 | 19,90 | 2,25 | 31,17 | 0,7684 | 0,1633 | |||
| SIE / Siemens Aktiengesellschaft | 0,01 | 6,65 | 2,22 | 14,59 | 0,7574 | 0,0747 | |||
| RHHBY / Roche Holding AG - Depositary Receipt (Common Stock) | 0,01 | 5,58 | 2,16 | 9,79 | 0,7400 | 0,0442 | |||
| COF / Capital One Financial Corporation | 0,01 | 0,00 | 2,15 | -11,51 | 0,7363 | -0,1229 | |||
| MC / LVMH Moët Hennessy - Louis Vuitton, Société Européenne | 0,00 | 5,42 | 2,15 | -20,14 | 0,7361 | -0,2159 | |||
| LOW / Lowe's Companies, Inc. | 0,01 | 0,00 | 2,15 | -14,05 | 0,7342 | -0,1477 | |||
| NEE / NextEra Energy, Inc. | 0,03 | 5,64 | 2,13 | -1,25 | 0,7279 | -0,0334 | |||
| CB / Chubb Limited | 0,01 | 0,00 | 2,12 | 5,20 | 0,7264 | 0,0135 | |||
| DIS / The Walt Disney Company | 0,02 | 0,00 | 2,12 | -19,57 | 0,7254 | -0,2058 | |||
| CSU / Constellation Software Inc. | 0,00 | 0,00 | 2,09 | 10,16 | 0,7158 | 0,0451 | |||
| SCHW / The Charles Schwab Corporation | 0,03 | 2,04 | 0,6985 | 0,6985 | |||||
| LAMR / Lamar Advertising Company | 0,02 | 6,07 | 1,99 | -4,52 | 0,6795 | -0,0553 | |||
| SEH / Shin-Etsu Chemical Co., Ltd. | 0,06 | 6,78 | 1,92 | 4,81 | 0,6557 | 0,0097 | |||
| EQTL3 / Equatorial S.A. | 0,29 | 9,71 | 1,86 | 37,95 | 0,6363 | 0,1599 | |||
| GEV / GE Vernova Inc. | 0,00 | 9,11 | 1,78 | 8,49 | 0,6074 | 0,0294 | |||
| KBC / KBC Group NV | 0,02 | 0,00 | 1,76 | 19,12 | 0,6008 | 0,0798 | |||
| COST / Costco Wholesale Corporation | 0,00 | 0,00 | 1,71 | 1,48 | 0,5861 | -0,0102 | |||
| UL / Unilever PLC - Depositary Receipt (Common Stock) | 0,03 | 8,47 | 1,71 | 20,56 | 0,5855 | 0,0841 | |||
| SO / The Southern Company | 0,02 | 0,00 | 1,64 | 9,40 | 0,5613 | 0,0318 | |||
| HO / Thales S.A. | 0,01 | 0,00 | 1,60 | 72,91 | 0,5459 | 0,2200 | |||
| NTDOF / Nintendo Co., Ltd. | 0,02 | -0,52 | 1,59 | 25,83 | 0,5449 | 0,0979 | |||
| IMO / Imperial Oil Limited | 0,02 | 8,85 | 1,58 | 10,43 | 0,5391 | 0,0348 | |||
| AEE / Ameren Corporation | 0,02 | 0,00 | 1,57 | 5,36 | 0,5375 | 0,0107 | |||
| RIG2 / Richter Gedeon Vegyészeti Gyár Nyilvánosan Muködo Rt. | 0,05 | 2,42 | 1,56 | 19,75 | 0,5347 | 0,0735 | |||
| PSK / PrairieSky Royalty Ltd. | 0,09 | 0,00 | 1,55 | -9,57 | 0,5301 | -0,0753 | |||
| USB / U.S. Bancorp | 0,04 | 7,56 | 1,55 | -9,15 | 0,5296 | -0,0726 | |||
| IBADF / Inaba Denki Sangyo Co.,Ltd. | 0,06 | 0,17 | 1,55 | 10,57 | 0,5292 | 0,0348 | |||
| RYCEY / Rolls-Royce Holdings plc - Depositary Receipt (Common Stock) | 0,15 | 0,00 | 1,50 | 35,75 | 0,5115 | 0,1224 | |||
| TPR / Tapestry, Inc. | 0,02 | 7,71 | 1,48 | 4,37 | 0,5060 | 0,0052 | |||
| PRY / Tion Renewables AG | 0,03 | 8,03 | 1,48 | -15,07 | 0,5052 | -0,1089 | |||
| CNQ / Canadian Natural Resources Limited | 0,05 | 8,43 | 1,48 | 2,43 | 0,5047 | -0,0041 | |||
| NSRGY / Nestlé S.A. - Depositary Receipt (Common Stock) | 0,01 | 0,00 | 1,47 | 25,36 | 0,5037 | 0,0886 | |||
| CCK / Crown Holdings, Inc. | 0,01 | 9,50 | 1,44 | 20,05 | 0,4934 | 0,0690 | |||
| REC / Recordati Industria Chimica e Farmaceutica S.p.A. | 0,02 | 9,46 | 1,43 | 5,47 | 0,4880 | 0,0103 | |||
| SHEL / Shell plc | 0,04 | 11,62 | 1,39 | 9,70 | 0,4756 | 0,0279 | |||
| AIR / Airbus SE | 0,01 | 0,00 | 1,34 | -1,90 | 0,4593 | -0,0242 | |||
| VK / Vallourec S.A. | 0,07 | 287,10 | 1,33 | 275,42 | 0,4547 | 0,3294 | |||
| TOYOF / Toyota Motor Corporation | 0,07 | 9,86 | 1,32 | 10,65 | 0,4510 | 0,0300 | |||
| AMT / American Tower Corporation | 0,01 | 13,67 | 1,31 | 38,58 | 0,4484 | 0,1142 | |||
| CMCSA / Comcast Corporation | 0,04 | 0,26 | 1,30 | 1,88 | 0,4457 | -0,0061 | |||
| GALD / Galderma Group AG | 0,01 | 34,97 | 1,30 | 28,97 | 0,4447 | 0,0888 | |||
| CPK / Capcom Co., Ltd. | 0,04 | 0,00 | 1,28 | 26,73 | 0,4378 | 0,0812 | |||
| T / AT&T Inc. | 0,05 | 0,00 | 1,26 | 16,77 | 0,4308 | 0,0497 | |||
| GS71 / GSK plc | 0,06 | 0,00 | 1,24 | 13,55 | 0,4240 | 0,0385 | |||
| JCI / Johnson Controls International plc | 0,01 | 0,00 | 1,22 | 7,58 | 0,4173 | 0,0167 | |||
| AAGIY / AIA Group Limited - Depositary Receipt (Common Stock) | 0,16 | 0,00 | 1,21 | 6,58 | 0,4152 | 0,0129 | |||
| CFRUY / Compagnie Financière Richemont SA - Depositary Receipt (Common Stock) | 0,01 | 0,00 | 1,21 | -8,62 | 0,4132 | -0,0536 | |||
| BJ / BJ's Wholesale Club Holdings, Inc. | 0,01 | 0,00 | 1,16 | 18,71 | 0,3951 | 0,0514 | |||
| SAN / Santander UK plc - Preferred Stock | 0,01 | 0,00 | 1,15 | 0,61 | 0,3931 | -0,0102 | |||
| CAP / Capgemini SE | 0,01 | 0,00 | 1,13 | -12,16 | 0,3880 | -0,0680 | |||
| KDP / Keurig Dr Pepper Inc. | 0,03 | 0,00 | 1,13 | 7,74 | 0,3858 | 0,0161 | |||
| HES / Hess Corporation | 0,01 | 0,00 | 1,11 | -7,20 | 0,3793 | -0,0427 | |||
| VZ / Verizon Communications Inc. | 0,02 | 12,68 | 1,10 | 26,12 | 0,3748 | 0,0677 | |||
| UCBJY / UCB SA - Depositary Receipt (Common Stock) | 0,01 | 0,00 | 1,08 | -6,56 | 0,3702 | -0,0386 | |||
| QBCRF / Quebecor Inc. | 0,04 | 0,00 | 1,08 | 23,57 | 0,3695 | 0,0608 | |||
| DANOY / Danone S.A. - Depositary Receipt (Common Stock) | 0,01 | 0,00 | 1,08 | 22,86 | 0,3677 | 0,0586 | |||
| SIKA / Sika AG | 0,00 | 0,00 | 1,02 | -1,54 | 0,3495 | -0,0173 | |||
| ELISA / Elisa Oyj | 0,02 | 0,00 | 1,02 | 23,52 | 0,3487 | 0,0574 | |||
| BLK / BlackRock, Inc. | 0,00 | 0,00 | 1,01 | -15,05 | 0,3438 | -0,0738 | |||
| NSC / Norfolk Southern Corporation | 0,00 | 0,00 | 0,96 | -12,22 | 0,3294 | -0,0582 | |||
| RLDCF / Roland Corporation | 0,04 | 14,63 | 0,92 | -0,33 | 0,3143 | -0,0114 | |||
| GD / General Dynamics Corporation | 0,00 | 0,00 | 0,90 | 5,87 | 0,3087 | 0,0077 | |||
| RNECY / Renesas Electronics Corporation - Depositary Receipt (Common Stock) | 0,08 | 0,00 | 0,89 | -12,46 | 0,3028 | -0,0541 | |||
| CR / Crane Company | 0,01 | 0,00 | 0,87 | -5,53 | 0,2980 | -0,0276 | |||
| QSR / Restaurant Brands International Inc. | 0,01 | 0,00 | 0,87 | 4,70 | 0,2974 | 0,0044 | |||
| MSCI / MSCI Inc. | 0,00 | 23,27 | 0,87 | 12,61 | 0,2961 | 0,0246 | |||
| APO / Apollo Global Management, Inc. | 0,01 | 0,00 | 0,86 | -20,24 | 0,2939 | -0,0863 | |||
| WEC / WEC Energy Group, Inc. | 0,01 | 0,00 | 0,84 | 10,33 | 0,2889 | 0,0185 | |||
| LYG / Lloyds Banking Group plc - Depositary Receipt (Common Stock) | 0,86 | 0,00 | 0,84 | 27,69 | 0,2888 | 0,0554 | |||
| FQVLF / First Quantum Minerals Ltd. | 0,06 | 15,95 | 0,82 | 24,28 | 0,2803 | 0,0476 | |||
| KRYAY / Kerry Group plc - Depositary Receipt (Common Stock) | 0,01 | 0,00 | 0,80 | 2,69 | 0,2745 | -0,0015 | |||
| TGNA / TEGNA Inc. | 0,00 | 0,77 | 0,2618 | 0,2618 | |||||
| TGT / Target Corporation | 0,01 | 0,00 | 0,75 | -29,96 | 0,2560 | -0,1210 | |||
| AIBGY / AIB Group plc - Depositary Receipt (Common Stock) | 0,11 | 0,00 | 0,75 | 13,85 | 0,2557 | 0,0236 | |||
| PFDL / Premier Foods plc | 0,27 | 0,00 | 0,73 | 13,99 | 0,2481 | 0,0234 | |||
| HOCPY / HOYA Corporation - Depositary Receipt (Common Stock) | 0,01 | 0,00 | 0,72 | -12,39 | 0,2467 | -0,0440 | |||
| FCX / Freeport-McMoRan Inc. | 0,02 | -43,51 | 0,71 | -43,25 | 0,2415 | -0,1977 | |||
| T2V1 / Tryg A/S | 0,03 | 0,00 | 0,69 | 17,63 | 0,2373 | 0,0290 | |||
| AVGO / Broadcom Inc. | 0,00 | 16,24 | 0,69 | 1,03 | 0,2355 | -0,0050 | |||
| MDLZ / Mondelez International, Inc. | 0,01 | 0,00 | 0,68 | 17,57 | 0,2313 | 0,0280 | |||
| BLL / Ball Corp. | 0,01 | 0,00 | 0,67 | -6,82 | 0,2290 | -0,0246 | |||
| DEO / Diageo plc - Depositary Receipt (Common Stock) | 0,02 | 0,00 | 0,67 | -5,78 | 0,2287 | -0,0218 | |||
| EENEF / RS Group plc | 0,10 | 0,00 | 0,66 | -14,90 | 0,2249 | -0,0478 | |||
| BBRYF / Burberry Group plc | 0,07 | 0,65 | 0,2237 | 0,2237 | |||||
| VLTO / Veralto Corporation | 0,01 | 0,00 | 0,64 | -7,26 | 0,2187 | -0,0248 | |||
| AMUN / Amundi S.A. | 0,01 | 0,00 | 0,62 | 11,25 | 0,2132 | 0,0155 | |||
| BME1 N / B&M European Value Retail S.A. | 0,13 | 27,75 | 0,59 | 42,72 | 0,2011 | 0,0554 | |||
| HDB / HDFC Bank Limited - Depositary Receipt (Common Stock) | 0,01 | 1,29 | 0,57 | 21,44 | 0,1958 | 0,0293 | |||
| PCG / PG&E Corporation | 0,03 | 0,00 | 0,56 | 5,63 | 0,1925 | 0,0042 | |||
| G7W / Games Workshop Group PLC | 0,00 | 0,00 | 0,55 | 13,76 | 0,1896 | 0,0175 | |||
| SBUX / Starbucks Corporation | 0,01 | 0,00 | 0,55 | -25,61 | 0,1888 | -0,0735 | |||
| NNW0 / Naspers Limited | 0,00 | 0,00 | 0,50 | 24,75 | 0,1708 | 0,0294 | |||
| ACI / Albertsons Companies, Inc. | 0,02 | 0,00 | 0,50 | 9,45 | 0,1706 | 0,0099 | |||
| SWX / Southwest Gas Holdings, Inc. | 0,01 | 0,00 | 0,49 | -3,16 | 0,1679 | -0,0114 | |||
| H2X3 / Hiscox Ltd | 0,03 | 3,91 | 0,47 | 12,29 | 0,1596 | 0,0128 | |||
| PSX / Phillips 66 | 0,00 | 0,00 | 0,46 | -11,82 | 0,1557 | -0,0264 | |||
| VLO / Valero Energy Corporation | 0,00 | 2,95 | 0,41 | -10,20 | 0,1385 | -0,0207 | |||
| SMSOF / Samsonite Group S.A. | 0,20 | 0,00 | 0,36 | -38,16 | 0,1244 | -0,0829 | |||
| H11 / Halma plc | 0,01 | 0,00 | 0,33 | -2,65 | 0,1130 | -0,0069 | |||
| EAR / Ebara Corporation | 0,02 | 0,00 | 0,28 | -9,00 | 0,0971 | -0,0128 | |||
| CVE / Cenovus Energy Inc. | 0,02 | 0,00 | 0,28 | -18,73 | 0,0966 | -0,0259 | |||
| CXT / Crane NXT, Co. | 0,01 | 0,00 | 0,28 | -26,72 | 0,0949 | -0,0387 | |||
| STARLING BANK LTD SER D PP / EC (N/A) | 0,08 | 0,27 | 0,0922 | 0,0922 | |||||
| FELTF / Fuji Electric Co., Ltd. | 0,01 | 0,00 | 0,24 | -6,75 | 0,0806 | -0,0086 | |||
| REDINGTON / Redington Limited | 0,07 | 0,00 | 0,21 | 22,49 | 0,0708 | 0,0110 | |||
| SAFCOM / Safaricom PLC | 1,36 | 0,00 | 0,18 | 1,66 | 0,0631 | -0,0009 | |||
| CA21037X1345 / CONSTELLATION SOFTWARE INC | 0,00 | 0,00 | 0,00 | 0,0000 | -0,0000 |