Statistiques de base
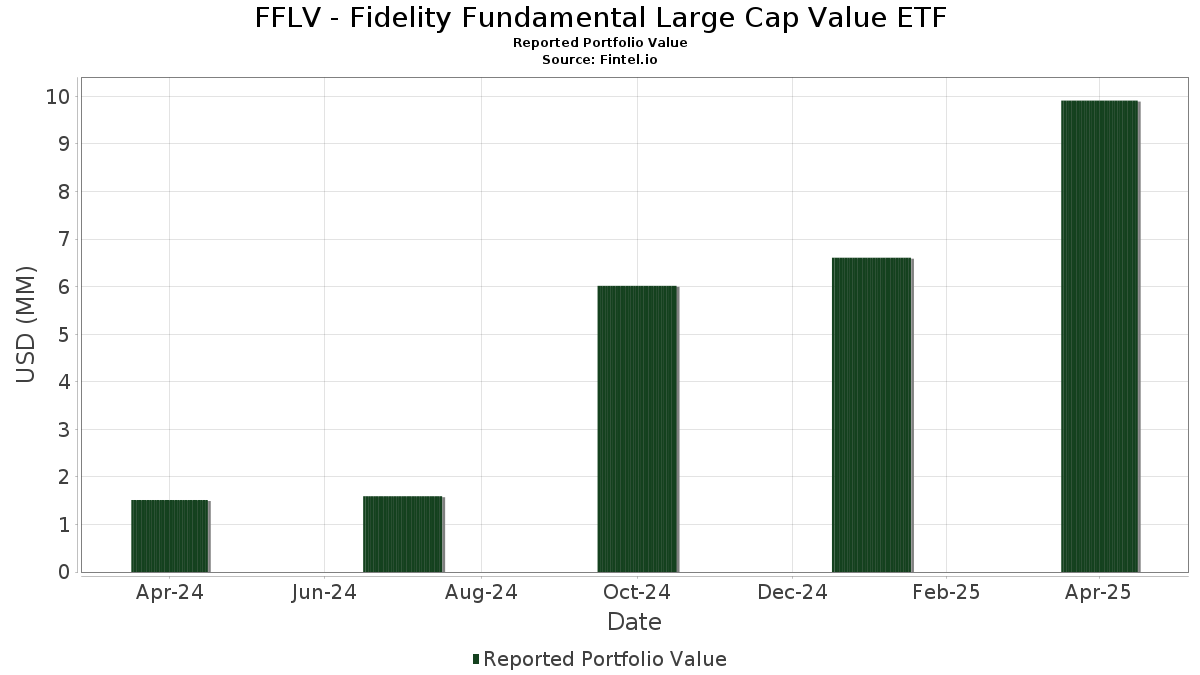
| Valeur du portefeuille | $ 9 913 041 |
| Positions actuelles | 135 |
Dernières positions, performances, ASG (à partir des dépôts 13F, 13D)
FFLV - Fidelity Fundamental Large Cap Value ETF a déclaré un total de 135 positions dans ses derniers dépôts auprès de la SEC. La valeur la plus récente du portefeuille est calculée à 9 913 041 USD. Les actifs sous gestion réels (ASG) sont cette valeur plus les liquidités (qui ne sont pas divulguées). Les principales positions de FFLV - Fidelity Fundamental Large Cap Value ETF sont Exxon Mobil Corporation (US:XOM) , Johnson & Johnson (US:JNJ) , Cisco Systems, Inc. (US:CSCO) , Wells Fargo & Company (US:WFC) , and Fidelity Cash Central Fund (US:US31635A1051) . Les nouvelles positions de FFLV - Fidelity Fundamental Large Cap Value ETF incluent CNH Industrial N.V. (US:CNHI) , Ryder System, Inc. (US:R) , Constellation Brands, Inc. (US:STZ) , The Charles Schwab Corporation (US:SCHW) , and Penske Automotive Group, Inc. (US:PAG) .
Meilleures augmentations ce trimestre
Nous utilisons la variation de l'allocation du portefeuille car il s'agit de l'indicateur le plus significatif. Les changements peuvent être dus à des transactions ou à des variations de prix des actions.
| Titre | Actions (en millions) |
Valeur ($ en millions) |
% du portefeuille | ΔPortefeuille % |
|---|---|---|---|---|
| 0,32 | 0,32 | 3,2623 | 2,4409 | |
| 0,00 | 0,14 | 1,4508 | 0,4578 | |
| 0,00 | 0,04 | 0,4520 | 0,4520 | |
| 0,00 | 0,32 | 3,1748 | 0,4300 | |
| 0,00 | 0,22 | 2,2416 | 0,4182 | |
| 0,00 | 0,04 | 0,3823 | 0,3823 | |
| 0,00 | 0,04 | 0,3713 | 0,3713 | |
| 0,00 | 0,04 | 0,3642 | 0,3642 | |
| 0,00 | 0,15 | 1,4663 | 0,3600 | |
| 0,00 | 0,29 | 2,9422 | 0,3429 |
Principales baisses ce trimestre
Nous utilisons la variation de l'allocation du portefeuille car il s'agit de l'indicateur le plus significatif. Les changements peuvent être dus à des transactions ou à des variations de prix des actions.
| Titre | Actions (en millions) |
Valeur ($ en millions) |
% du portefeuille | ΔPortefeuille % |
|---|---|---|---|---|
| 0,00 | 0,01 | 0,1058 | -1,2441 | |
| 0,00 | 0,08 | 0,8010 | -0,7331 | |
| 0,00 | 0,05 | 0,4620 | -0,6552 | |
| 0,00 | 0,09 | 0,9171 | -0,6073 | |
| 0,00 | 0,00 | -0,5892 | ||
| 0,00 | 0,00 | -0,5664 | ||
| 0,00 | 0,09 | 0,8865 | -0,4961 | |
| 0,00 | 0,16 | 1,6274 | -0,3146 | |
| 0,00 | 0,07 | 0,7458 | -0,3093 | |
| 0,01 | 0,29 | 2,8837 | -0,2953 |
Déclarations 13F et dépôts de fonds
Ce formulaire a été déposé le 2025-06-26 pour la période de déclaration 2025-04-30. Cliquez sur l'icône du lien pour voir l'historique complet des transactions.
Mettre à niveau pour débloquer les données premium et exporter vers Excel ![]() .
.
| Titre | Type | Prix moyen de l'action | Actions (en millions) |
ΔActions (%) |
ΔActions (%) |
Valeur ($ en millions) |
Portefeuille (%) |
ΔPortefeuille (%) |
|
|---|---|---|---|---|---|---|---|---|---|
| XOM / Exxon Mobil Corporation | 0,00 | 58,31 | 0,43 | 56,83 | 4,2825 | 0,1706 | |||
| JNJ / Johnson & Johnson | 0,00 | 47,24 | 0,40 | 51,31 | 4,0691 | 0,0261 | |||
| CSCO / Cisco Systems, Inc. | 0,01 | 51,12 | 0,37 | 44,36 | 3,7353 | -0,1644 | |||
| WFC / Wells Fargo & Company | 0,00 | 58,27 | 0,33 | 42,36 | 3,2876 | -0,1768 | |||
| US31635A1051 / Fidelity Cash Central Fund | 0,32 | 496,97 | 0,32 | 500,00 | 3,2623 | 2,4409 | |||
| HIG / The Hartford Insurance Group, Inc. | 0,00 | 58,08 | 0,32 | 74,03 | 3,1748 | 0,4300 | |||
| TRV / The Travelers Companies, Inc. | 0,00 | 57,92 | 0,29 | 70,76 | 2,9422 | 0,3429 | |||
| BAC / Bank of America Corporation | 0,01 | 58,28 | 0,29 | 36,19 | 2,8837 | -0,2953 | |||
| PM / Philip Morris International Inc. | 0,00 | 40,39 | 0,22 | 85,00 | 2,2416 | 0,4182 | |||
| CMCSA / Comcast Corporation | 0,01 | 58,32 | 0,21 | 60,77 | 2,1124 | 0,1387 | |||
| WELL / Welltower Inc. | 0,00 | 58,12 | 0,20 | 77,48 | 1,9884 | 0,2979 | |||
| USFD / US Foods Holding Corp. | 0,00 | 58,30 | 0,20 | 47,01 | 1,9841 | -0,0508 | |||
| SHEL / Shell plc - Depositary Receipt (Common Stock) | 0,00 | 58,15 | 0,19 | 54,84 | 1,9394 | 0,0571 | |||
| GILD / Gilead Sciences, Inc. | 0,00 | 58,33 | 0,19 | 74,55 | 1,9351 | 0,2593 | |||
| CI / The Cigna Group | 0,00 | 58,15 | 0,17 | 82,61 | 1,6937 | 0,3010 | |||
| APO / Apollo Global Management, Inc. | 0,00 | 57,79 | 0,16 | 25,78 | 1,6274 | -0,3146 | |||
| QCOM / QUALCOMM Incorporated | 0,00 | 70,11 | 0,15 | 45,71 | 1,5477 | -0,0451 | |||
| PLD / Prologis, Inc. | 0,00 | 57,82 | 0,15 | 35,19 | 1,4737 | -0,1639 | |||
| CVS / CVS Health Corporation | 0,00 | 58,33 | 0,15 | 88,31 | 1,4667 | 0,2880 | |||
| LMT / Lockheed Martin Corporation | 0,00 | 93,04 | 0,15 | 98,63 | 1,4663 | 0,3600 | |||
| CRH / CRH plc | 0,00 | 127,90 | 0,14 | 121,54 | 1,4508 | 0,4578 | |||
| MRK / Merck & Co., Inc. | 0,00 | 57,84 | 0,14 | 36,19 | 1,4412 | -0,1505 | |||
| SJM / The J. M. Smucker Company | 0,00 | 57,77 | 0,13 | 72,73 | 1,3420 | 0,1667 | |||
| UNH / UnitedHealth Group Incorporated | 0,00 | 96,64 | 0,12 | 50,00 | 1,2131 | -0,0094 | |||
| NOC / Northrop Grumman Corporation | 0,00 | 48,15 | 0,12 | 48,72 | 1,1749 | -0,0189 | |||
| TRGP / Targa Resources Corp. | 0,00 | 57,65 | 0,11 | 37,35 | 1,1522 | -0,1128 | |||
| PCG / PG&E Corporation | 0,01 | 58,33 | 0,11 | 66,18 | 1,1465 | 0,1155 | |||
| COR / Cencora, Inc. | 0,00 | 56,22 | 0,11 | 79,37 | 1,1456 | 0,1883 | |||
| G / Genpact Limited | 0,00 | 75,32 | 0,11 | 81,97 | 1,1243 | 0,1906 | |||
| KDP / Keurig Dr Pepper Inc. | 0,00 | 58,25 | 0,11 | 71,88 | 1,1121 | 0,1319 | |||
| AZN / AstraZeneca PLC - Depositary Receipt (Common Stock) | 0,00 | 58,09 | 0,11 | 61,19 | 1,0872 | 0,0684 | |||
| SRE / Sempra | 0,00 | 86,38 | 0,11 | 68,25 | 1,0739 | 0,1069 | |||
| CLNX / Cellnex Telecom, S.A. | 0,00 | 58,33 | 0,10 | 92,59 | 1,0498 | 0,2205 | |||
| BRK.B / Berkshire Hathaway Inc. | 0,00 | 58,33 | 0,10 | 80,36 | 1,0195 | 0,1690 | |||
| AFG / American Financial Group, Inc. | 0,00 | 58,21 | 0,09 | 46,77 | 0,9215 | -0,0224 | |||
| CNQ / Canadian Natural Resources Limited | 0,00 | -4,28 | 0,09 | -9,00 | 0,9171 | -0,6073 | |||
| CNC / Centene Corporation | 0,00 | 58,15 | 0,09 | 46,67 | 0,8943 | -0,0150 | |||
| KVUE / Kenvue Inc. | 0,00 | -13,06 | 0,09 | -3,30 | 0,8865 | -0,4961 | |||
| SGI / Somnigroup International Inc. | 0,00 | 58,00 | 0,08 | 52,73 | 0,8553 | 0,0140 | |||
| UHAL / U-Haul Holding Company | 0,00 | 58,12 | 0,08 | 33,33 | 0,8117 | -0,1041 | |||
| ALSN / Allison Transmission Holdings, Inc. | 0,00 | 0,00 | 0,08 | -21,78 | 0,8010 | -0,7331 | |||
| JPM / JPMorgan Chase & Co. | 0,00 | 16,09 | 0,07 | 7,25 | 0,7458 | -0,3093 | |||
| CB / Chubb Limited | 0,00 | 15,62 | 0,07 | 23,33 | 0,7456 | -0,1755 | |||
| WCC / WESCO International, Inc. | 0,00 | 87,56 | 0,07 | 65,85 | 0,6920 | 0,0625 | |||
| WLK / Westlake Corporation | 0,00 | 58,09 | 0,07 | 28,30 | 0,6911 | -0,1212 | |||
| SMURFIT WESTROCK PLC / EC (IE00028FXN24) | 0,00 | 69,91 | 0,07 | 36,00 | 0,6875 | -0,0809 | |||
| ABBV / AbbVie Inc. | 0,00 | 177,60 | 0,07 | 204,55 | 0,6812 | 0,3336 | |||
| TSM / Taiwan Semiconductor Manufacturing Company Limited - Depositary Receipt (Common Stock) | 0,00 | 57,20 | 0,07 | 26,42 | 0,6776 | -0,1359 | |||
| TKR / The Timken Company | 0,00 | 39,61 | 0,06 | 12,28 | 0,6517 | -0,2248 | |||
| RS / Reliance, Inc. | 0,00 | 112,12 | 0,06 | 114,29 | 0,6091 | 0,1756 | |||
| BLK / BlackRock, Inc. | 0,00 | 46,67 | 0,06 | 25,00 | 0,6072 | -0,1248 | |||
| BLDR / Builders FirstSource, Inc. | 0,00 | 250,00 | 0,06 | 147,83 | 0,5814 | 0,2323 | |||
| GOOGL / Alphabet Inc. | 0,00 | 58,33 | 0,06 | 23,91 | 0,5769 | -0,1266 | |||
| JBL / Jabil Inc. | 0,00 | 56,22 | 0,06 | 42,50 | 0,5737 | -0,0379 | |||
| LOW / Lowe's Companies, Inc. | 0,00 | 57,23 | 0,06 | 34,15 | 0,5624 | -0,0629 | |||
| US7587501039 / Regal-Beloit Corp. | 0,00 | 77,21 | 0,06 | 19,57 | 0,5549 | -0,1509 | |||
| KEY / KeyCorp | 0,00 | 58,26 | 0,05 | 30,00 | 0,5310 | -0,0800 | |||
| ATMU / Atmus Filtration Technologies Inc. | 0,00 | 51,29 | 0,05 | 26,32 | 0,4909 | -0,0973 | |||
| DOX / Amdocs Limited | 0,00 | 0,00 | 0,05 | 0,00 | 0,4787 | -0,2376 | |||
| LAD / Lithia Motors, Inc. | 0,00 | 53,85 | 0,05 | 17,95 | 0,4714 | -0,1202 | |||
| PSA / Public Storage | 0,00 | -6,06 | 0,05 | -6,12 | 0,4686 | -0,2763 | |||
| EIX / Edison International | 0,00 | -37,28 | 0,05 | -38,36 | 0,4620 | -0,6552 | |||
| CNHI / CNH Industrial N.V. | 0,00 | 0,04 | 0,4520 | 0,4520 | |||||
| GPK / Graphic Packaging Holding Company | 0,00 | 58,22 | 0,04 | 44,83 | 0,4312 | -0,0127 | |||
| GTES / Gates Industrial Corporation plc | 0,00 | 58,33 | 0,04 | 44,83 | 0,4305 | -0,0164 | |||
| CTVA / Corteva, Inc. | 0,00 | 58,19 | 0,04 | 51,85 | 0,4154 | -0,0001 | |||
| COMP / Compass, Inc. | 0,01 | 58,30 | 0,04 | 69,57 | 0,4001 | 0,0434 | |||
| MOH / Molina Healthcare, Inc. | 0,00 | 53,16 | 0,04 | 62,50 | 0,3982 | 0,0273 | |||
| XPO / XPO, Inc. | 0,00 | 56,84 | 0,04 | 22,58 | 0,3919 | -0,0812 | |||
| KNX / Knight-Swift Transportation Holdings Inc. | 0,00 | 0,04 | 0,3823 | 0,3823 | |||||
| FCFS / FirstCash Holdings, Inc. | 0,00 | 166,35 | 0,04 | 236,36 | 0,3734 | 0,2017 | |||
| R / Ryder System, Inc. | 0,00 | 0,04 | 0,3713 | 0,3713 | |||||
| IP / International Paper Company | 0,00 | 57,76 | 0,04 | 28,57 | 0,3691 | -0,0591 | |||
| UFPI / UFP Industries, Inc. | 0,00 | 56,12 | 0,04 | 33,33 | 0,3680 | -0,0465 | |||
| STZ / Constellation Brands, Inc. | 0,00 | 0,04 | 0,3642 | 0,3642 | |||||
| APTIV PLC / EC (JE00BTDN8H13) | 0,00 | 57,73 | 0,03 | 41,67 | 0,3514 | -0,0149 | |||
| ON / ON Semiconductor Corporation | 0,00 | 102,35 | 0,03 | 54,55 | 0,3444 | 0,0071 | |||
| SUI / Sun Communities, Inc. | 0,00 | 56,00 | 0,03 | 50,00 | 0,3418 | 0,0070 | |||
| DIS / The Walt Disney Company | 0,00 | 34,43 | 0,03 | 10,00 | 0,3359 | -0,1309 | |||
| SCHW / The Charles Schwab Corporation | 0,00 | 0,03 | 0,3309 | 0,3309 | |||||
| GXO / GXO Logistics, Inc. | 0,00 | 195,33 | 0,03 | 146,15 | 0,3231 | 0,1169 | |||
| CPT / Camden Property Trust | 0,00 | 56,98 | 0,03 | 57,89 | 0,3092 | 0,0134 | |||
| UGI / UGI Corporation | 0,00 | 194,64 | 0,03 | 233,33 | 0,3082 | 0,1609 | |||
| LNG / Cheniere Energy, Inc. | 0,00 | 51,22 | 0,03 | 55,56 | 0,2884 | 0,0110 | |||
| LNTH / Lantheus Holdings, Inc. | 0,00 | 164,95 | 0,03 | 225,00 | 0,2698 | 0,1341 | |||
| CVE / Cenovus Energy Inc. | 0,00 | 58,29 | 0,03 | 25,00 | 0,2612 | -0,0435 | |||
| GMS / GMS Inc. | 0,00 | 8,26 | 0,03 | -7,41 | 0,2610 | -0,1561 | |||
| AES / The AES Corporation | 0,00 | 23,26 | 0,03 | 13,64 | 0,2586 | -0,0883 | |||
| PAG / Penske Automotive Group, Inc. | 0,00 | 0,03 | 0,2553 | 0,2553 | |||||
| DKS / DICK'S Sporting Goods, Inc. | 0,00 | 0,03 | 0,2531 | 0,2531 | |||||
| FSLR / First Solar, Inc. | 0,00 | 0,03 | 0,2520 | 0,2520 | |||||
| VNT / Vontier Corporation | 0,00 | 57,95 | 0,02 | 35,29 | 0,2321 | -0,0355 | |||
| CNXC / Concentrix Corporation | 0,00 | 57,91 | 0,02 | 57,14 | 0,2256 | 0,0058 | |||
| SLM / SLM Corporation | 0,00 | 474,07 | 0,02 | 1 000,00 | 0,2255 | 0,1758 | |||
| HRI / Herc Holdings Inc. | 0,00 | 56,00 | 0,02 | -16,00 | 0,2147 | -0,1708 | |||
| PSX / Phillips 66 | 0,00 | 107,53 | 0,02 | 100,00 | 0,2021 | 0,0363 | |||
| CAP / Capgemini SE | 0,00 | 55,26 | 0,02 | 38,46 | 0,1881 | -0,0217 | |||
| CEG / Constellation Energy Corporation | 0,00 | 310,00 | 0,02 | 260,00 | 0,1844 | 0,0936 | |||
| WEX / WEX Inc. | 0,00 | 218,60 | 0,02 | 142,86 | 0,1797 | 0,0601 | |||
| NXST / Nexstar Media Group, Inc. | 0,00 | 54,55 | 0,02 | 54,55 | 0,1792 | 0,0008 | |||
| FCNCA / First Citizens BancShares, Inc. | 0,00 | 25,00 | 0,02 | 0,00 | 0,1790 | -0,0877 | |||
| GTM / ZoomInfo Technologies Inc. | 0,00 | 58,33 | 0,02 | 30,77 | 0,1768 | -0,0249 | |||
| 1AC / PennyMac Financial Services, Inc. | 0,00 | 0,02 | 0,1686 | 0,1686 | |||||
| COKE / Coca-Cola Consolidated, Inc. | 0,00 | 0,01 | 0,1501 | 0,1501 | |||||
| UPBD / Upbound Group, Inc. | 0,00 | 57,72 | 0,01 | 7,69 | 0,1494 | -0,0605 | |||
| BGC / BGC Group, Inc. | 0,00 | 123,06 | 0,01 | 133,33 | 0,1491 | 0,0433 | |||
| VZ / Verizon Communications Inc. | 0,00 | 56,57 | 0,01 | 85,71 | 0,1374 | 0,0195 | |||
| BCO / The Brink's Company | 0,00 | 57,73 | 0,01 | 44,44 | 0,1374 | 0,0005 | |||
| EWBC / East West Bancorp, Inc. | 0,00 | 54,90 | 0,01 | 30,00 | 0,1360 | -0,0228 | |||
| BTSG / BrightSpring Health Services, Inc. | 0,00 | 0,01 | 0,1295 | 0,1295 | |||||
| HGV / Hilton Grand Vacations Inc. | 0,00 | 0,01 | 0,1245 | 0,1245 | |||||
| QDEL / QuidelOrtho Corporation | 0,00 | 56,69 | 0,01 | 0,00 | 0,1244 | -0,0622 | |||
| TEX / Terex Corporation | 0,00 | 49,13 | 0,01 | 9,09 | 0,1215 | -0,0458 | |||
| VSTS / Vestis Corporation | 0,00 | 58,13 | 0,01 | 0,00 | 0,1209 | -0,0625 | |||
| ET / Energy Transfer LP - Limited Partnership | 0,00 | 0,01 | 0,1173 | 0,1173 | |||||
| BCC / Boise Cascade Company | 0,00 | 0,01 | 0,1173 | 0,1173 | |||||
| SNX / TD SYNNEX Corporation | 0,00 | 50,00 | 0,01 | 22,22 | 0,1171 | -0,0338 | |||
| DAR / Darling Ingredients Inc. | 0,00 | -16,86 | 0,01 | -26,67 | 0,1134 | -0,1251 | |||
| HSIC / Henry Schein, Inc. | 0,00 | 58,33 | 0,01 | 37,50 | 0,1118 | -0,0189 | |||
| MTB / M&T Bank Corporation | 0,00 | 48,84 | 0,01 | 25,00 | 0,1093 | -0,0215 | |||
| CTRI / Centuri Holdings, Inc. | 0,00 | 0,01 | 0,1072 | 0,1072 | |||||
| FDX / FedEx Corporation | 0,00 | -85,16 | 0,01 | -88,76 | 0,1058 | -1,2441 | |||
| S and P500 EMINI FUT JUN25 ESM5 / DE (N/A) | 0,01 | 0,0940 | 0,0940 | ||||||
| ACHC / Acadia Healthcare Company, Inc. | 0,00 | 57,33 | 0,01 | -20,00 | 0,0859 | -0,0723 | |||
| OMF / OneMain Holdings, Inc. | 0,00 | 0,00 | 0,01 | -20,00 | 0,0857 | -0,0663 | |||
| MHK / Mohawk Industries, Inc. | 0,00 | 53,85 | 0,01 | 33,33 | 0,0856 | -0,0106 | |||
| CIEN / Ciena Corporation | 0,00 | 0,00 | 0,01 | -20,00 | 0,0852 | -0,0809 | |||
| PVH / PVH Corp. | 0,00 | 53,16 | 0,01 | 14,29 | 0,0840 | -0,0231 | |||
| CPRI / Capri Holdings Limited | 0,00 | 0,01 | 0,0739 | 0,0739 | |||||
| SIG / Signet Jewelers Limited | 0,00 | -27,65 | 0,01 | -30,00 | 0,0734 | -0,0789 | |||
| CC / The Chemours Company | 0,00 | 56,29 | 0,01 | 0,00 | 0,0557 | -0,0265 | |||
| CNR / Core Natural Resources, Inc. | 0,00 | 0,00 | 0,0356 | 0,0356 | |||||
| CH1300646267 / Bunge Global SA | 0,00 | 0,00 | 0,00 | 0,00 | 0,0325 | -0,0147 | |||
| FTRE / Fortrea Holdings Inc. | 0,00 | 57,95 | 0,00 | -60,00 | 0,0299 | -0,0469 | |||
| IFSPF / Interfor Corporation | 0,00 | 34,40 | 0,00 | 0,00 | 0,0284 | -0,0102 | |||
| KO / The Coca-Cola Company | 0,00 | -100,00 | 0,00 | -100,00 | -0,5664 | ||||
| RPRX / Royalty Pharma plc | 0,00 | -100,00 | 0,00 | -100,00 | -0,1710 | ||||
| LITE / Lumentum Holdings Inc. | 0,00 | -100,00 | 0,00 | -100,00 | -0,5892 |