Statistiques de base
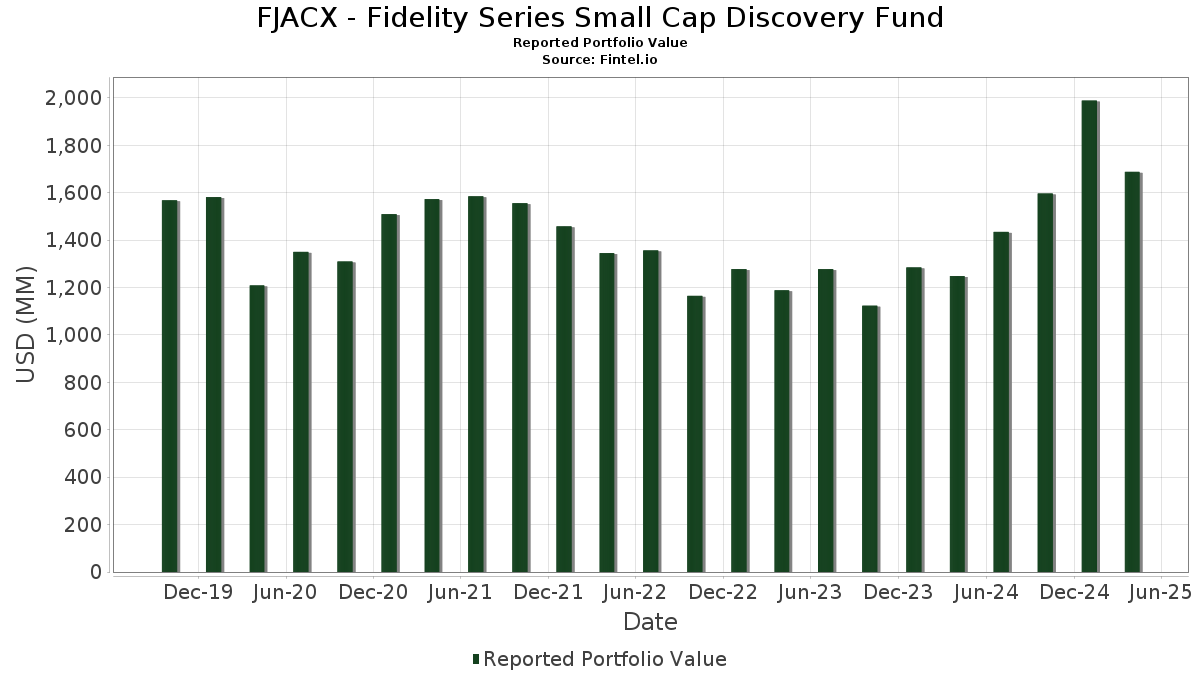
| Valeur du portefeuille | $ 1 687 958 138 |
| Positions actuelles | 140 |
Dernières positions, performances, ASG (à partir des dépôts 13F, 13D)
FJACX - Fidelity Series Small Cap Discovery Fund a déclaré un total de 140 positions dans ses derniers dépôts auprès de la SEC. La valeur la plus récente du portefeuille est calculée à 1 687 958 138 USD. Les actifs sous gestion réels (ASG) sont cette valeur plus les liquidités (qui ne sont pas divulguées). Les principales positions de FJACX - Fidelity Series Small Cap Discovery Fund sont Genpact Limited (US:G) , Performance Food Group Company (US:PFGC) , Insight Enterprises, Inc. (US:NSIT) , Fidelity Securities Lending Cash Central Fund (US:US31635A3032) , and FirstCash Holdings, Inc. (US:FCFS) . Les nouvelles positions de FJACX - Fidelity Series Small Cap Discovery Fund incluent F.N.B. Corporation (US:FNB) , SLM Corporation (US:SLM) , KBR, Inc. (US:KBR) , AXIS Capital Holdings Limited (US:AXS) , and BankUnited, Inc. (DE:BNU) .
Meilleures augmentations ce trimestre
Nous utilisons la variation de l'allocation du portefeuille car il s'agit de l'indicateur le plus significatif. Les changements peuvent être dus à des transactions ou à des variations de prix des actions.
| Titre | Actions (en millions) |
Valeur ($ en millions) |
% du portefeuille | ΔPortefeuille % |
|---|---|---|---|---|
| 1,60 | 32,96 | 2,0102 | 1,4095 | |
| 1,69 | 22,13 | 1,3494 | 1,3494 | |
| 0,74 | 21,26 | 1,2967 | 1,2967 | |
| 0,39 | 20,50 | 1,2499 | 1,2499 | |
| 0,18 | 17,70 | 1,0796 | 1,0796 | |
| 0,60 | 35,57 | 2,1692 | 0,9128 | |
| 0,40 | 13,23 | 0,8066 | 0,8066 | |
| 0,57 | 12,95 | 0,7899 | 0,7899 | |
| 1,68 | 84,23 | 5,1366 | 0,6299 | |
| 0,27 | 21,08 | 1,2857 | 0,5501 |
Principales baisses ce trimestre
Nous utilisons la variation de l'allocation du portefeuille car il s'agit de l'indicateur le plus significatif. Les changements peuvent être dus à des transactions ou à des variations de prix des actions.
| Titre | Actions (en millions) |
Valeur ($ en millions) |
% du portefeuille | ΔPortefeuille % |
|---|---|---|---|---|
| 24,41 | 24,42 | 1,4890 | -3,0313 | |
| 48,82 | 48,83 | 2,9773 | -2,3796 | |
| 0,38 | 11,47 | 0,6996 | -1,0105 | |
| 0,59 | 29,73 | 1,8128 | -0,8199 | |
| 0,30 | 39,94 | 2,4356 | -0,5504 | |
| 0,00 | 0,00 | -0,5347 | ||
| 0,00 | 0,00 | -0,4634 | ||
| 0,06 | 4,10 | 0,2502 | -0,4604 | |
| 0,70 | 26,04 | 1,5881 | -0,4372 | |
| 0,06 | 5,10 | 0,3109 | -0,4349 |
Déclarations 13F et dépôts de fonds
Ce formulaire a été déposé le 2025-06-26 pour la période de déclaration 2025-04-30. Cliquez sur l'icône du lien pour voir l'historique complet des transactions.
Mettre à niveau pour débloquer les données premium et exporter vers Excel ![]() .
.
| Titre | Type | Prix moyen de l'action | Actions (en millions) |
ΔActions (%) |
ΔActions (%) |
Valeur ($ en millions) |
Portefeuille (%) |
ΔPortefeuille (%) |
|
|---|---|---|---|---|---|---|---|---|---|
| G / Genpact Limited | 1,68 | -4,11 | 84,23 | -1,02 | 5,1366 | 0,6299 | |||
| PFGC / Performance Food Group Company | 0,88 | 3,47 | 70,79 | -7,59 | 4,3168 | 0,2599 | |||
| NSIT / Insight Enterprises, Inc. | 0,36 | 1,75 | 49,80 | -18,55 | 3,0370 | -0,2012 | |||
| US31635A3032 / Fidelity Securities Lending Cash Central Fund | 48,82 | -51,73 | 48,83 | -51,73 | 2,9773 | -2,3796 | |||
| FCFS / FirstCash Holdings, Inc. | 0,30 | -42,28 | 39,94 | -29,16 | 2,4356 | -0,5504 | |||
| LITE / Lumentum Holdings Inc. | 0,60 | 116,02 | 35,57 | 49,94 | 2,1692 | 0,9128 | |||
| CROX / Crocs, Inc. | 0,37 | 7,93 | 35,29 | 1,96 | 2,1519 | 0,3190 | |||
| WBS / Webster Financial Corporation | 0,71 | 4,61 | 33,73 | -17,86 | 2,0568 | -0,1179 | |||
| MMS / Maximus, Inc. | 0,50 | -1,18 | 33,16 | -12,11 | 2,0218 | 0,0240 | |||
| ONB / Old National Bancorp | 1,60 | 236,63 | 32,96 | 190,61 | 2,0102 | 1,4095 | |||
| PRI / Primerica, Inc. | 0,12 | 0,00 | 30,87 | -9,69 | 1,8826 | 0,0723 | |||
| IESC / IES Holdings, Inc. | 0,16 | 2,50 | 30,65 | -8,90 | 1,8693 | 0,0874 | |||
| ASGN / ASGN Incorporated | 0,59 | 4,70 | 29,73 | -40,20 | 1,8128 | -0,8199 | |||
| LAUR / Laureate Education, Inc. | 1,47 | 0,00 | 29,49 | 7,21 | 1,7981 | 0,3416 | |||
| SF / Stifel Financial Corp. | 0,34 | 2,26 | 29,41 | -24,36 | 1,7933 | -0,2656 | |||
| BCO / The Brink's Company | 0,30 | 1,76 | 26,84 | -2,70 | 1,6367 | 0,1759 | |||
| WNS / WNS (Holdings) Limited | 0,44 | 13,48 | 26,44 | 12,13 | 1,6120 | 0,3635 | |||
| BIPC / Brookfield Infrastructure Corporation | 0,70 | -24,12 | 26,04 | -31,90 | 1,5881 | -0,4372 | |||
| US31635A1051 / Fidelity Cash Central Fund | 24,41 | -71,39 | 24,42 | -71,39 | 1,4890 | -3,0313 | |||
| BRC / Brady Corporation | 0,33 | 11,02 | 23,36 | 4,76 | 1,4242 | 0,2436 | |||
| EVTC / EVERTEC, Inc. | 0,66 | 0,43 | 22,40 | 4,97 | 1,3658 | 0,2358 | |||
| FNB / F.N.B. Corporation | 1,69 | 22,13 | 1,3494 | 1,3494 | |||||
| SLM / SLM Corporation | 0,74 | 21,26 | 1,2967 | 1,2967 | |||||
| PKIUF / Parkland Corporation | 0,84 | 0,00 | 21,16 | 13,18 | 1,2901 | 0,3002 | |||
| SANM / Sanmina Corporation | 0,27 | 65,51 | 21,08 | 51,79 | 1,2857 | 0,5501 | |||
| KBR / KBR, Inc. | 0,39 | 20,50 | 1,2499 | 1,2499 | |||||
| VEC / V2X Inc | 0,41 | 1,76 | 20,46 | -2,87 | 1,2475 | 0,1321 | |||
| ASO / Academy Sports and Outdoors, Inc. | 0,52 | 23,93 | 19,61 | -10,73 | 1,1959 | 0,0325 | |||
| EXLS / ExlService Holdings, Inc. | 0,40 | 1,75 | 19,40 | -1,85 | 1,1831 | 0,1363 | |||
| TGLS / Tecnoglass Inc. | 0,27 | 1,76 | 19,40 | -4,58 | 1,1831 | 0,1064 | |||
| FN / Fabrinet | 0,09 | 19,61 | 19,01 | 13,45 | 1,1592 | 0,2718 | |||
| GMS / GMS Inc. | 0,26 | 27,59 | 18,94 | 10,83 | 1,1550 | 0,2499 | |||
| LNTH / Lantheus Holdings, Inc. | 0,18 | 1,75 | 18,85 | 14,76 | 1,1497 | 0,2796 | |||
| BWIN / The Baldwin Insurance Group, Inc. | 0,45 | 1,77 | 18,65 | 3,44 | 1,1372 | 0,1824 | |||
| AIZ / Assurant, Inc. | 0,10 | 1,69 | 18,60 | -8,92 | 1,1342 | 0,0527 | |||
| SNX / TD SYNNEX Corporation | 0,17 | 29,86 | 18,36 | 0,96 | 1,1196 | 0,1566 | |||
| AXS / AXIS Capital Holdings Limited | 0,18 | 17,70 | 1,0796 | 1,0796 | |||||
| EXP / Eagle Materials Inc. | 0,07 | 1,59 | 15,96 | -10,42 | 0,9733 | 0,0297 | |||
| UFPI / UFP Industries, Inc. | 0,16 | 1,72 | 15,75 | -13,05 | 0,9602 | 0,0011 | |||
| SIGI / Selective Insurance Group, Inc. | 0,18 | 81,31 | 15,48 | 87,99 | 0,9442 | 0,5080 | |||
| THC / Tenet Healthcare Corporation | 0,11 | 37,94 | 15,44 | 39,96 | 0,9413 | 0,3572 | |||
| CADE / Cadence Bank | 0,51 | 17,22 | 15,02 | -2,56 | 0,9160 | 0,0996 | |||
| RGA / Reinsurance Group of America, Incorporated | 0,08 | 43,74 | 14,40 | 18,16 | 0,8784 | 0,2328 | |||
| BDC / Belden Inc. | 0,13 | 1,74 | 13,84 | -9,93 | 0,8438 | 0,0302 | |||
| BNU / BankUnited, Inc. | 0,40 | 13,23 | 0,8066 | 0,8066 | |||||
| HAFC / Hanmi Financial Corporation | 0,57 | 12,95 | 0,7899 | 0,7899 | |||||
| CYTK / Cytokinetics, Incorporated | 0,29 | 1,76 | 12,62 | -11,86 | 0,7693 | 0,0113 | |||
| KD / Kyndryl Holdings, Inc. | 0,38 | 8,81 | 12,41 | -7,07 | 0,7570 | 0,0496 | |||
| MLI / Mueller Industries, Inc. | 0,16 | 5,41 | 11,75 | -1,53 | 0,7164 | 0,0845 | |||
| CSV / Carriage Services, Inc. | 0,29 | 21,61 | 11,72 | 18,67 | 0,7144 | 0,1916 | |||
| HAE / Haemonetics Corporation | 0,19 | 1,76 | 11,68 | -7,13 | 0,7122 | 0,0462 | |||
| ROCK / Gibraltar Industries, Inc. | 0,22 | 8,76 | 11,63 | -6,16 | 0,7094 | 0,0529 | |||
| TENB / Tenable Holdings, Inc. | 0,38 | -49,92 | 11,47 | -64,48 | 0,6996 | -1,0105 | |||
| PLUS / ePlus inc. | 0,17 | 1,70 | 10,83 | -20,63 | 0,6606 | -0,0622 | |||
| WEX / WEX Inc. | 0,08 | 1,72 | 10,81 | -27,89 | 0,6590 | -0,1346 | |||
| ENSG / The Ensign Group, Inc. | 0,08 | 29,82 | 10,16 | 19,90 | 0,6198 | 0,1709 | |||
| LPX / Louisiana-Pacific Corporation | 0,11 | 1,71 | 9,78 | -24,96 | 0,5963 | -0,0938 | |||
| PENG / Penguin Solutions, Inc. | 0,57 | 1,76 | 9,66 | -14,35 | 0,5890 | -0,0082 | |||
| MTX / Minerals Technologies Inc. | 0,18 | 4,82 | 9,43 | -29,49 | 0,5748 | -0,1331 | |||
| BLD / TopBuild Corp. | 0,03 | 1,93 | 9,38 | -12,03 | 0,5717 | 0,0073 | |||
| NOG / Northern Oil and Gas, Inc. | 0,36 | 1,51 | 8,84 | -31,39 | 0,5391 | -0,1433 | |||
| OUT / OUTFRONT Media Inc. | 0,58 | 17,33 | 8,72 | -3,52 | 0,5316 | 0,0531 | |||
| DIOD / Diodes Incorporated | 0,22 | 1,72 | 8,61 | -33,77 | 0,5250 | -0,1634 | |||
| KFRC / Kforce Inc. | 0,22 | 0,00 | 8,53 | -31,46 | 0,5201 | -0,1389 | |||
| ATI / ATI Inc. | 0,16 | 41,47 | 8,50 | 34,77 | 0,5181 | 0,1842 | |||
| SPSC / SPS Commerce, Inc. | 0,06 | 2,30 | 8,29 | -20,51 | 0,5058 | -0,0468 | |||
| CHRD / Chord Energy Corporation | 0,09 | 1,77 | 8,29 | -18,33 | 0,5055 | -0,0321 | |||
| ELAN / Elanco Animal Health Incorporated | 0,87 | 1,87 | 8,24 | -19,73 | 0,5026 | -0,0411 | |||
| VOYA / Voya Financial, Inc. | 0,14 | 47,60 | 8,21 | 23,11 | 0,5003 | 0,1473 | |||
| OVV / Ovintiv Inc. | 0,24 | 9,35 | 7,97 | -13,02 | 0,4859 | 0,0007 | |||
| CBZ / CBIZ, Inc. | 0,11 | 9,72 | 7,76 | -12,92 | 0,4734 | 0,0013 | |||
| GPOR / Gulfport Energy Corporation | 0,04 | 2,33 | 7,57 | -1,12 | 0,4618 | 0,0562 | |||
| IBP / Installed Building Products, Inc. | 0,05 | 2,48 | 7,53 | -14,53 | 0,4591 | -0,0074 | |||
| HASI / HA Sustainable Infrastructure Capital, Inc. | 0,30 | 2,14 | 7,52 | -8,91 | 0,4588 | 0,0214 | |||
| WEAV / Weave Communications, Inc. | 0,70 | 1 081,59 | 7,43 | 668,05 | 0,4529 | 0,4017 | |||
| CVCO / Cavco Industries, Inc. | 0,01 | 18,19 | 7,38 | 14,75 | 0,4501 | 0,1095 | |||
| DXPE / DXP Enterprises, Inc. | 0,08 | 2,58 | 7,04 | -10,41 | 0,4291 | 0,0131 | |||
| REVG / REV Group, Inc. | 0,20 | -0,73 | 6,70 | -6,44 | 0,4085 | 0,0293 | |||
| UGI / UGI Corporation | 0,20 | 2,72 | 6,57 | 9,60 | 0,4005 | 0,0832 | |||
| GTES / Gates Industrial Corporation plc | 0,33 | -21,10 | 6,31 | -27,84 | 0,3848 | -0,0784 | |||
| CRS / Carpenter Technology Corporation | 0,03 | 0,00 | 6,26 | 1,33 | 0,3817 | 0,0545 | |||
| ANF / Abercrombie & Fitch Co. | 0,09 | 6,21 | 0,3784 | 0,3784 | |||||
| CLDX / Celldex Therapeutics, Inc. | 0,29 | 2,82 | 6,07 | -12,55 | 0,3701 | 0,0026 | |||
| WHD / Cactus, Inc. | 0,15 | 35,29 | 5,74 | -14,03 | 0,3501 | -0,0036 | |||
| PNTG / The Pennant Group, Inc. | 0,21 | 3,61 | 5,29 | 0,30 | 0,3225 | 0,0432 | |||
| ATGE / Adtalem Global Education Inc. | 0,05 | 42,31 | 5,11 | 41,10 | 0,3115 | 0,1197 | |||
| AZZ / AZZ Inc. | 0,06 | -64,21 | 5,10 | -63,80 | 0,3109 | -0,4349 | |||
| WTFC / Wintrust Financial Corporation | 0,04 | 78,40 | 4,96 | 124,14 | 0,3023 | 0,1575 | |||
| PCVX / Vaxcyte, Inc. | 0,13 | 1,74 | 4,81 | -58,71 | 0,2933 | -0,3237 | |||
| BTSG / BrightSpring Health Services, Inc. | 0,27 | 0,00 | 4,80 | -25,73 | 0,2928 | -0,0495 | |||
| RUSHA / Rush Enterprises, Inc. | 0,09 | -7,11 | 4,72 | -22,03 | 0,2880 | -0,0328 | |||
| CAL / Caleres, Inc. | 0,30 | 7,66 | 4,63 | -10,48 | 0,2822 | 0,0084 | |||
| JBTM / JBT Marel Corporation | 0,04 | 3,80 | 4,60 | -17,86 | 0,2805 | -0,0160 | |||
| CEU / CES Energy Solutions Corp. | 1,00 | 0,00 | 4,42 | -25,56 | 0,2696 | -0,0449 | |||
| US82983N1081 / Sitio Royalties Corp | 0,25 | 0,00 | 4,20 | -15,78 | 0,2558 | -0,0080 | |||
| KNF / Knife River Corporation | 0,04 | 4,66 | 4,19 | -5,65 | 0,2557 | 0,0203 | |||
| CIEN / Ciena Corporation | 0,06 | -60,33 | 4,10 | -69,42 | 0,2502 | -0,4604 | |||
| VRNS / Varonis Systems, Inc. | 0,09 | 4,73 | 3,98 | -1,07 | 0,2429 | 0,0296 | |||
| VMI / Valmont Industries, Inc. | 0,01 | 4,66 | 3,95 | -7,51 | 0,2411 | 0,0147 | |||
| CNR / Core Natural Resources, Inc. | 0,05 | 4,72 | 3,84 | -16,30 | 0,2343 | -0,0088 | |||
| BOOT / Boot Barn Holdings, Inc. | 0,03 | 17,77 | 3,53 | -23,61 | 0,2151 | -0,0294 | |||
| ARCB / ArcBest Corporation | 0,06 | -42,31 | 3,44 | -64,70 | 0,2097 | -0,3061 | |||
| MWA / Mueller Water Products, Inc. | 0,12 | 3,20 | 0,1952 | 0,1952 | |||||
| PRMB / Primo Brands Corporation | 0,09 | 19,38 | 3,10 | 20,50 | 0,1890 | 0,0528 | |||
| GG00BMG42V42 / Super Group SGHC Ltd. | 0,38 | 243,21 | 3,09 | 244,80 | 0,1882 | 0,1408 | |||
| SLNO / Soleno Therapeutics, Inc. | 0,04 | 5,73 | 3,04 | 57,62 | 0,1853 | 0,0832 | |||
| AEO / American Eagle Outfitters, Inc. | 0,28 | 4,92 | 2,90 | -31,56 | 0,1767 | -0,0475 | |||
| KBH / KB Home | 0,05 | 2,68 | 0,1634 | 0,1634 | |||||
| WK / Workiva Inc. | 0,03 | 2,62 | 0,1597 | 0,1597 | |||||
| SHOO / Steven Madden, Ltd. | 0,12 | 2,44 | 0,1487 | 0,1487 | |||||
| EBC / Eastern Bankshares, Inc. | 0,16 | 2,41 | 0,1471 | 0,1471 | |||||
| TVTX / Travere Therapeutics, Inc. | 0,12 | 0,00 | 2,40 | 1,70 | 0,1463 | 0,0214 | |||
| NSSC / Napco Security Technologies, Inc. | 0,10 | 0,00 | 2,36 | -37,75 | 0,1439 | -0,0568 | |||
| ADUS / Addus HomeCare Corporation | 0,02 | 57,04 | 2,33 | 31,18 | 0,1422 | 0,0481 | |||
| HWKN / Hawkins, Inc. | 0,02 | 0,00 | 2,19 | 13,91 | 0,1333 | 0,0317 | |||
| TPH / Tri Pointe Homes, Inc. | 0,07 | -85,90 | 2,17 | -62,25 | 0,1322 | -0,3659 | |||
| SMPL / The Simply Good Foods Company | 0,06 | -53,97 | 2,16 | -56,27 | 0,1315 | -0,1296 | |||
| OLO / Olo Inc. | 0,32 | 9,00 | 2,00 | -8,44 | 0,1218 | 0,0063 | |||
| INTA / Intapp, Inc. | 0,04 | 8,26 | 1,99 | -17,59 | 0,1214 | -0,0066 | |||
| CGON / CG Oncology, Inc. | 0,07 | 0,00 | 1,89 | -10,41 | 0,1155 | 0,0035 | |||
| CORZ / Core Scientific, Inc. | 0,23 | 8,43 | 1,84 | -28,43 | 0,1124 | -0,0240 | |||
| PAR / PAR Technology Corporation | 0,03 | 0,00 | 1,68 | -19,57 | 0,1026 | -0,0082 | |||
| TKR / The Timken Company | 0,02 | 0,00 | 1,58 | -19,96 | 0,0964 | -0,0082 | |||
| IRON / Disc Medicine, Inc. | 0,03 | 0,00 | 1,57 | -11,43 | 0,0955 | 0,0019 | |||
| BLBD / Blue Bird Corporation | 0,04 | 0,00 | 1,32 | -2,08 | 0,0806 | 0,0091 | |||
| DAWN / Day One Biopharmaceuticals, Inc. | 0,15 | 0,00 | 1,18 | -37,13 | 0,0721 | -0,0275 | |||
| AEHR / Aehr Test Systems, Inc. | 0,13 | 0,00 | 1,14 | -24,69 | 0,0696 | -0,0107 | |||
| NRIX / Nurix Therapeutics, Inc. | 0,09 | 26,02 | 1,07 | -26,27 | 0,0654 | -0,0116 | |||
| LILAB / Liberty Latin America Ltd. | 0,19 | 0,00 | 1,05 | -10,27 | 0,0640 | 0,0021 | |||
| CSTM / Constellium SE | 0,09 | -0,54 | 0,93 | 1,30 | 0,0568 | 0,0081 | |||
| ULH / Universal Logistics Holdings, Inc. | 0,04 | 0,00 | 0,91 | -50,84 | 0,0553 | -0,0424 | |||
| ATXS / Astria Therapeutics, Inc. | 0,15 | 55,80 | 0,77 | 2,26 | 0,0469 | 0,0071 | |||
| VRDN / Viridian Therapeutics, Inc. | 0,05 | 0,00 | 0,70 | -30,09 | 0,0429 | -0,0104 | |||
| SIG / Signet Jewelers Limited | 0,01 | 0,66 | 0,0405 | 0,0405 | |||||
| FLOC / Flowco Holdings Inc. | 0,03 | 27,24 | 0,60 | -12,21 | 0,0369 | 0,0004 | |||
| UPB / Upstream Bio, Inc. | 0,06 | 0,00 | 0,59 | -14,06 | 0,0362 | -0,0004 | |||
| CATX / Perspective Therapeutics, Inc. | 0,18 | 0,00 | 0,43 | -30,94 | 0,0264 | -0,0068 | |||
| PAL / Proficient Auto Logistics, Inc. | 0,05 | 0,00 | 0,43 | -15,72 | 0,0262 | -0,0007 | |||
| ELVN / Enliven Therapeutics, Inc. | 0,00 | 0,00 | 0,06 | -14,06 | 0,0034 | -0,0000 | |||
| JANX / Janux Therapeutics, Inc. | 0,00 | 0,00 | 0,05 | -23,19 | 0,0032 | -0,0004 | |||
| FTRE / Fortrea Holdings Inc. | 0,00 | -100,00 | 0,00 | -100,00 | -0,3167 | ||||
| ACHC / Acadia Healthcare Company, Inc. | 0,00 | -100,00 | 0,00 | -100,00 | -0,4634 | ||||
| INFA / Informatica Inc. | 0,00 | -100,00 | 0,00 | -100,00 | -0,5347 |