Statistiques de base
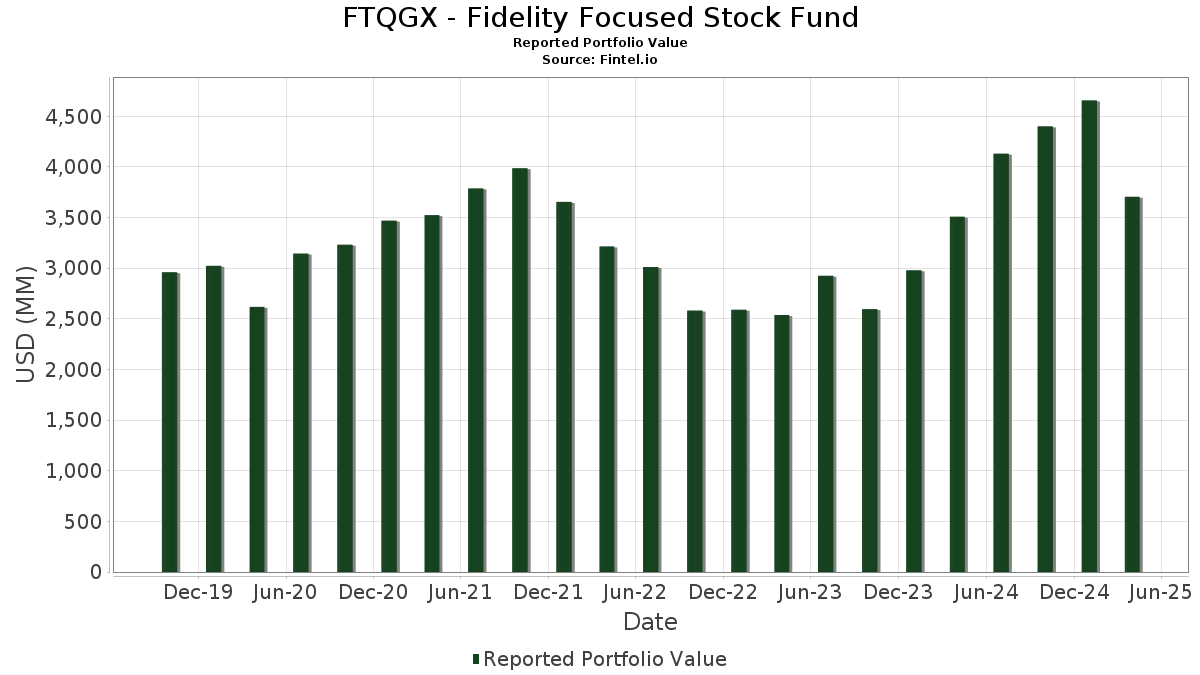
| Valeur du portefeuille | $ 3 704 327 253 |
| Positions actuelles | 42 |
Dernières positions, performances, ASG (à partir des dépôts 13F, 13D)
FTQGX - Fidelity Focused Stock Fund a déclaré un total de 42 positions dans ses derniers dépôts auprès de la SEC. La valeur la plus récente du portefeuille est calculée à 3 704 327 253 USD. Les actifs sous gestion réels (ASG) sont cette valeur plus les liquidités (qui ne sont pas divulguées). Les principales positions de FTQGX - Fidelity Focused Stock Fund sont Amazon.com, Inc. (US:AMZN) , NVIDIA Corporation (US:NVDA) , Meta Platforms, Inc. (US:META) , Robinhood Markets, Inc. (US:HOOD) , and Apple Inc. (US:AAPL) . Les nouvelles positions de FTQGX - Fidelity Focused Stock Fund incluent DraftKings Inc. (US:DKNG) , Somnigroup International Inc. (US:SGI) , Cisco Systems, Inc. (US:CSCO) , Ameren Corporation (US:AEE) , and American Water Works Company, Inc. (DE:AWC) .
Meilleures augmentations ce trimestre
Nous utilisons la variation de l'allocation du portefeuille car il s'agit de l'indicateur le plus significatif. Les changements peuvent être dus à des transactions ou à des variations de prix des actions.
| Titre | Actions (en millions) |
Valeur ($ en millions) |
% du portefeuille | ΔPortefeuille % |
|---|---|---|---|---|
| 171,70 | 171,73 | 4,6354 | 3,8776 | |
| 3,70 | 123,17 | 3,3247 | 3,3247 | |
| 4,48 | 145,21 | 3,9195 | 2,7694 | |
| 0,89 | 188,06 | 5,0762 | 2,2818 | |
| 1,30 | 79,68 | 2,1508 | 2,1508 | |
| 0,36 | 88,66 | 2,3931 | 1,9875 | |
| 0,91 | 69,64 | 1,8797 | 1,8797 | |
| 3,86 | 189,47 | 5,1140 | 1,7125 | |
| 0,57 | 60,10 | 1,6223 | 1,6223 | |
| 0,55 | 93,91 | 2,5347 | 1,5918 |
Principales baisses ce trimestre
Nous utilisons la variation de l'allocation du portefeuille car il s'agit de l'indicateur le plus significatif. Les changements peuvent être dus à des transactions ou à des variations de prix des actions.
| Titre | Actions (en millions) |
Valeur ($ en millions) |
% du portefeuille | ΔPortefeuille % |
|---|---|---|---|---|
| 0,00 | 0,00 | -2,9611 | ||
| 0,00 | 0,00 | -2,9481 | ||
| 0,00 | 0,00 | -2,9481 | ||
| 0,00 | 0,00 | -2,7718 | ||
| 0,92 | 65,19 | 1,7595 | -2,7035 | |
| 0,11 | 102,48 | 2,7661 | -2,5325 | |
| 0,53 | 54,45 | 1,4697 | -2,4523 | |
| 0,35 | 191,05 | 5,1568 | -2,4407 | |
| 0,42 | 77,88 | 2,1022 | -2,3406 | |
| 0,68 | 55,16 | 1,4889 | -2,1315 |
Déclarations 13F et dépôts de fonds
Ce formulaire a été déposé le 2025-06-26 pour la période de déclaration 2025-04-30. Cliquez sur l'icône du lien pour voir l'historique complet des transactions.
Mettre à niveau pour débloquer les données premium et exporter vers Excel ![]() .
.
| Titre | Type | Prix moyen de l'action | Actions (en millions) |
ΔActions (%) |
ΔActions (%) |
Valeur ($ en millions) |
Portefeuille (%) |
ΔPortefeuille (%) |
|
|---|---|---|---|---|---|---|---|---|---|
| AMZN / Amazon.com, Inc. | 1,45 | 6,05 | 268,13 | -17,72 | 7,2373 | 0,2348 | |||
| NVDA / NVIDIA Corporation | 1,97 | -15,11 | 214,25 | -22,99 | 5,7829 | -0,1955 | |||
| META / Meta Platforms, Inc. | 0,35 | -32,16 | 191,05 | -45,96 | 5,1568 | -2,4407 | |||
| HOOD / Robinhood Markets, Inc. | 3,86 | 26,62 | 189,47 | 19,69 | 5,1140 | 1,7125 | |||
| AAPL / Apple Inc. | 0,89 | 60,62 | 188,06 | 44,62 | 5,0762 | 2,2818 | |||
| MSFT / Microsoft Corporation | 0,46 | 10,36 | 181,03 | 5,10 | 4,8863 | 1,1848 | |||
| US31635A1051 / Fidelity Cash Central Fund | 171,70 | 387,03 | 171,73 | 387,03 | 4,6354 | 3,8776 | |||
| KD / Kyndryl Holdings, Inc. | 4,48 | 217,70 | 145,21 | 171,34 | 3,9195 | 2,7694 | |||
| GOOGL / Alphabet Inc. | 0,87 | -27,77 | 137,52 | -43,78 | 3,7119 | -1,5448 | |||
| BK / The Bank of New York Mellon Corporation | 1,54 | -32,97 | 123,59 | -37,28 | 3,3359 | -0,8983 | |||
| DKNG / DraftKings Inc. | 3,70 | 123,17 | 3,3247 | 3,3247 | |||||
| PLD / Prologis, Inc. | 1,16 | 62,80 | 118,96 | 39,52 | 3,2110 | 1,3787 | |||
| TRU / TransUnion | 1,28 | 4,58 | 106,45 | -12,59 | 2,8733 | 0,2563 | |||
| LLY / Eli Lilly and Company | 0,11 | -62,50 | 102,48 | -58,44 | 2,7661 | -2,5325 | |||
| WMT / Walmart Inc. | 0,98 | -21,98 | 94,92 | -22,71 | 2,5620 | -0,0769 | |||
| PM / Philip Morris International Inc. | 0,55 | 62,61 | 93,91 | 114,02 | 2,5347 | 1,5918 | |||
| TMUS / T-Mobile US, Inc. | 0,36 | 343,13 | 88,66 | 369,74 | 2,3931 | 1,9875 | |||
| UNH / UnitedHealth Group Incorporated | 0,21 | 158,54 | 87,23 | 88,44 | 2,3544 | 1,2999 | |||
| PSK / PrairieSky Royalty Ltd. | 4,95 | 0,00 | 83,34 | -9,58 | 2,2494 | 0,2689 | |||
| SGI / Somnigroup International Inc. | 1,30 | 79,68 | 2,1508 | 2,1508 | |||||
| FI / Fiserv, Inc. | 0,42 | -55,91 | 77,88 | -62,33 | 2,1022 | -2,3406 | |||
| SCI / Service Corporation International | 0,93 | 113,24 | 74,63 | 118,10 | 2,0143 | 1,2790 | |||
| APH / Amphenol Corporation | 0,91 | 69,64 | 1,8797 | 1,8797 | |||||
| WFC / Wells Fargo & Company | 0,92 | -69,29 | 65,19 | -59,46 | 1,7595 | -2,7035 | |||
| XOM / Exxon Mobil Corporation | 0,57 | 60,10 | 1,6223 | 1,6223 | |||||
| NTRS / Northern Trust Corporation | 0,62 | 65,28 | 58,26 | 38,33 | 1,5726 | 0,6675 | |||
| CSCO / Cisco Systems, Inc. | 0,98 | 56,63 | 1,5286 | 1,5286 | |||||
| DECK / Deckers Outdoor Corporation | 0,51 | 8,39 | 56,49 | -32,27 | 1,5248 | -0,2676 | |||
| PCAR / PACCAR Inc | 0,62 | 52,71 | 55,93 | 24,24 | 1,5097 | 0,5423 | |||
| MOD / Modine Manufacturing Company | 0,68 | -59,31 | 55,16 | -67,26 | 1,4889 | -2,1315 | |||
| BSX / Boston Scientific Corporation | 0,53 | -70,31 | 54,45 | -70,17 | 1,4697 | -2,4523 | |||
| AEE / Ameren Corporation | 0,42 | 42,08 | 1,1358 | 1,1358 | |||||
| AWC / American Water Works Company, Inc. | 0,25 | 37,05 | 1,0000 | 1,0000 | |||||
| ALNY / Alnylam Pharmaceuticals, Inc. | 0,13 | 35,01 | 0,9450 | 0,9450 | |||||
| AZO / AutoZone, Inc. | 0,01 | -51,18 | 31,23 | 73,64 | 0,8429 | 0,2457 | |||
| ISRG / Intuitive Surgical, Inc. | 0,06 | 30,43 | 0,8214 | 0,8214 | |||||
| FNV / Franco-Nevada Corporation | 0,13 | 22,34 | 0,6030 | 0,6030 | |||||
| TE CONNECTIVITY PLC / EC (IE000IVNQZ81) | 0,07 | 9,51 | 0,2568 | 0,2568 | |||||
| MELI / MercadoLibre, Inc. | 0,00 | 9,32 | 0,2517 | 0,2517 | |||||
| TSM / Taiwan Semiconductor Manufacturing Company Limited - Depositary Receipt (Common Stock) | 0,04 | 6,67 | 0,1800 | 0,1800 | |||||
| TSLA / Tesla, Inc. | 0,02 | -90,98 | 6,49 | -93,71 | 0,1752 | -2,0419 | |||
| RBRK / Rubrik, Inc. | 0,01 | -98,34 | 1,00 | -98,40 | 0,0270 | -1,3192 | |||
| IP / International Paper Company | 0,00 | -100,00 | 0,00 | -100,00 | -0,3335 | ||||
| IBM / International Business Machines Corporation | 0,00 | -100,00 | 0,00 | -100,00 | -1,1264 | ||||
| AVGO / Broadcom Inc. | 0,00 | -100,00 | 0,00 | -100,00 | -2,9481 | ||||
| AVGO / Broadcom Inc. | 0,00 | -100,00 | 0,00 | -100,00 | -2,9481 | ||||
| APP / AppLovin Corporation | 0,00 | -100,00 | 0,00 | -100,00 | -2,7718 | ||||
| CLS / Celestica Inc. | 0,00 | -100,00 | 0,00 | -100,00 | -2,9611 | ||||
| GEV / GE Vernova Inc. | 0,00 | -100,00 | 0,00 | -100,00 | -0,8654 |