Statistiques de base
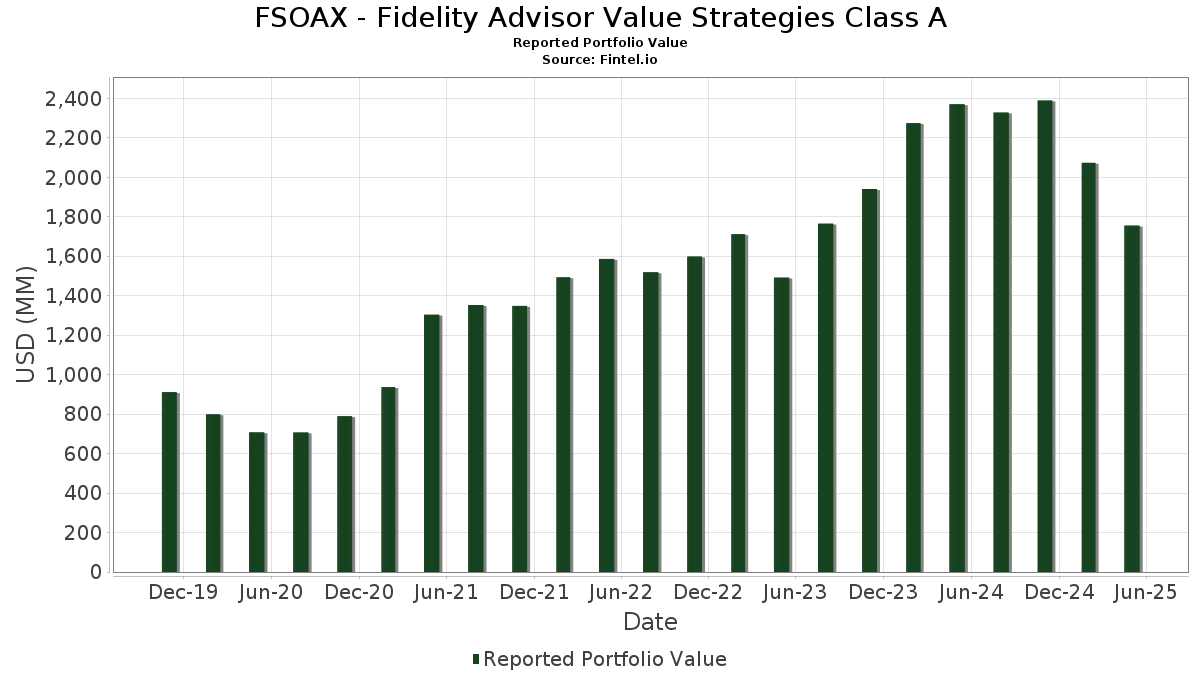
| Valeur du portefeuille | $ 1 754 648 164 |
| Positions actuelles | 109 |
Dernières positions, performances, ASG (à partir des dépôts 13F, 13D)
FSOAX - Fidelity Advisor Value Strategies Class A a déclaré un total de 109 positions dans ses derniers dépôts auprès de la SEC. La valeur la plus récente du portefeuille est calculée à 1 754 648 164 USD. Les actifs sous gestion réels (ASG) sont cette valeur plus les liquidités (qui ne sont pas divulguées). Les principales positions de FSOAX - Fidelity Advisor Value Strategies Class A sont Fidelity Securities Lending Cash Central Fund (US:US31635A3032) , First Citizens BancShares, Inc. (US:FCNCA) , East West Bancorp, Inc. (US:EWBC) , CVS Health Corporation (US:CVS) , and Molina Healthcare, Inc. (US:MOH) . Les nouvelles positions de FSOAX - Fidelity Advisor Value Strategies Class A incluent Imperial Oil Limited (CA:IMO) , Phillips 66 (US:PSX) , Constellation Brands, Inc. (US:STZ) , Hasbro, Inc. (US:HAS) , and Patrick Industries, Inc. (US:PATK) .
Meilleures augmentations ce trimestre
Nous utilisons la variation de l'allocation du portefeuille car il s'agit de l'indicateur le plus significatif. Les changements peuvent être dus à des transactions ou à des variations de prix des actions.
| Titre | Actions (en millions) |
Valeur ($ en millions) |
% du portefeuille | ΔPortefeuille % |
|---|---|---|---|---|
| 101,78 | 101,79 | 6,1545 | 2,4770 | |
| 0,26 | 18,87 | 1,1409 | 1,1409 | |
| 0,15 | 16,53 | 0,9996 | 0,9996 | |
| 0,09 | 16,51 | 0,9982 | 0,9982 | |
| 0,21 | 14,32 | 0,8655 | 0,8655 | |
| 0,14 | 12,35 | 0,7465 | 0,7465 | |
| 0,04 | 12,22 | 0,7389 | 0,7389 | |
| 0,15 | 11,05 | 0,6683 | 0,6683 | |
| 0,56 | 19,84 | 1,1993 | 0,6647 | |
| 1,07 | 18,35 | 1,1092 | 0,6497 |
Principales baisses ce trimestre
Nous utilisons la variation de l'allocation du portefeuille car il s'agit de l'indicateur le plus significatif. Les changements peuvent être dus à des transactions ou à des variations de prix des actions.
| Titre | Actions (en millions) |
Valeur ($ en millions) |
% du portefeuille | ΔPortefeuille % |
|---|---|---|---|---|
| 6,21 | 6,22 | 0,3758 | -0,7832 | |
| 0,23 | 17,68 | 1,0688 | -0,6588 | |
| 0,16 | 19,94 | 1,2053 | -0,3458 | |
| 0,11 | 16,42 | 0,9925 | -0,3434 | |
| 0,66 | 2,85 | 0,1725 | -0,3235 | |
| 1,35 | 12,85 | 0,7770 | -0,3144 | |
| 0,17 | 8,87 | 0,5364 | -0,2984 | |
| 0,37 | 23,69 | 1,4325 | -0,2815 | |
| 0,04 | 19,61 | 1,1854 | -0,2388 | |
| 0,13 | 9,14 | 0,5527 | -0,2145 |
Déclarations 13F et dépôts de fonds
Ce formulaire a été déposé le 2025-07-24 pour la période de déclaration 2025-05-31. Cliquez sur l'icône du lien pour voir l'historique complet des transactions.
Mettre à niveau pour débloquer les données premium et exporter vers Excel ![]() .
.
| Titre | Type | Prix moyen de l'action | Actions (en millions) |
ΔActions (%) |
ΔActions (%) |
Valeur ($ en millions) |
Portefeuille (%) |
ΔPortefeuille (%) |
|
|---|---|---|---|---|---|---|---|---|---|
| US31635A3032 / Fidelity Securities Lending Cash Central Fund | 101,78 | 38,43 | 101,79 | 38,43 | 6,1545 | 2,4770 | |||
| FCNCA / First Citizens BancShares, Inc. | 0,02 | 15,65 | 31,43 | 4,40 | 1,9003 | 0,3946 | |||
| EWBC / East West Bancorp, Inc. | 0,29 | -12,15 | 26,30 | -15,16 | 1,5901 | 0,0398 | |||
| CVS / CVS Health Corporation | 0,38 | -25,38 | 24,12 | -27,29 | 1,4581 | -0,2007 | |||
| MOH / Molina Healthcare, Inc. | 0,08 | -25,64 | 24,07 | -24,67 | 1,4551 | -0,1427 | |||
| VTR / Ventas, Inc. | 0,37 | -25,60 | 23,69 | -30,87 | 1,4325 | -0,2815 | |||
| PLD / Prologis, Inc. | 0,21 | 15,71 | 23,11 | 1,41 | 1,3975 | 0,2575 | |||
| ALSN / Allison Transmission Holdings, Inc. | 0,21 | -8,69 | 21,64 | -7,11 | 1,3081 | 0,1433 | |||
| LPLA / LPL Financial Holdings Inc. | 0,06 | -24,35 | 21,53 | -21,21 | 1,3015 | -0,0650 | |||
| SLM / SLM Corporation | 0,66 | -2,12 | 21,41 | 4,95 | 1,2942 | 0,2741 | |||
| FSLR / First Solar, Inc. | 0,13 | -10,35 | 20,82 | 4,07 | 1,2587 | 0,2582 | |||
| CEG / Constellation Energy Corporation | 0,07 | 7,87 | 20,57 | 31,81 | 1,2439 | 0,4632 | |||
| PCG / PG&E Corporation | 1,21 | -17,05 | 20,42 | -14,31 | 1,2344 | 0,0428 | |||
| RGA / Reinsurance Group of America, Incorporated | 0,10 | 0,00 | 20,34 | 0,30 | 1,2295 | 0,2155 | |||
| SUI / Sun Communities, Inc. | 0,16 | -29,10 | 19,94 | -35,72 | 1,2053 | -0,3458 | |||
| REXR / Rexford Industrial Realty, Inc. | 0,56 | 117,59 | 19,84 | 85,57 | 1,1993 | 0,6647 | |||
| GXO / GXO Logistics, Inc. | 0,48 | 54,22 | 19,68 | 60,95 | 1,1899 | 0,5784 | |||
| JBL / Jabil Inc. | 0,12 | -24,16 | 19,67 | -17,75 | 1,1895 | -0,0068 | |||
| OMF / OneMain Holdings, Inc. | 0,38 | -15,85 | 19,67 | -18,83 | 1,1894 | -0,0227 | |||
| AMP / Ameriprise Financial, Inc. | 0,04 | -27,36 | 19,61 | -31,15 | 1,1854 | -0,2388 | |||
| DLTR / Dollar Tree, Inc. | 0,22 | -3,64 | 19,60 | 19,38 | 1,1853 | 0,3640 | |||
| SMURFIT WESTROCK PLC / EC (IE00028FXN24) | 0,45 | 20,64 | 19,38 | 0,39 | 1,1715 | 0,2062 | |||
| SGI / Somnigroup International Inc. | 0,29 | -16,98 | 19,09 | -15,45 | 1,1541 | 0,0251 | |||
| ARW / Arrow Electronics, Inc. | 0,16 | -30,50 | 19,07 | -23,87 | 1,1530 | -0,0998 | |||
| APO / Apollo Global Management, Inc. | 0,15 | -11,50 | 19,02 | -22,51 | 1,1497 | -0,0776 | |||
| IMO / Imperial Oil Limited | 0,26 | 18,87 | 1,1409 | 1,1409 | |||||
| GTES / Gates Industrial Corporation plc | 0,88 | -19,70 | 18,55 | -21,52 | 1,1216 | -0,0606 | |||
| FA / First Advantage Corporation | 1,07 | 74,50 | 18,35 | 99,71 | 1,1092 | 0,6497 | |||
| SRE / Sempra | 0,23 | 8,99 | 18,20 | 19,68 | 1,1005 | 0,3398 | |||
| TRV / The Travelers Companies, Inc. | 0,07 | -12,83 | 17,98 | -7,03 | 1,0868 | 0,1198 | |||
| SIG / Signet Jewelers Limited | 0,27 | 51,27 | 17,85 | 92,48 | 1,0795 | 0,6155 | |||
| GPN / Global Payments Inc. | 0,23 | -28,74 | 17,68 | -48,82 | 1,0688 | -0,6588 | |||
| ON / ON Semiconductor Corporation | 0,42 | -19,94 | 17,61 | -28,50 | 1,0650 | -0,1671 | |||
| LAD / Lithia Motors, Inc. | 0,06 | -15,01 | 17,59 | -21,80 | 1,0634 | -0,0615 | |||
| WCC / WESCO International, Inc. | 0,10 | -14,43 | 17,53 | -20,39 | 1,0597 | -0,0414 | |||
| AIZ / Assurant, Inc. | 0,09 | -7,60 | 17,52 | -9,78 | 1,0591 | 0,0880 | |||
| LNG / Cheniere Energy, Inc. | 0,07 | -11,49 | 17,35 | -8,22 | 1,0488 | 0,1035 | |||
| CH1300646267 / Bunge Global SA | 0,22 | -15,79 | 17,30 | -11,29 | 1,0461 | 0,0706 | |||
| ES / Eversource Energy | 0,26 | -7,64 | 17,09 | -5,00 | 1,0333 | 0,1336 | |||
| HRI / Herc Holdings Inc. | 0,14 | 31,83 | 17,00 | 13,93 | 1,0278 | 0,2816 | |||
| WEX / WEX Inc. | 0,13 | -9,28 | 16,90 | -23,24 | 1,0215 | -0,0793 | |||
| WDC / Western Digital Corporation | 0,33 | 98,96 | 16,84 | 109,62 | 1,0182 | 0,6164 | |||
| US7587501039 / Regal-Beloit Corp. | 0,12 | -9,89 | 16,65 | -7,08 | 1,0069 | 0,1105 | |||
| PSX / Phillips 66 | 0,15 | 16,53 | 0,9996 | 0,9996 | |||||
| EIX / Edison International | 0,30 | -7,62 | 16,53 | -5,57 | 0,9993 | 0,1239 | |||
| STZ / Constellation Brands, Inc. | 0,09 | 16,51 | 0,9982 | 0,9982 | |||||
| KDP / Keurig Dr Pepper Inc. | 0,49 | -9,51 | 16,44 | -9,10 | 0,9940 | 0,0894 | |||
| WELL / Welltower Inc. | 0,11 | -38,85 | 16,42 | -38,54 | 0,9925 | -0,3434 | |||
| DAR / Darling Ingredients Inc. | 0,53 | -9,74 | 16,40 | -22,07 | 0,9914 | -0,0610 | |||
| CNR / Core Natural Resources, Inc. | 0,24 | -1,01 | 16,38 | -7,60 | 0,9901 | 0,1037 | |||
| HGV / Hilton Grand Vacations Inc. | 0,43 | -9,52 | 16,35 | -19,50 | 0,9886 | -0,0273 | |||
| CNH / CNH Industrial N.V. | 1,31 | -11,14 | 16,34 | -13,69 | 0,9880 | 0,0411 | |||
| NATL / NCR Atleos Corporation | 0,62 | 3,70 | 16,34 | -3,34 | 0,9876 | 0,1425 | |||
| IP / International Paper Company | 0,34 | -5,79 | 16,33 | -20,07 | 0,9871 | -0,0345 | |||
| AES / The AES Corporation | 1,59 | -18,30 | 16,00 | -28,87 | 0,9673 | -0,1576 | |||
| BPOP / Popular, Inc. | 0,15 | -2,77 | 16,00 | 0,23 | 0,9671 | 0,1690 | |||
| UHALB / U-Haul Holding Company - Series N | 0,28 | -5,79 | 15,69 | -12,69 | 0,9487 | 0,0499 | |||
| RJF / Raymond James Financial, Inc. | 0,11 | -5,84 | 15,65 | -10,52 | 0,9464 | 0,0715 | |||
| GMS / GMS Inc. | 0,20 | 0,00 | 15,42 | -4,87 | 0,9322 | 0,1216 | |||
| GIL / Gildan Activewear Inc. | 0,32 | -5,78 | 14,94 | -18,79 | 0,9034 | -0,0168 | |||
| UPBD / Upbound Group, Inc. | 0,65 | 6,03 | 14,92 | -5,80 | 0,9023 | 0,1100 | |||
| CLNX / Cellnex Telecom, S.A. | 0,39 | -37,99 | 14,81 | -33,26 | 0,8952 | -0,2144 | |||
| NXST / Nexstar Media Group, Inc. | 0,09 | 57,20 | 14,52 | 58,38 | 0,8779 | 0,4194 | |||
| TRGP / Targa Resources Corp. | 0,09 | -5,75 | 14,50 | -26,21 | 0,8765 | -0,1061 | |||
| DRVN / Driven Brands Holdings Inc. | 0,81 | 16,66 | 14,49 | 18,59 | 0,8759 | 0,2649 | |||
| ACHC / Acadia Healthcare Company, Inc. | 0,63 | 22,90 | 14,34 | -7,19 | 0,8669 | 0,0942 | |||
| HAS / Hasbro, Inc. | 0,21 | 14,32 | 0,8655 | 0,8655 | |||||
| BLDR / Builders FirstSource, Inc. | 0,13 | -5,80 | 14,16 | -27,03 | 0,8561 | -0,1143 | |||
| FQVLF / First Quantum Minerals Ltd. | 0,93 | 0,00 | 13,82 | 19,40 | 0,8358 | 0,2568 | |||
| PVH / PVH Corp. | 0,16 | -26,41 | 13,51 | -17,63 | 0,8169 | -0,0035 | |||
| CSTM / Constellium SE | 1,11 | -0,86 | 13,45 | 5,76 | 0,8133 | 0,1772 | |||
| XPRO / Expro Group Holdings N.V. | 1,62 | -5,80 | 13,45 | -34,08 | 0,8130 | -0,2072 | |||
| GTM / ZoomInfo Technologies Inc. | 1,35 | -28,10 | 12,85 | -41,11 | 0,7770 | -0,3144 | |||
| MEOH / Methanex Corporation | 0,39 | 17,21 | 12,79 | -13,13 | 0,7730 | 0,0369 | |||
| TEX / Terex Corporation | 0,28 | -1,01 | 12,73 | 9,47 | 0,7699 | 0,1881 | |||
| NCR / NCR Corp. | 1,14 | -5,80 | 12,66 | -7,39 | 0,7654 | 0,0818 | |||
| OSK / Oshkosh Corporation | 0,13 | -5,76 | 12,50 | -8,63 | 0,7556 | 0,0716 | |||
| R / Ryder System, Inc. | 0,08 | -5,77 | 12,49 | -15,70 | 0,7552 | 0,0141 | |||
| PATK / Patrick Industries, Inc. | 0,14 | 12,35 | 0,7465 | 0,7465 | |||||
| GLPEY / Galp Energia, SGPS, S.A. - Depositary Receipt (Common Stock) | 0,77 | -5,80 | 12,31 | -8,55 | 0,7441 | 0,0711 | |||
| BLD / TopBuild Corp. | 0,04 | 12,22 | 0,7389 | 0,7389 | |||||
| BCO / The Brink's Company | 0,15 | -5,79 | 12,02 | -17,79 | 0,7268 | -0,0045 | |||
| BBWI / Bath & Body Works, Inc. | 0,42 | 43,62 | 11,86 | 11,48 | 0,7171 | 0,1849 | |||
| FDX / FedEx Corporation | 0,05 | -5,74 | 11,82 | -21,80 | 0,7147 | -0,0413 | |||
| OI / O-I Glass, Inc. | 0,87 | -19,51 | 11,37 | -7,99 | 0,6874 | 0,0694 | |||
| XPO / XPO, Inc. | 0,10 | -5,78 | 11,31 | -12,78 | 0,6841 | 0,0353 | |||
| TKR / The Timken Company | 0,16 | -23,44 | 11,27 | -35,27 | 0,6816 | -0,1894 | |||
| CTRI / Centuri Holdings, Inc. | 0,54 | -5,79 | 11,24 | 13,37 | 0,6797 | 0,1838 | |||
| DOOO / BRP Inc. | 0,25 | 0,00 | 11,15 | 11,08 | 0,6740 | 0,1721 | |||
| LNTH / Lantheus Holdings, Inc. | 0,15 | 11,05 | 0,6683 | 0,6683 | |||||
| PFSI / PennyMac Financial Services, Inc. | 0,12 | -5,81 | 11,04 | -12,76 | 0,6675 | 0,0345 | |||
| PAG / Penske Automotive Group, Inc. | 0,07 | -5,77 | 10,98 | -8,31 | 0,6641 | 0,0649 | |||
| JAZZ / Jazz Pharmaceuticals plc | 0,10 | -5,82 | 10,49 | -29,09 | 0,6344 | -0,1056 | |||
| ACI / Albertsons Companies, Inc. | 0,46 | -28,93 | 10,29 | -24,91 | 0,6224 | -0,0632 | |||
| ICLR / ICON Public Limited Company | 0,08 | 20,00 | 10,08 | -17,73 | 0,6097 | -0,0033 | |||
| WSC / WillScot Holdings Corporation | 0,37 | -1,16 | 10,06 | -32,45 | 0,6083 | -0,0266 | |||
| UBSG / UBS Group AG | 0,32 | -5,80 | 10,03 | -12,39 | 0,6061 | 0,0338 | |||
| AHCO / AdaptHealth Corp. | 1,05 | -18,54 | 9,46 | -35,72 | 0,5719 | -0,1640 | |||
| WLK / Westlake Corporation | 0,13 | -5,78 | 9,14 | -40,41 | 0,5527 | -0,2145 | |||
| KBR / KBR, Inc. | 0,17 | -30,36 | 8,87 | -26,78 | 0,5364 | -0,2984 | |||
| FLR / Fluor Corporation | 0,21 | -5,82 | 8,61 | 2,98 | 0,5206 | 0,1024 | |||
| TFII / TFI International Inc. | 0,10 | -5,78 | 8,58 | -10,30 | 0,5189 | 0,0404 | |||
| MLKN / MillerKnoll, Inc. | 0,44 | 103,44 | 7,42 | 59,64 | 0,4485 | 0,2161 | |||
| VSTS / Vestis Corporation | 1,17 | 8,96 | 7,19 | -43,36 | 0,4346 | -0,2001 | |||
| SNDK / Sandisk Corporation | 0,19 | 245,37 | 7,12 | 177,85 | 0,4308 | 0,3025 | |||
| OLN / Olin Corporation | 0,34 | -5,79 | 6,66 | -27,98 | 0,4029 | -0,0598 | |||
| ASGN / ASGN Incorporated | 0,12 | -5,80 | 6,34 | -26,17 | 0,3835 | -0,0462 | |||
| US31635A1051 / Fidelity Cash Central Fund | 6,21 | -73,18 | 6,22 | -73,18 | 0,3758 | -0,7832 | |||
| FTRE / Fortrea Holdings Inc. | 0,66 | -7,35 | 2,85 | -71,23 | 0,1725 | -0,3235 |