Statistiques de base
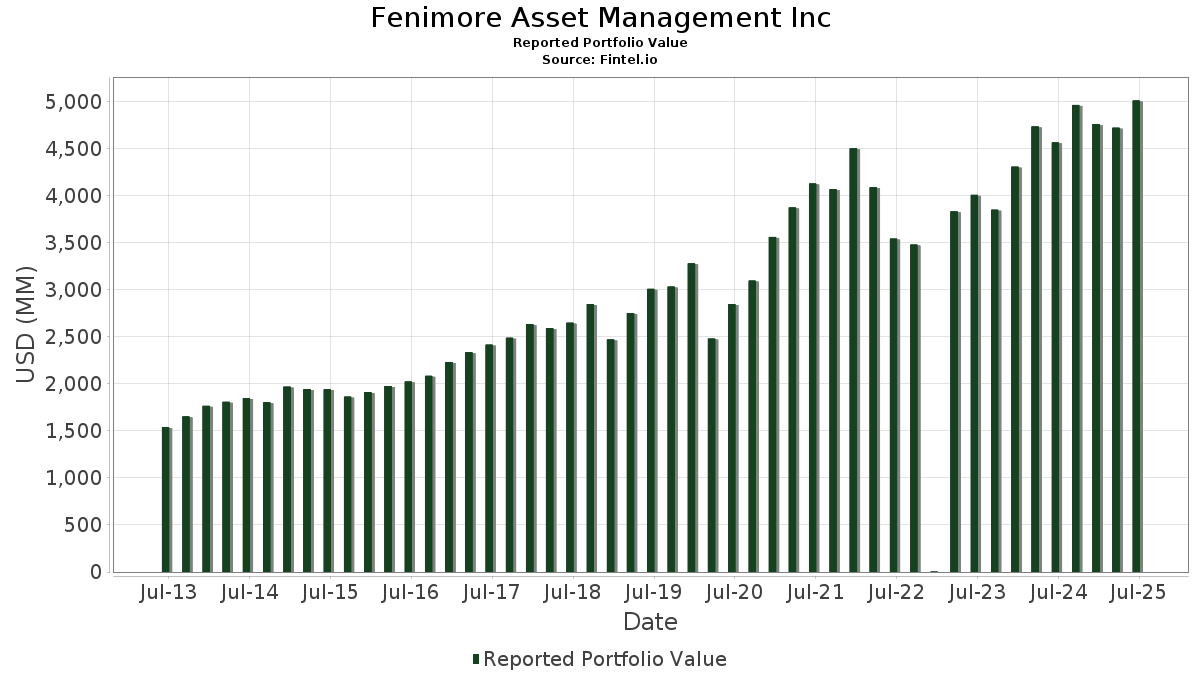
| Valeur du portefeuille | $ 5 010 863 479 |
| Positions actuelles | 90 |
Dernières positions, performances, ASG (à partir des dépôts 13F, 13D)
Fenimore Asset Management Inc a déclaré un total de 90 positions dans ses derniers dépôts auprès de la SEC. La valeur la plus récente du portefeuille est calculée à 5 010 863 479 USD. Les actifs sous gestion réels (ASG) sont cette valeur plus les liquidités (qui ne sont pas divulguées). Les principales positions de Fenimore Asset Management Inc sont Brown & Brown, Inc. (US:BRO) , Amphenol Corporation (US:APH) , Stryker Corporation (US:SYK) , Ross Stores, Inc. (US:ROST) , and CDW Corporation (US:CDW) . Les nouvelles positions de Fenimore Asset Management Inc incluent GE HealthCare Technologies Inc. (US:GEHC) , Costco Wholesale Corporation (US:COST) , .
Meilleures augmentations ce trimestre
Nous utilisons la variation de l'allocation du portefeuille car il s'agit de l'indicateur le plus significatif. Les changements peuvent être dus à des transactions ou à des variations de prix des actions.
| Titre | Actions (en millions) |
Valeur ($ en millions) |
% du portefeuille | ΔPortefeuille % |
|---|---|---|---|---|
| 2,29 | 225,88 | 4,5079 | 1,3176 | |
| 1,40 | 98,52 | 1,9660 | 0,6135 | |
| 0,42 | 182,09 | 3,6339 | 0,5546 | |
| 0,43 | 110,67 | 2,2085 | 0,4759 | |
| 0,02 | 115,40 | 2,3031 | 0,3559 | |
| 2,59 | 160,36 | 3,2001 | 0,3170 | |
| 0,50 | 118,14 | 2,3576 | 0,3116 | |
| 0,36 | 65,59 | 1,3089 | 0,2977 | |
| 0,35 | 108,43 | 2,1639 | 0,2311 | |
| 0,10 | 18,76 | 0,3743 | 0,2030 |
Principales baisses ce trimestre
Nous utilisons la variation de l'allocation du portefeuille car il s'agit de l'indicateur le plus significatif. Les changements peuvent être dus à des transactions ou à des variations de prix des actions.
| Titre | Actions (en millions) |
Valeur ($ en millions) |
% du portefeuille | ΔPortefeuille % |
|---|---|---|---|---|
| 2,14 | 237,28 | 4,7354 | -0,9141 | |
| 0,36 | 114,07 | 2,2765 | -0,4062 | |
| 0,56 | 149,27 | 2,9789 | -0,3894 | |
| 2,77 | 121,35 | 2,4218 | -0,3481 | |
| 1,61 | 204,78 | 4,0867 | -0,2559 | |
| 0,03 | 123,61 | 2,4668 | -0,2302 | |
| 0,87 | 153,21 | 3,0576 | -0,2231 | |
| 1,14 | 202,95 | 4,0503 | -0,1794 | |
| 0,42 | 61,49 | 1,2270 | -0,1369 | |
| 0,24 | 85,09 | 1,6981 | -0,1323 |
Déclarations 13F et dépôts de fonds
Ce formulaire a été déposé le 2025-07-22 pour la période de déclaration 2025-06-30. Cliquez sur l'icône du lien pour voir l'historique complet des transactions.
Mettre à niveau pour débloquer les données premium et exporter vers Excel ![]() .
.
| Titre | Type | Prix moyen de l'action | Actions (en millions) |
ΔActions (%) |
ΔActions (%) |
Valeur ($ en millions) |
Portefeuille (%) |
ΔPortefeuille (%) |
|
|---|---|---|---|---|---|---|---|---|---|
| BRO / Brown & Brown, Inc. | 2,14 | -0,19 | 237,28 | -11,05 | 4,7354 | -0,9141 | |||
| APH / Amphenol Corporation | 2,29 | -0,40 | 225,88 | 49,95 | 4,5079 | 1,3176 | |||
| SYK / Stryker Corporation | 0,52 | 0,16 | 207,63 | 6,45 | 4,1436 | 0,0126 | |||
| ROST / Ross Stores, Inc. | 1,61 | 0,04 | 204,78 | -0,13 | 4,0867 | -0,2559 | |||
| CDW / CDW Corporation | 1,14 | -8,81 | 202,95 | 1,62 | 4,0503 | -0,1794 | |||
| TT / Trane Technologies plc | 0,42 | -3,53 | 182,09 | 25,24 | 3,6339 | 0,5546 | |||
| MKL / Markel Group Inc. | 0,09 | 0,04 | 176,55 | 6,87 | 3,5234 | 0,0248 | |||
| VMC / Vulcan Materials Company | 0,67 | 0,31 | 173,67 | 12,14 | 3,4658 | 0,1859 | |||
| BN / Brookfield Corporation | 2,59 | -0,19 | 160,36 | 17,79 | 3,2001 | 0,3170 | |||
| FAST / Fastenal Company | 3,75 | 101,03 | 157,40 | 8,87 | 3,1412 | 0,0793 | |||
| IEX / IDEX Corporation | 0,87 | 1,95 | 153,21 | -1,09 | 3,0576 | -0,2231 | |||
| PGR / The Progressive Corporation | 0,56 | -0,46 | 149,27 | -6,14 | 2,9789 | -0,3894 | |||
| AZO / AutoZone, Inc. | 0,03 | -0,31 | 123,61 | -2,93 | 2,4668 | -0,2302 | |||
| EXLS / ExlService Holdings, Inc. | 2,77 | 0,04 | 121,35 | -7,21 | 2,4218 | -0,3481 | |||
| PNFP / Pinnacle Financial Partners, Inc. | 1,08 | 2,24 | 118,91 | 6,45 | 2,3730 | 0,0072 | |||
| ADI / Analog Devices, Inc. | 0,50 | 3,61 | 118,14 | 22,29 | 2,3576 | 0,3116 | |||
| BKNG / Booking Holdings Inc. | 0,02 | -0,12 | 115,40 | 25,52 | 2,3031 | 0,3559 | |||
| AJG / Arthur J. Gallagher & Co. | 0,36 | -2,88 | 114,07 | -9,95 | 2,2765 | -0,4062 | |||
| HEIA / Heico Corp. - Class A | 0,43 | 10,30 | 110,67 | 35,28 | 2,2085 | 0,4759 | |||
| ZBRA / Zebra Technologies Corporation | 0,35 | 8,87 | 108,43 | 18,81 | 2,1639 | 0,2311 | |||
| KEYS / Keysight Technologies, Inc. | 0,63 | 5,22 | 102,54 | 15,12 | 2,0464 | 0,1600 | |||
| MCHP / Microchip Technology Incorporated | 1,40 | 6,13 | 98,52 | 54,27 | 1,9660 | 0,6135 | |||
| ITW / Illinois Tool Works Inc. | 0,39 | 0,59 | 97,30 | 0,28 | 1,9418 | -0,1132 | |||
| GGG / Graco Inc. | 1,10 | 0,72 | 94,45 | 3,68 | 1,8849 | -0,0444 | |||
| WAT / Waters Corporation | 0,24 | 3,96 | 85,09 | -1,55 | 1,6981 | -0,1323 | |||
| BR / Broadridge Financial Solutions, Inc. | 0,32 | 0,66 | 76,93 | 0,89 | 1,5352 | -0,0796 | |||
| STE / STERIS plc | 0,31 | 3,16 | 74,96 | 9,34 | 1,4960 | 0,0439 | |||
| RSG / Republic Services, Inc. | 0,28 | -0,59 | 69,29 | 1,24 | 1,3828 | -0,0667 | |||
| AME / AMETEK, Inc. | 0,36 | 30,67 | 65,59 | 37,36 | 1,3089 | 0,2977 | |||
| CTAS / Cintas Corporation | 0,28 | 0,13 | 61,88 | 8,58 | 1,2348 | 0,0279 | |||
| PAYX / Paychex, Inc. | 0,42 | 1,26 | 61,49 | -4,53 | 1,2270 | -0,1369 | |||
| BAM / Brookfield Asset Management Ltd. | 0,93 | 1,77 | 51,44 | 16,12 | 1,0265 | 0,0884 | |||
| MLM / Martin Marietta Materials, Inc. | 0,09 | 5,98 | 48,78 | 21,68 | 0,9734 | 0,1244 | |||
| EOG / EOG Resources, Inc. | 0,37 | 1,21 | 44,80 | -5,60 | 0,8940 | -0,1111 | |||
| ENTG / Entegris, Inc. | 0,55 | 5,14 | 44,19 | -3,06 | 0,8818 | -0,0836 | |||
| JKHY / Jack Henry & Associates, Inc. | 0,23 | 4,64 | 41,92 | 3,25 | 0,8366 | -0,0233 | |||
| VRSK / Verisk Analytics, Inc. | 0,13 | 6,90 | 41,73 | 11,88 | 0,8328 | 0,0429 | |||
| BRK.A / Berkshire Hathaway Inc. | 0,00 | 0,00 | 37,90 | -8,72 | 0,7563 | -0,1230 | |||
| CIGI / Colliers International Group Inc. | 0,25 | 3,16 | 32,33 | 11,02 | 0,6452 | 0,0284 | |||
| CBZ / CBIZ, Inc. | 0,43 | 0,01 | 31,01 | -5,46 | 0,6188 | -0,0758 | |||
| WSO / Watsco, Inc. | 0,07 | 19,81 | 30,90 | 4,09 | 0,6167 | -0,0120 | |||
| ROP / Roper Technologies, Inc. | 0,05 | 4,20 | 27,77 | 0,18 | 0,5542 | -0,0329 | |||
| POOL / Pool Corporation | 0,10 | 0,26 | 27,70 | -8,20 | 0,5527 | -0,0863 | |||
| BROS / Dutch Bros Inc. | 0,40 | -0,37 | 27,59 | 10,33 | 0,5505 | 0,0210 | |||
| AVY / Avery Dennison Corporation | 0,14 | 6,25 | 25,13 | 4,75 | 0,5015 | -0,0066 | |||
| BIPC / Brookfield Infrastructure Corporation | 0,57 | 0,18 | 23,59 | 15,15 | 0,4707 | 0,0369 | |||
| TRRSF / Trisura Group Ltd. | 0,69 | -0,12 | 22,76 | 39,91 | 0,4541 | 0,1097 | |||
| CHH / Choice Hotels International, Inc. | 0,18 | 0,15 | 22,64 | -4,30 | 0,4518 | -0,0492 | |||
| A / Agilent Technologies, Inc. | 0,18 | 2,74 | 21,35 | 3,64 | 0,4260 | -0,0102 | |||
| FTDR / Frontdoor, Inc. | 0,34 | 0,59 | 20,05 | 54,32 | 0,4002 | 0,1250 | |||
| OSW / OneSpaWorld Holdings Limited | 0,94 | 0,45 | 19,08 | 21,99 | 0,3807 | 0,0495 | |||
| HLI / Houlihan Lokey, Inc. | 0,10 | 108,14 | 18,76 | 131,94 | 0,3743 | 0,2030 | |||
| SITE / SiteOne Landscape Supply, Inc. | 0,15 | 2,83 | 18,53 | 2,41 | 0,3699 | -0,0134 | |||
| FSV / FirstService Corporation | 0,10 | -0,21 | 17,53 | 5,00 | 0,3497 | -0,0038 | |||
| DFH / Dream Finders Homes, Inc. | 0,69 | 3,44 | 17,30 | 15,22 | 0,3452 | 0,0273 | |||
| SPSC / SPS Commerce, Inc. | 0,12 | -0,05 | 16,86 | 2,48 | 0,3364 | -0,0120 | |||
| NOMD / Nomad Foods Limited | 0,92 | -11,81 | 15,65 | -23,75 | 0,3124 | -0,1224 | |||
| BWIN / The Baldwin Insurance Group, Inc. | 0,35 | 3,13 | 15,04 | -1,21 | 0,3002 | -0,0223 | |||
| AIF / Altus Group Limited | 0,38 | -0,15 | 14,77 | 9,25 | 0,2948 | 0,0084 | |||
| CASS / Cass Information Systems, Inc. | 0,34 | 0,19 | 14,75 | 0,66 | 0,2944 | -0,0160 | |||
| HOMB / Home Bancshares, Inc. (Conway, AR) | 0,51 | 0,20 | 14,57 | 0,87 | 0,2908 | -0,0151 | |||
| LSTR / Landstar System, Inc. | 0,10 | 4,08 | 14,31 | -3,66 | 0,2856 | -0,0290 | |||
| EXPO / Exponent, Inc. | 0,19 | 0,31 | 14,31 | -7,55 | 0,2855 | -0,0422 | |||
| CHE / Chemed Corporation | 0,03 | -0,28 | 14,13 | -21,09 | 0,2820 | -0,0972 | |||
| ESI / Element Solutions Inc | 0,62 | 0,41 | 14,10 | 0,59 | 0,2814 | -0,0155 | |||
| BOC / Boston Omaha Corporation | 0,95 | 0,56 | 13,38 | -3,16 | 0,2670 | -0,0256 | |||
| DSGX / The Descartes Systems Group Inc. | 0,13 | 0,20 | 13,33 | 1,01 | 0,2660 | -0,0135 | |||
| FND / Floor & Decor Holdings, Inc. | 0,17 | 23,74 | 13,12 | 16,80 | 0,2618 | 0,0239 | |||
| ESAB / ESAB Corporation | 0,11 | 0,03 | 12,82 | 3,51 | 0,2559 | -0,0065 | |||
| FELE / Franklin Electric Co., Inc. | 0,14 | 0,24 | 12,53 | -4,17 | 0,2501 | -0,0269 | |||
| GEHC / GE HealthCare Technologies Inc. | 0,13 | 9,26 | 0,1848 | 0,1848 | |||||
| BRK.B / Berkshire Hathaway Inc. | 0,02 | -3,03 | 7,42 | -11,56 | 0,1481 | -0,0296 | |||
| VUG / Vanguard Index Funds - Vanguard Growth ETF | 0,01 | 0,00 | 2,89 | 18,24 | 0,0576 | 0,0059 | |||
| AAPL / Apple Inc. | 0,01 | 0,00 | 2,77 | -7,65 | 0,0552 | -0,0082 | |||
| Powershares Dynamic Large Cap / ETF (73935X609) | 0,02 | 2,00 | 0,0000 | ||||||
| ABBV / AbbVie Inc. | 0,01 | 0,00 | 1,38 | -11,40 | 0,0276 | -0,0055 | |||
| SPY / SPDR S&P 500 ETF | 0,00 | 0,00 | 0,91 | 10,41 | 0,0182 | 0,0007 | |||
| IBM / International Business Machines Corporation | 0,00 | 0,00 | 0,76 | 18,62 | 0,0151 | 0,0016 | |||
| IVV / iShares Trust - iShares Core S&P 500 ETF | 0,00 | 0,00 | 0,75 | 10,53 | 0,0149 | 0,0006 | |||
| XLY / The Select Sector SPDR Trust - The Consumer Discretionary Select Sector SPDR Fund | 0,00 | 0,00 | 0,68 | 10,02 | 0,0136 | 0,0005 | |||
| MSFT / Microsoft Corporation | 0,00 | 0,00 | 0,68 | 32,35 | 0,0135 | 0,0027 | |||
| NBTB / NBT Bancorp Inc. | 0,01 | 0,00 | 0,60 | -3,22 | 0,0120 | -0,0011 | |||
| CNMD / CONMED Corporation | 0,01 | 0,00 | 0,46 | -13,78 | 0,0093 | -0,0021 | |||
| UNP / Union Pacific Corporation | 0,00 | 0,00 | 0,36 | -2,67 | 0,0073 | -0,0007 | |||
| XOM / Exxon Mobil Corporation | 0,00 | -12,89 | 0,36 | -21,04 | 0,0073 | -0,0025 | |||
| USB / U.S. Bancorp | 0,01 | 0,00 | 0,33 | 7,12 | 0,0066 | 0,0001 | |||
| MSCI / MSCI Inc. | 0,00 | 0,00 | 0,33 | 1,86 | 0,0066 | -0,0003 | |||
| ZTS / Zoetis Inc. | 0,00 | 0,00 | 0,32 | -5,07 | 0,0063 | -0,0008 | |||
| MCO / Moody's Corporation | 0,00 | 0,00 | 0,30 | 7,64 | 0,0059 | 0,0001 | |||
| COST / Costco Wholesale Corporation | 0,00 | 0,21 | 0,0041 | 0,0041 | |||||
| HGTY / Hagerty, Inc. | 0,00 | -100,00 | 0,00 | 0,0000 | |||||
| MKC / McCormick & Company, Incorporated | 0,00 | -100,00 | 0,00 | 0,0000 | |||||
| TROW / T. Rowe Price Group, Inc. | 0,00 | -100,00 | 0,00 | 0,0000 |