Statistiques de base
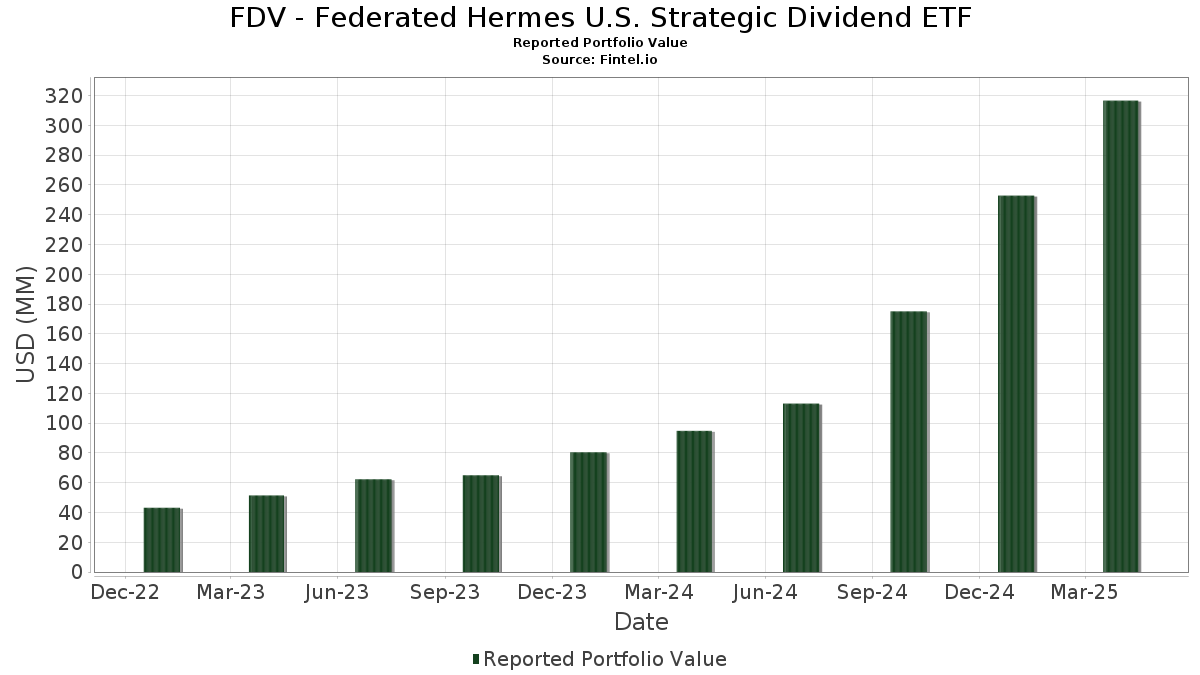
| Valeur du portefeuille | $ 316 655 480 |
| Positions actuelles | 51 |
Dernières positions, performances, ASG (à partir des dépôts 13F, 13D)
FDV - Federated Hermes U.S. Strategic Dividend ETF a déclaré un total de 51 positions dans ses derniers dépôts auprès de la SEC. La valeur la plus récente du portefeuille est calculée à 316 655 480 USD. Les actifs sous gestion réels (ASG) sont cette valeur plus les liquidités (qui ne sont pas divulguées). Les principales positions de FDV - Federated Hermes U.S. Strategic Dividend ETF sont Amgen Inc. (US:AMGN) , AbbVie Inc. (US:ABBV) , Duke Energy Corporation (US:DUK) , Philip Morris International Inc. (US:PM) , and Gilead Sciences, Inc. (US:GILD) . Les nouvelles positions de FDV - Federated Hermes U.S. Strategic Dividend ETF incluent FirstEnergy Corp. (US:FE) , Snap-on Incorporated (US:SNA) , Eastman Chemical Company (US:EMN) , HP Inc. (US:HPQ) , and Genuine Parts Company (US:GPC) .
Meilleures augmentations ce trimestre
Nous utilisons la variation de l'allocation du portefeuille car il s'agit de l'indicateur le plus significatif. Les changements peuvent être dus à des transactions ou à des variations de prix des actions.
| Titre | Actions (en millions) |
Valeur ($ en millions) |
% du portefeuille | ΔPortefeuille % |
|---|---|---|---|---|
| 0,13 | 5,54 | 1,7426 | 1,7426 | |
| 0,01 | 4,51 | 1,4182 | 1,4182 | |
| 0,04 | 3,22 | 1,0127 | 1,0127 | |
| 0,11 | 2,72 | 0,8564 | 0,8564 | |
| 0,08 | 5,51 | 1,7336 | 0,7666 | |
| 0,02 | 2,42 | 0,7604 | 0,7604 | |
| 0,06 | 11,32 | 3,5616 | 0,6610 | |
| 0,30 | 7,23 | 2,2745 | 0,6047 | |
| 0,07 | 7,13 | 2,2448 | 0,5946 | |
| 0,05 | 5,75 | 1,8097 | 0,5757 |
Principales baisses ce trimestre
Nous utilisons la variation de l'allocation du portefeuille car il s'agit de l'indicateur le plus significatif. Les changements peuvent être dus à des transactions ou à des variations de prix des actions.
| Titre | Actions (en millions) |
Valeur ($ en millions) |
% du portefeuille | ΔPortefeuille % |
|---|---|---|---|---|
| 0,05 | 2,68 | 0,8447 | -2,3627 | |
| 0,05 | 3,06 | 0,9641 | -1,0554 | |
| 0,07 | 8,13 | 2,5605 | -1,0368 | |
| 0,02 | 3,42 | 1,0775 | -0,9459 | |
| 0,09 | 5,04 | 1,5852 | -0,8327 | |
| 0,03 | 3,16 | 0,9947 | -0,6757 | |
| 0,06 | 4,93 | 1,5511 | -0,6539 | |
| 0,05 | 5,23 | 1,6467 | -0,6167 | |
| 0,05 | 8,43 | 2,6530 | -0,5817 | |
| 0,16 | 6,41 | 2,0170 | -0,3093 |
Déclarations 13F et dépôts de fonds
Ce formulaire a été déposé le 2025-06-24 pour la période de déclaration 2025-04-30. Cliquez sur l'icône du lien pour voir l'historique complet des transactions.
Mettre à niveau pour débloquer les données premium et exporter vers Excel ![]() .
.
| Titre | Type | Prix moyen de l'action | Actions (en millions) |
ΔActions (%) |
ΔActions (%) |
Valeur ($ en millions) |
Portefeuille (%) |
ΔPortefeuille (%) |
|
|---|---|---|---|---|---|---|---|---|---|
| AMGN / Amgen Inc. | 0,04 | 35,67 | 11,88 | 38,29 | 3,7401 | 0,3509 | |||
| ABBV / AbbVie Inc. | 0,06 | 45,04 | 11,32 | 53,88 | 3,5616 | 0,6610 | |||
| DUK / Duke Energy Corporation | 0,08 | 28,66 | 9,85 | 40,19 | 3,0999 | 0,3287 | |||
| PM / Philip Morris International Inc. | 0,06 | 17,34 | 9,66 | 54,44 | 3,0417 | 0,5735 | |||
| GILD / Gilead Sciences, Inc. | 0,09 | 15,14 | 9,20 | 26,21 | 2,8949 | 0,0203 | |||
| EVRG / Evergy, Inc. | 0,13 | 28,67 | 9,18 | 38,56 | 2,8899 | 0,2761 | |||
| CVX / Chevron Corporation | 0,07 | 28,42 | 9,12 | 17,11 | 2,8693 | -0,2008 | |||
| VZ / Verizon Communications Inc. | 0,20 | 28,73 | 8,76 | 43,99 | 2,7581 | 0,3579 | |||
| PNC / The PNC Financial Services Group, Inc. | 0,05 | 28,53 | 8,43 | 2,78 | 2,6530 | -0,5817 | |||
| JNJ / Johnson & Johnson | 0,05 | 29,16 | 8,38 | 32,70 | 2,6364 | 0,1466 | |||
| MS / Morgan Stanley | 0,07 | 6,98 | 8,13 | -10,80 | 2,5605 | -1,0368 | |||
| AEP / American Electric Power Company, Inc. | 0,07 | 41,27 | 7,94 | 55,59 | 2,4995 | 0,4866 | |||
| SO / The Southern Company | 0,09 | 5,31 | 7,88 | 15,28 | 2,4800 | -0,2160 | |||
| WEC / WEC Energy Group, Inc. | 0,07 | 28,74 | 7,78 | 42,05 | 2,4481 | 0,2884 | |||
| PLD / Prologis, Inc. | 0,07 | 44,31 | 7,58 | 23,67 | 2,3853 | -0,0316 | |||
| KVUE / Kenvue Inc. | 0,32 | 30,03 | 7,44 | 44,16 | 2,3428 | 0,3059 | |||
| PFE / Pfizer Inc. | 0,30 | 85,45 | 7,23 | 70,71 | 2,2745 | 0,6047 | |||
| XOM / Exxon Mobil Corporation | 0,07 | 72,40 | 7,13 | 70,48 | 2,2448 | 0,5946 | |||
| KO / The Coca-Cola Company | 0,10 | 28,86 | 7,01 | 47,27 | 2,2078 | 0,3291 | |||
| TFC / Truist Financial Corporation | 0,18 | 42,90 | 6,84 | 15,05 | 2,1536 | -0,1921 | |||
| BK / The Bank of New York Mellon Corporation | 0,08 | 28,49 | 6,72 | 20,22 | 2,1148 | -0,0894 | |||
| PEP / PepsiCo, Inc. | 0,05 | 28,84 | 6,72 | 15,92 | 2,1138 | -0,1713 | |||
| USB / U.S. Bancorp | 0,16 | 28,69 | 6,41 | 8,65 | 2,0170 | -0,3093 | |||
| DRI / Darden Restaurants, Inc. | 0,03 | 27,99 | 6,36 | 31,52 | 2,0030 | 0,0947 | |||
| KIM / Kimco Realty Corporation | 0,31 | 28,79 | 6,23 | 14,61 | 1,9602 | -0,1829 | |||
| O / Realty Income Corporation | 0,11 | 29,19 | 6,20 | 36,78 | 1,9515 | 0,1639 | |||
| NNN / NNN REIT, Inc. | 0,15 | 44,24 | 6,13 | 50,55 | 1,9293 | 0,3233 | |||
| NEE / NextEra Energy, Inc. | 0,09 | 52,26 | 6,05 | 42,31 | 1,9039 | 0,2273 | |||
| AMCR / Amcor plc | 0,65 | 74,40 | 5,96 | 65,11 | 1,8751 | 0,4516 | |||
| VLO / Valero Energy Corporation | 0,05 | 110,54 | 5,75 | 83,79 | 1,8097 | 0,5757 | |||
| FE / FirstEnergy Corp. | 0,13 | 5,54 | 1,7426 | 1,7426 | |||||
| MSM / MSC Industrial Direct Co., Inc. | 0,07 | 74,25 | 5,53 | 65,74 | 1,7422 | 0,4249 | |||
| MDLZ / Mondelez International, Inc. | 0,08 | 91,22 | 5,51 | 124,68 | 1,7336 | 0,7666 | |||
| TGT / Target Corporation | 0,05 | 30,02 | 5,23 | -8,84 | 1,6467 | -0,6167 | |||
| CSCO / Cisco Systems, Inc. | 0,09 | -13,76 | 5,04 | -17,83 | 1,5852 | -0,8327 | |||
| ETR / Entergy Corporation | 0,06 | -14,06 | 4,93 | -11,84 | 1,5511 | -0,6539 | |||
| CLX / The Clorox Company | 0,03 | 49,06 | 4,72 | 33,67 | 1,4859 | 0,0930 | |||
| SNA / Snap-on Incorporated | 0,01 | 4,51 | 1,4182 | 1,4182 | |||||
| PPL / PPL Corporation | 0,12 | 6,73 | 4,25 | 15,94 | 1,3370 | -0,1081 | |||
| BBY / Best Buy Co., Inc. | 0,06 | 54,97 | 4,22 | 20,34 | 1,3299 | -0,0546 | |||
| TXN / Texas Instruments Incorporated | 0,02 | 28,85 | 3,77 | 11,73 | 1,1878 | -0,1447 | |||
| CMCSA / Comcast Corporation | 0,10 | 28,82 | 3,55 | 30,89 | 1,1180 | 0,0476 | |||
| PAYX / Paychex, Inc. | 0,02 | -33,02 | 3,42 | -33,26 | 1,0775 | -0,9459 | |||
| EOG / EOG Resources, Inc. | 0,03 | 29,20 | 3,34 | 13,32 | 1,0525 | -0,1114 | |||
| EMN / Eastman Chemical Company | 0,04 | 3,22 | 1,0127 | 1,0127 | |||||
| UPS / United Parcel Service, Inc. | 0,03 | -10,56 | 3,16 | -25,37 | 0,9947 | -0,6757 | |||
| LYB / LyondellBasell Industries N.V. | 0,05 | -22,20 | 3,06 | -40,18 | 0,9641 | -1,0554 | |||
| HPQ / HP Inc. | 0,11 | 2,72 | 0,8564 | 0,8564 | |||||
| BMY / Bristol-Myers Squibb Company | 0,05 | -61,25 | 2,68 | -67,00 | 0,8447 | -2,3627 | |||
| JPM / JPMorgan Chase & Co. | 0,01 | 8,97 | 2,58 | -0,27 | 0,8117 | -0,2083 | |||
| GPC / Genuine Parts Company | 0,02 | 2,42 | 0,7604 | 0,7604 |