Statistiques de base
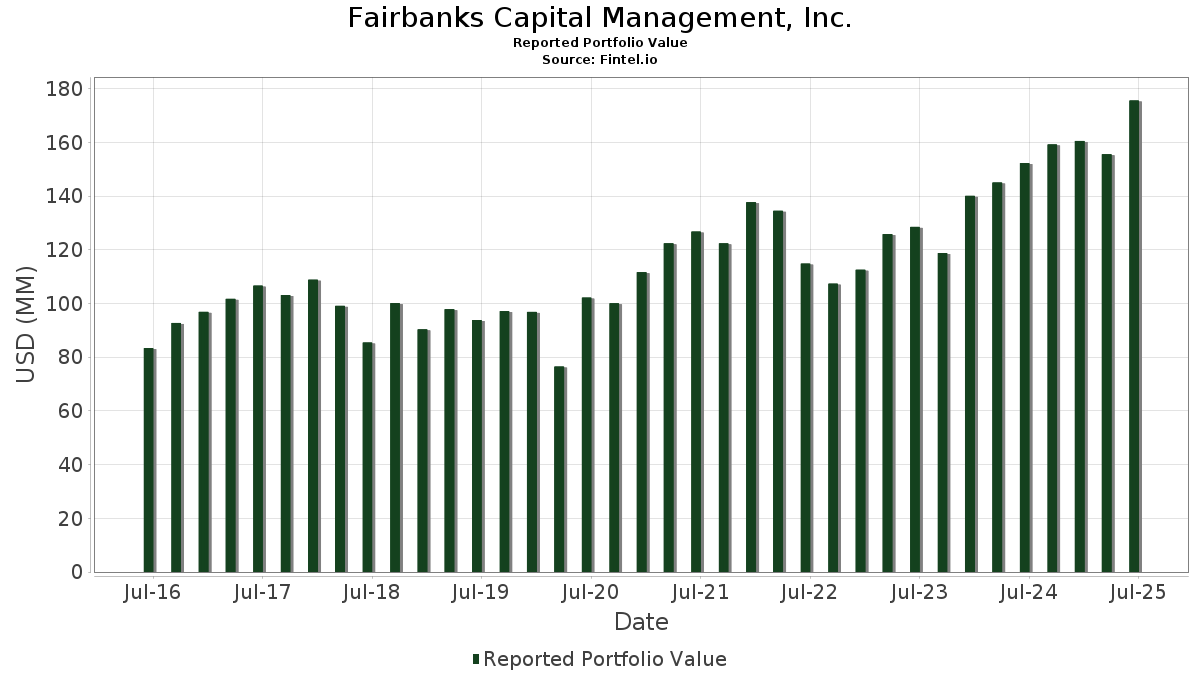
| Valeur du portefeuille | $ 175 559 223 |
| Positions actuelles | 53 |
Dernières positions, performances, ASG (à partir des dépôts 13F, 13D)
Fairbanks Capital Management, Inc. a déclaré un total de 53 positions dans ses derniers dépôts auprès de la SEC. La valeur la plus récente du portefeuille est calculée à 175 559 223 USD. Les actifs sous gestion réels (ASG) sont cette valeur plus les liquidités (qui ne sont pas divulguées). Les principales positions de Fairbanks Capital Management, Inc. sont Oracle Corporation (US:ORCL) , TransDigm Group Incorporated (US:TDG) , Broadcom Inc. (US:AVGO) , Microsoft Corporation (US:MSFT) , and Alliance Resource Partners, L.P. - Limited Partnership (US:ARLP) .
Meilleures augmentations ce trimestre
Nous utilisons la variation de l'allocation du portefeuille car il s'agit de l'indicateur le plus significatif. Les changements peuvent être dus à des transactions ou à des variations de prix des actions.
| Titre | Actions (en millions) |
Valeur ($ en millions) |
% du portefeuille | ΔPortefeuille % |
|---|---|---|---|---|
| 0,03 | 4,67 | 2,5883 | 2,3616 | |
| 0,03 | 9,11 | 5,0493 | 1,7024 | |
| 0,01 | 6,07 | 3,3653 | 1,0759 | |
| 0,02 | 9,10 | 5,0413 | 0,8620 | |
| 0,11 | 19,33 | 11,0087 | 0,5992 | |
| 0,02 | 5,25 | 2,9086 | 0,5814 | |
| 0,00 | 4,54 | 2,5189 | 0,3244 | |
| 0,01 | 1,99 | 1,1316 | 0,2730 | |
| 0,02 | 1,55 | 0,8848 | 0,2642 | |
| 0,03 | 7,42 | 4,2260 | 0,2310 |
Principales baisses ce trimestre
Nous utilisons la variation de l'allocation du portefeuille car il s'agit de l'indicateur le plus significatif. Les changements peuvent être dus à des transactions ou à des variations de prix des actions.
| Titre | Actions (en millions) |
Valeur ($ en millions) |
% du portefeuille | ΔPortefeuille % |
|---|---|---|---|---|
| 0,00 | 0,62 | 0,3540 | -2,2020 | |
| 0,04 | 6,86 | 3,7998 | -1,5637 | |
| 0,29 | 7,55 | 4,1851 | -0,9064 | |
| 0,01 | 1,70 | 0,9438 | -0,7697 | |
| 0,05 | 4,51 | 2,5667 | -0,7223 | |
| 0,14 | 5,06 | 2,8063 | -0,5611 | |
| 0,02 | 2,65 | 1,4663 | -0,5234 | |
| 0,02 | 5,99 | 3,3180 | -0,3899 | |
| 0,01 | 6,31 | 3,5949 | -0,2346 | |
| 0,01 | 1,65 | 0,9147 | -0,2006 |
Déclarations 13F et dépôts de fonds
Ce formulaire a été déposé le 2025-08-08 pour la période de déclaration 2025-06-30. Cliquez sur l'icône du lien pour voir l'historique complet des transactions.
Mettre à niveau pour débloquer les données premium et exporter vers Excel ![]() .
.
| Titre | Type | Prix moyen de l'action | Actions (en millions) |
ΔActions (%) |
ΔActions (%) |
Valeur ($ en millions) |
Portefeuille (%) |
ΔPortefeuille (%) |
|
|---|---|---|---|---|---|---|---|---|---|
| ORCL / Oracle Corporation | 0,11 | 5,62 | 19,33 | 19,36 | 11,0087 | 0,5992 | |||
| TDG / TransDigm Group Incorporated | 0,01 | 0,78 | 15,52 | 10,79 | 8,8410 | -0,1654 | |||
| AVGO / Broadcom Inc. | 0,03 | 6,28 | 9,11 | 74,97 | 5,0493 | 1,7024 | |||
| MSFT / Microsoft Corporation | 0,02 | 5,58 | 9,10 | 39,90 | 5,0413 | 0,8620 | |||
| ARLP / Alliance Resource Partners, L.P. - Limited Partnership | 0,29 | -0,51 | 7,55 | -4,67 | 4,1851 | -0,9064 | |||
| AMZN / Amazon.com, Inc. | 0,03 | 3,53 | 7,42 | 19,39 | 4,2260 | 0,2310 | |||
| NXST / Nexstar Media Group, Inc. | 0,04 | -14,85 | 6,86 | -17,84 | 3,7998 | -1,5637 | |||
| MA / Mastercard Incorporated | 0,01 | 3,34 | 6,31 | 5,96 | 3,5949 | -0,2346 | |||
| META / Meta Platforms, Inc. | 0,01 | 33,13 | 6,07 | 70,49 | 3,3653 | 1,0759 | |||
| V / Visa Inc. | 0,02 | 2,44 | 5,99 | 3,80 | 3,3180 | -0,3899 | |||
| TSM / Taiwan Semiconductor Manufacturing Company Limited - Depositary Receipt (Common Stock) | 0,02 | 6,24 | 5,25 | 44,94 | 2,9086 | 0,5814 | |||
| SU / Suncor Energy Inc. | 0,14 | -0,07 | 5,06 | -3,36 | 2,8063 | -0,5611 | |||
| GOOGL / Alphabet Inc. | 0,03 | 1 054,56 | 4,67 | 1 226,42 | 2,5883 | 2,3616 | |||
| BKNG / Booking Holdings Inc. | 0,00 | 5,94 | 4,54 | 33,14 | 2,5189 | 0,3244 | |||
| CHD / Church & Dwight Co., Inc. | 0,05 | 0,89 | 4,51 | -11,92 | 2,5667 | -0,7223 | |||
| FI / Fiserv, Inc. | 0,02 | 39,07 | 3,79 | 8,60 | 2,0996 | -0,1432 | |||
| INTU / Intuit Inc. | 0,00 | -2,10 | 3,68 | 25,60 | 2,0965 | 0,2126 | |||
| COST / Costco Wholesale Corporation | 0,00 | 5,96 | 3,57 | 10,90 | 2,0350 | -0,0358 | |||
| EFX / Equifax Inc. | 0,01 | 1,95 | 3,36 | 8,57 | 1,8616 | -0,1271 | |||
| MCO / Moody's Corporation | 0,01 | 6,16 | 3,17 | 14,34 | 1,8028 | 0,0234 | |||
| NDAQ / Nasdaq, Inc. | 0,03 | 6,40 | 2,95 | 25,43 | 1,6806 | 0,1683 | |||
| BSX / Boston Scientific Corporation | 0,03 | 6,68 | 2,76 | 13,59 | 1,5719 | 0,0101 | |||
| JAZZ / Jazz Pharmaceuticals plc | 0,02 | -0,01 | 2,65 | -14,54 | 1,4663 | -0,5234 | |||
| AAPL / Apple Inc. | 0,01 | 14,66 | 2,49 | 5,92 | 1,3785 | -0,1311 | |||
| AMD / Advanced Micro Devices, Inc. | 0,01 | 7,69 | 1,99 | 48,76 | 1,1316 | 0,2730 | |||
| AMT / American Tower Corporation | 0,01 | 6,32 | 1,95 | 8,04 | 1,0804 | -0,0800 | |||
| ICE / Intercontinental Exchange, Inc. | 0,01 | 6,22 | 1,82 | 12,94 | 1,0393 | 0,0010 | |||
| GME / GameStop Corp. | 0,07 | 0,00 | 1,80 | 9,30 | 1,0249 | -0,0336 | |||
| UNH / UnitedHealth Group Incorporated | 0,01 | 7,25 | 1,70 | -36,14 | 0,9438 | -0,7697 | |||
| BRO / Brown & Brown, Inc. | 0,01 | 6,73 | 1,65 | -4,90 | 0,9147 | -0,2006 | |||
| APH / Amphenol Corporation | 0,02 | 6,87 | 1,55 | 60,93 | 0,8848 | 0,2642 | |||
| SHW / The Sherwin-Williams Company | 0,00 | 6,88 | 1,50 | 5,12 | 0,8533 | -0,0630 | |||
| DPZ / Domino's Pizza, Inc. | 0,00 | 6,60 | 1,48 | 4,53 | 0,8411 | -0,0668 | |||
| MSCI / MSCI Inc. | 0,00 | 6,75 | 1,46 | 8,87 | 0,8318 | -0,0305 | |||
| ACN / Accenture plc | 0,00 | 7,01 | 1,41 | 2,54 | 0,8056 | -0,0814 | |||
| FAST / Fastenal Company | 0,02 | 112,45 | 1,02 | 15,05 | 0,5643 | -0,0045 | |||
| IQV / IQVIA Holdings Inc. | 0,01 | 6,24 | 0,98 | -5,02 | 0,5607 | -0,1056 | |||
| STZ / Constellation Brands, Inc. | 0,01 | 6,24 | 0,96 | -5,80 | 0,5313 | -0,1230 | |||
| GFL / GFL Environmental Inc. | 0,02 | 6,51 | 0,93 | 11,31 | 0,5130 | -0,0218 | |||
| BA / The Boeing Company | 0,00 | -3,52 | 0,88 | 18,50 | 0,5039 | 0,0241 | |||
| TMO / Thermo Fisher Scientific Inc. | 0,00 | 6,72 | 0,74 | -13,04 | 0,4220 | -0,1257 | |||
| UPST / Upstart Holdings, Inc. | 0,01 | -8,47 | 0,70 | 28,55 | 0,3872 | 0,0380 | |||
| HD / The Home Depot, Inc. | 0,00 | 4,75 | 0,69 | 4,83 | 0,3851 | -0,0411 | |||
| DIS / The Walt Disney Company | 0,01 | -1,74 | 0,65 | 23,53 | 0,3612 | 0,0219 | |||
| GOOGL / Alphabet Inc. | 0,00 | -86,14 | 0,62 | -84,38 | 0,3540 | -2,2020 | |||
| FIS / Fidelity National Information Services, Inc. | 0,01 | -7,44 | 0,60 | 0,85 | 0,3301 | -0,0493 | |||
| AXP / American Express Company | 0,00 | 0,00 | 0,58 | 18,53 | 0,3316 | 0,0159 | |||
| DG / Dollar General Corporation | 0,00 | 6,34 | 0,52 | 38,20 | 0,2891 | 0,0467 | |||
| VRSN / VeriSign, Inc. | 0,00 | -8,01 | 0,44 | 4,72 | 0,2462 | -0,0267 | |||
| PLTR / Palantir Technologies Inc. | 0,00 | 0,00 | 0,41 | 61,26 | 0,2329 | 0,0702 | |||
| PYPL / PayPal Holdings, Inc. | 0,00 | 0,00 | 0,30 | 13,79 | 0,1693 | 0,0015 | |||
| TTD / The Trade Desk, Inc. | 0,00 | 0,00 | 0,29 | 31,65 | 0,1596 | 0,0189 | |||
| VLO / Valero Energy Corporation | 0,00 | 0,00 | 0,24 | 1,68 | 0,1346 | -0,0188 | |||
| LRCX / Lam Research Corporation | 0,00 | -100,00 | 0,00 | 0,0000 | |||||
| GD / General Dynamics Corporation | 0,00 | -100,00 | 0,00 | 0,0000 |