Statistiques de base
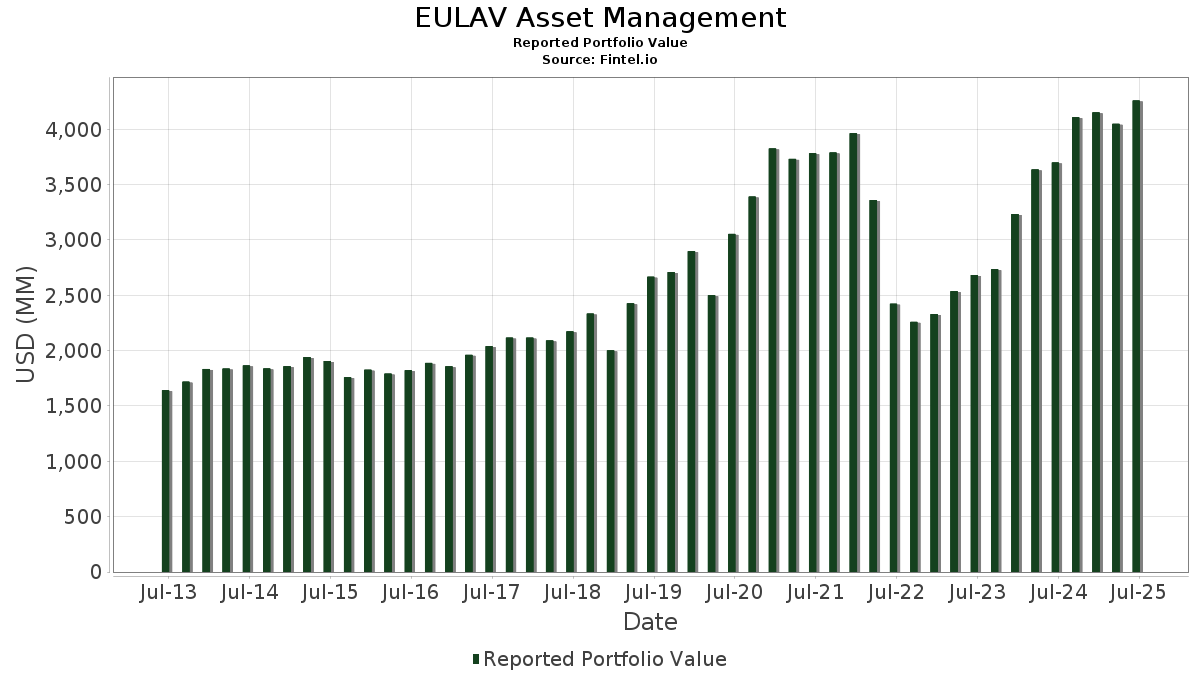
| Valeur du portefeuille | $ 4 259 348 107 |
| Positions actuelles | 160 |
Dernières positions, performances, ASG (à partir des dépôts 13F, 13D)
EULAV Asset Management a déclaré un total de 160 positions dans ses derniers dépôts auprès de la SEC. La valeur la plus récente du portefeuille est calculée à 4 259 348 107 USD. Les actifs sous gestion réels (ASG) sont cette valeur plus les liquidités (qui ne sont pas divulguées). Les principales positions de EULAV Asset Management sont HEICO Corporation (US:HEI) , Tyler Technologies, Inc. (US:TYL) , MSCI Inc. (US:MSCI) , Waste Connections, Inc. (US:WCN) , and Cintas Corporation (US:CTAS) .
Meilleures augmentations ce trimestre
Nous utilisons la variation de l'allocation du portefeuille car il s'agit de l'indicateur le plus significatif. Les changements peuvent être dus à des transactions ou à des variations de prix des actions.
| Titre | Actions (en millions) |
Valeur ($ en millions) |
% du portefeuille | ΔPortefeuille % |
|---|---|---|---|---|
| 0,13 | 71,11 | 1,6694 | 0,6138 | |
| 0,46 | 151,44 | 3,5554 | 0,5087 | |
| 0,06 | 20,66 | 0,4850 | 0,3868 | |
| 0,18 | 84,00 | 1,9720 | 0,3753 | |
| 0,38 | 60,22 | 1,4137 | 0,3427 | |
| 0,12 | 85,04 | 1,9966 | 0,3311 | |
| 0,12 | 70,50 | 1,6551 | 0,3276 | |
| 0,09 | 24,81 | 0,5826 | 0,2889 | |
| 0,13 | 67,70 | 1,5893 | 0,2803 | |
| 0,29 | 89,15 | 2,0930 | 0,2758 |
Principales baisses ce trimestre
Nous utilisons la variation de l'allocation du portefeuille car il s'agit de l'indicateur le plus significatif. Les changements peuvent être dus à des transactions ou à des variations de prix des actions.
| Titre | Actions (en millions) |
Valeur ($ en millions) |
% du portefeuille | ΔPortefeuille % |
|---|---|---|---|---|
| 0,04 | 64,87 | 1,5229 | -1,4923 | |
| 0,12 | 60,14 | 1,4121 | -0,4647 | |
| 0,62 | 115,90 | 2,7211 | -0,2713 | |
| 1,30 | 95,18 | 2,2346 | -0,2618 | |
| 0,08 | 24,55 | 0,5763 | -0,2184 | |
| 0,44 | 49,33 | 1,1581 | -0,2088 | |
| 0,31 | 48,70 | 1,1433 | -0,2022 | |
| 0,19 | 54,58 | 1,2815 | -0,1908 | |
| 0,22 | 87,80 | 2,0613 | -0,1903 | |
| 0,05 | 2,98 | 0,0699 | -0,1781 |
Déclarations 13F et dépôts de fonds
Ce formulaire a été déposé le 2025-08-12 pour la période de déclaration 2025-06-30. Cliquez sur l'icône du lien pour voir l'historique complet des transactions.
Mettre à niveau pour débloquer les données premium et exporter vers Excel ![]() .
.
| Titre | Type | Prix moyen de l'action | Actions (en millions) |
ΔActions (%) |
ΔActions (%) |
Valeur ($ en millions) |
Portefeuille (%) |
ΔPortefeuille (%) |
|
|---|---|---|---|---|---|---|---|---|---|
| HEI / HEICO Corporation | 0,46 | 0,00 | 151,44 | 22,76 | 3,5554 | 0,5087 | |||
| TYL / Tyler Technologies, Inc. | 0,25 | -0,00 | 147,67 | 1,97 | 3,4669 | -0,1097 | |||
| MSCI / MSCI Inc. | 0,20 | 0,01 | 117,64 | 1,99 | 2,7619 | -0,0867 | |||
| WCN / Waste Connections, Inc. | 0,62 | -0,00 | 115,90 | -4,34 | 2,7211 | -0,2713 | |||
| CTAS / Cintas Corporation | 0,50 | -8,92 | 111,80 | -1,23 | 2,6248 | -0,1707 | |||
| LII / Lennox International Inc. | 0,19 | 0,37 | 107,43 | 2,59 | 2,5221 | -0,0640 | |||
| FICO / Fair Isaac Corporation | 0,06 | 0,00 | 104,01 | -0,88 | 2,4419 | -0,1496 | |||
| WRB / W. R. Berkley Corporation | 1,30 | -8,80 | 95,18 | -5,84 | 2,2346 | -0,2618 | |||
| CDNS / Cadence Design Systems, Inc. | 0,29 | 0,00 | 89,15 | 21,16 | 2,0930 | 0,2758 | |||
| CASY / Casey's General Stores, Inc. | 0,17 | 2,11 | 88,89 | 20,04 | 2,0869 | 0,2582 | |||
| IT / Gartner, Inc. | 0,22 | 0,00 | 87,80 | -3,70 | 2,0613 | -0,1903 | |||
| MPWR / Monolithic Power Systems, Inc. | 0,12 | 0,00 | 85,04 | 26,10 | 1,9966 | 0,3311 | |||
| CACI / CACI International Inc | 0,18 | 0,00 | 84,00 | 29,92 | 1,9720 | 0,3753 | |||
| RSG / Republic Services, Inc. | 0,32 | -3,00 | 79,81 | -1,22 | 1,8737 | -0,1217 | |||
| MSI / Motorola Solutions, Inc. | 0,18 | 0,00 | 74,04 | -3,96 | 1,7384 | -0,1658 | |||
| FIX / Comfort Systems USA, Inc. | 0,13 | 0,00 | 71,11 | 66,36 | 1,6694 | 0,6138 | |||
| ROP / Roper Technologies, Inc. | 0,12 | 36,42 | 70,50 | 31,15 | 1,6551 | 0,3276 | |||
| IDXX / IDEXX Laboratories, Inc. | 0,13 | 0,00 | 67,70 | 27,72 | 1,5893 | 0,2803 | |||
| NOW / ServiceNow, Inc. | 0,06 | -2,72 | 66,17 | 25,62 | 1,5536 | 0,2526 | |||
| TDG / TransDigm Group Incorporated | 0,04 | -51,67 | 64,87 | -46,87 | 1,5229 | -1,4923 | |||
| AFG / American Financial Group, Inc. | 0,50 | 0,00 | 62,94 | -3,91 | 1,4778 | -0,1399 | |||
| CDW / CDW Corporation | 0,34 | 0,00 | 61,39 | 11,44 | 1,4412 | 0,0808 | |||
| NVDA / NVIDIA Corporation | 0,38 | -4,75 | 60,22 | 38,85 | 1,4137 | 0,3427 | |||
| CHE / Chemed Corporation | 0,12 | 0,02 | 60,14 | -20,85 | 1,4121 | -0,4647 | |||
| META / Meta Platforms, Inc. | 0,08 | -4,56 | 55,66 | 22,22 | 1,3069 | 0,1821 | |||
| COST / Costco Wholesale Corporation | 0,06 | -1,75 | 55,54 | 2,83 | 1,3039 | -0,0299 | |||
| ICE / Intercontinental Exchange, Inc. | 0,30 | 0,00 | 54,64 | 6,36 | 1,2829 | 0,0141 | |||
| POOL / Pool Corporation | 0,19 | 0,00 | 54,58 | -8,44 | 1,2815 | -0,1908 | |||
| BRO / Brown & Brown, Inc. | 0,44 | 0,00 | 49,33 | -10,88 | 1,1581 | -0,2088 | |||
| IQV / IQVIA Holdings Inc. | 0,31 | 0,00 | 48,70 | -10,61 | 1,1433 | -0,2022 | |||
| ATR / AptarGroup, Inc. | 0,31 | -0,00 | 48,22 | 5,42 | 1,1320 | 0,0025 | |||
| SYK / Stryker Corporation | 0,12 | 0,00 | 48,19 | 6,28 | 1,1315 | 0,0116 | |||
| TDY / Teledyne Technologies Incorporated | 0,09 | 17,42 | 47,64 | 20,87 | 1,1186 | 0,1451 | |||
| INTU / Intuit Inc. | 0,05 | -0,37 | 42,93 | 27,81 | 1,0080 | 0,1784 | |||
| GIB / CGI Inc. | 0,40 | 0,00 | 41,63 | 5,01 | 0,9774 | -0,0017 | |||
| SPGI / S&P Global Inc. | 0,07 | 0,00 | 35,96 | 3,78 | 0,8442 | -0,0115 | |||
| NFLX / Netflix, Inc. | 0,02 | -4,30 | 32,82 | 37,43 | 0,7704 | 0,1807 | |||
| AMZN / Amazon.com, Inc. | 0,15 | -1,67 | 32,37 | 13,39 | 0,7600 | 0,0549 | |||
| AMD / Advanced Micro Devices, Inc. | 0,23 | 17,53 | 32,35 | 62,33 | 0,7596 | 0,2673 | |||
| UBER / Uber Technologies, Inc. | 0,33 | -27,77 | 31,07 | -7,50 | 0,7294 | -0,1001 | |||
| WST / West Pharmaceutical Services, Inc. | 0,14 | 0,00 | 30,11 | -2,27 | 0,7069 | -0,0540 | |||
| CHDN / Churchill Downs Incorporated | 0,30 | 0,00 | 29,97 | -9,07 | 0,7037 | -0,1104 | |||
| RLI / RLI Corp. | 0,41 | 0,00 | 29,90 | -10,09 | 0,7020 | -0,1194 | |||
| MMC / Marsh & McLennan Companies, Inc. | 0,13 | 0,00 | 28,86 | -10,40 | 0,6776 | -0,1180 | |||
| GOOGL / Alphabet Inc. | 0,16 | 10,34 | 28,20 | 25,75 | 0,6620 | 0,1082 | |||
| MSFT / Microsoft Corporation | 0,06 | 2,73 | 28,12 | 36,12 | 0,6602 | 0,1500 | |||
| WWD / Woodward, Inc. | 0,11 | 5,58 | 27,84 | 41,80 | 0,6537 | 0,1687 | |||
| HOOD / Robinhood Markets, Inc. | 0,29 | -20,27 | 27,62 | 79,36 | 0,6485 | 0,2682 | |||
| EXEL / Exelixis, Inc. | 0,60 | 12,28 | 26,23 | 34,04 | 0,6158 | 0,1325 | |||
| EXPO / Exponent, Inc. | 0,35 | 0,00 | 25,78 | -7,83 | 0,6053 | -0,0856 | |||
| FSS / Federal Signal Corporation | 0,24 | 0,03 | 25,63 | 44,73 | 0,6018 | 0,1644 | |||
| MSTR / Strategy Inc | 0,06 | -16,67 | 25,26 | 16,85 | 0,5932 | 0,0592 | |||
| RBC / RBC Bearings Incorporated | 0,07 | 15,81 | 25,09 | 38,49 | 0,5890 | 0,1416 | |||
| SNPS / Synopsys, Inc. | 0,05 | -0,01 | 24,92 | 19,54 | 0,5850 | 0,0702 | |||
| AVGO / Broadcom Inc. | 0,09 | 26,75 | 24,81 | 108,69 | 0,5826 | 0,2889 | |||
| WSO / Watsco, Inc. | 0,06 | 0,00 | 24,69 | -13,12 | 0,5796 | -0,1222 | |||
| ACN / Accenture plc | 0,08 | -20,36 | 24,55 | -23,72 | 0,5763 | -0,2184 | |||
| COIN / Coinbase Global, Inc. | 0,07 | -10,39 | 24,19 | 82,37 | 0,5678 | 0,2403 | |||
| EXLS / ExlService Holdings, Inc. | 0,55 | 0,01 | 23,87 | -7,24 | 0,5604 | -0,0751 | |||
| ENSG / The Ensign Group, Inc. | 0,15 | 0,00 | 23,40 | 19,22 | 0,5494 | 0,0646 | |||
| WTS / Watts Water Technologies, Inc. | 0,09 | 15,44 | 22,64 | 39,20 | 0,5315 | 0,1298 | |||
| POST / Post Holdings, Inc. | 0,20 | 0,04 | 22,14 | -6,27 | 0,5198 | -0,0636 | |||
| FN / Fabrinet | 0,07 | 0,00 | 21,13 | 49,20 | 0,4961 | 0,1463 | |||
| TT / Trane Technologies plc | 0,05 | 0,00 | 21,00 | 29,82 | 0,4929 | 0,0935 | |||
| BMI / Badger Meter, Inc. | 0,08 | 3,67 | 20,75 | 33,48 | 0,4871 | 0,1032 | |||
| APP / AppLovin Corporation | 0,06 | 293,09 | 20,66 | 419,44 | 0,4850 | 0,3868 | |||
| V / Visa Inc. | 0,06 | -9,37 | 20,60 | -8,18 | 0,4837 | -0,0705 | |||
| AIT / Applied Industrial Technologies, Inc. | 0,08 | 20,34 | 19,53 | 24,14 | 0,4584 | 0,0700 | |||
| ZTS / Zoetis Inc. | 0,12 | 0,00 | 19,49 | -5,29 | 0,4577 | -0,0506 | |||
| TSLA / Tesla, Inc. | 0,06 | -1,63 | 19,38 | 20,58 | 0,4549 | 0,0580 | |||
| CRWD / CrowdStrike Holdings, Inc. | 0,03 | -18,57 | 17,42 | 17,63 | 0,4089 | 0,0432 | |||
| ROL / Rollins, Inc. | 0,30 | 0,00 | 17,19 | 4,42 | 0,4036 | -0,0030 | |||
| MTD / Mettler-Toledo International Inc. | 0,01 | 0,00 | 16,56 | -0,52 | 0,3889 | -0,0224 | |||
| AAON / AAON, Inc. | 0,21 | 0,00 | 15,38 | -5,61 | 0,3610 | -0,0413 | |||
| EXAS / Exact Sciences Corporation | 0,28 | -15,52 | 15,04 | 3,70 | 0,3531 | -0,0051 | |||
| SPSC / SPS Commerce, Inc. | 0,10 | 0,00 | 14,22 | 2,53 | 0,3339 | -0,0087 | |||
| CRS / Carpenter Technology Corporation | 0,05 | -0,06 | 13,54 | 52,45 | 0,3180 | 0,0986 | |||
| ROKU / Roku, Inc. | 0,15 | 30,43 | 13,18 | 62,75 | 0,3095 | 0,1095 | |||
| DKNG / DraftKings Inc. | 0,30 | 17,31 | 13,08 | 51,51 | 0,3071 | 0,0939 | |||
| CRM / Salesforce, Inc. | 0,05 | -8,65 | 12,95 | -7,18 | 0,3041 | -0,0405 | |||
| APPF / AppFolio, Inc. | 0,06 | 0,00 | 12,77 | 4,72 | 0,2998 | -0,0014 | |||
| MTSI / MACOM Technology Solutions Holdings, Inc. | 0,09 | 0,00 | 12,47 | 42,75 | 0,2928 | 0,0770 | |||
| MA / Mastercard Incorporated | 0,02 | 0,00 | 12,43 | 2,52 | 0,2918 | -0,0076 | |||
| PRI / Primerica, Inc. | 0,04 | 0,00 | 12,15 | -3,82 | 0,2853 | -0,0267 | |||
| RUSHA / Rush Enterprises, Inc. | 0,24 | 20,64 | 12,14 | 16,35 | 0,2851 | 0,0273 | |||
| GATX / GATX Corporation | 0,08 | 66,62 | 12,10 | 64,77 | 0,2841 | 0,1027 | |||
| MSA / MSA Safety Incorporated | 0,07 | 2,85 | 12,10 | 17,46 | 0,2840 | 0,0297 | |||
| JKHY / Jack Henry & Associates, Inc. | 0,07 | 0,00 | 12,02 | -1,33 | 0,2822 | -0,0187 | |||
| TMO / Thermo Fisher Scientific Inc. | 0,03 | 0,00 | 11,92 | -18,52 | 0,2799 | -0,0814 | |||
| GPI / Group 1 Automotive, Inc. | 0,03 | 0,00 | 11,27 | 14,33 | 0,2647 | 0,0212 | |||
| AYI / Acuity Inc. | 0,04 | 0,00 | 11,04 | 13,29 | 0,2592 | 0,0185 | |||
| MMSI / Merit Medical Systems, Inc. | 0,12 | 0,00 | 10,94 | -11,57 | 0,2568 | -0,0487 | |||
| SF / Stifel Financial Corp. | 0,10 | 0,00 | 10,84 | 10,10 | 0,2544 | 0,0113 | |||
| DHR / Danaher Corporation | 0,05 | 0,00 | 10,79 | -3,65 | 0,2532 | -0,0232 | |||
| KAI / Kadant Inc. | 0,03 | 0,00 | 10,67 | -5,78 | 0,2504 | -0,0292 | |||
| EME / EMCOR Group, Inc. | 0,02 | -46,43 | 10,49 | -22,48 | 0,2462 | -0,0879 | |||
| BKNG / Booking Holdings Inc. | 0,00 | -34,52 | 10,43 | -17,72 | 0,2449 | -0,0682 | |||
| VRTX / Vertex Pharmaceuticals Incorporated | 0,02 | -20,35 | 10,11 | -26,86 | 0,2373 | -0,1040 | |||
| PLUS / ePlus inc. | 0,14 | 0,00 | 10,02 | 18,13 | 0,2353 | 0,0258 | |||
| SHOP / Shopify Inc. | 0,08 | -11,58 | 9,69 | 6,82 | 0,2275 | 0,0035 | |||
| SIGI / Selective Insurance Group, Inc. | 0,11 | 0,00 | 9,55 | -5,34 | 0,2242 | -0,0250 | |||
| MDGL / Madrigal Pharmaceuticals, Inc. | 0,03 | 210,00 | 9,38 | 183,24 | 0,2203 | 0,1385 | |||
| SLGN / Silgan Holdings Inc. | 0,17 | 0,00 | 9,35 | 5,98 | 0,2196 | 0,0016 | |||
| CVCO / Cavco Industries, Inc. | 0,02 | 0,00 | 9,04 | -16,40 | 0,2121 | -0,0548 | |||
| WDAY / Workday, Inc. | 0,04 | -14,29 | 8,64 | -11,91 | 0,2028 | -0,0394 | |||
| RIVN / Rivian Automotive, Inc. | 0,62 | -8,82 | 8,52 | 0,61 | 0,2000 | -0,0091 | |||
| AJG / Arthur J. Gallagher & Co. | 0,03 | 0,00 | 8,13 | -7,28 | 0,1909 | -0,0257 | |||
| G / Genpact Limited | 0,18 | 0,00 | 7,92 | -12,65 | 0,1860 | -0,0380 | |||
| BLD / TopBuild Corp. | 0,02 | 0,00 | 7,90 | 6,17 | 0,1855 | 0,0017 | |||
| TXRH / Texas Roadhouse, Inc. | 0,04 | 0,00 | 7,80 | 12,48 | 0,1830 | 0,0118 | |||
| FFIN / First Financial Bankshares, Inc. | 0,21 | 0,00 | 7,43 | 0,16 | 0,1744 | -0,0088 | |||
| LLY / Eli Lilly and Company | 0,01 | 7,41 | 0,1739 | 0,1739 | |||||
| WING / Wingstop Inc. | 0,02 | 0,00 | 7,34 | 49,28 | 0,1723 | 0,0509 | |||
| CROX / Crocs, Inc. | 0,07 | 0,03 | 7,26 | -4,61 | 0,1705 | -0,0175 | |||
| CSL / Carlisle Companies Incorporated | 0,02 | 0,00 | 7,24 | 9,66 | 0,1701 | 0,0069 | |||
| FANG / Diamondback Energy, Inc. | 0,05 | -22,39 | 7,14 | -33,30 | 0,1677 | -0,0968 | |||
| JJSF / J&J Snack Foods Corp. | 0,06 | -31,59 | 7,12 | -41,10 | 0,1672 | -0,1314 | |||
| MEDP / Medpace Holdings, Inc. | 0,02 | 0,02 | 6,94 | 3,03 | 0,1629 | -0,0034 | |||
| NSIT / Insight Enterprises, Inc. | 0,05 | 0,01 | 6,89 | -7,93 | 0,1617 | -0,0230 | |||
| MU / Micron Technology, Inc. | 0,06 | 44,74 | 6,78 | 105,33 | 0,1591 | 0,0776 | |||
| AAPL / Apple Inc. | 0,03 | -35,30 | 6,78 | -40,24 | 0,1591 | -0,1210 | |||
| PGR / The Progressive Corporation | 0,03 | 0,00 | 6,75 | -5,71 | 0,1585 | -0,0183 | |||
| SAIC / Science Applications International Corporation | 0,06 | 0,05 | 6,71 | 0,34 | 0,1577 | -0,0076 | |||
| ANSS / ANSYS, Inc. | 0,02 | 0,00 | 6,64 | 10,97 | 0,1558 | 0,0081 | |||
| ACIW / ACI Worldwide, Inc. | 0,14 | -0,02 | 6,51 | -16,10 | 0,1528 | -0,0388 | |||
| SITE / SiteOne Landscape Supply, Inc. | 0,05 | 0,00 | 6,18 | -0,40 | 0,1451 | -0,0082 | |||
| ECL / Ecolab Inc. | 0,02 | 0,00 | 5,95 | 6,28 | 0,1398 | 0,0014 | |||
| GS / The Goldman Sachs Group, Inc. | 0,01 | -20,00 | 5,38 | 3,64 | 0,1263 | -0,0019 | |||
| AGO / Assured Guaranty Ltd. | 0,06 | 0,00 | 5,23 | -1,14 | 0,1227 | -0,0079 | |||
| BAC / Bank of America Corporation | 0,11 | -4,35 | 5,21 | 8,48 | 0,1222 | 0,0037 | |||
| BCPC / Balchem Corporation | 0,03 | 0,00 | 5,17 | -4,10 | 0,1215 | -0,0118 | |||
| BX / Blackstone Inc. | 0,03 | 13,33 | 5,09 | 21,27 | 0,1194 | 0,0158 | |||
| LSTR / Landstar System, Inc. | 0,03 | 0,00 | 4,70 | -7,45 | 0,1103 | -0,0151 | |||
| TNET / TriNet Group, Inc. | 0,06 | 0,03 | 4,63 | -7,66 | 0,1087 | -0,0151 | |||
| AWR / American States Water Company | 0,06 | 0,00 | 4,59 | -2,57 | 0,1078 | -0,0086 | |||
| IBKR / Interactive Brokers Group, Inc. | 0,07 | 204,82 | 4,05 | 1,99 | 0,0952 | -0,0030 | |||
| FELE / Franklin Electric Co., Inc. | 0,04 | -0,12 | 4,02 | -4,51 | 0,0944 | -0,0096 | |||
| SNAP / Snap Inc. | 0,46 | -30,30 | 4,00 | -30,46 | 0,0939 | -0,0481 | |||
| LYFT / Lyft, Inc. | 0,24 | 0,03 | 3,78 | 32,83 | 0,0888 | 0,0185 | |||
| JPM / JPMorgan Chase & Co. | 0,01 | -13,35 | 3,77 | 2,39 | 0,0885 | -0,0024 | |||
| DIS / The Walt Disney Company | 0,03 | 0,00 | 3,72 | 25,63 | 0,0873 | 0,0142 | |||
| TREX / Trex Company, Inc. | 0,06 | 0,00 | 3,48 | -6,40 | 0,0817 | -0,0101 | |||
| BABA / Alibaba Group Holding Limited - Depositary Receipt (Common Stock) | 0,03 | -3,33 | 3,29 | -17,10 | 0,0772 | -0,0208 | |||
| CXT / Crane NXT, Co. | 0,06 | 0,00 | 3,28 | 4,86 | 0,0769 | -0,0002 | |||
| HLT / Hilton Worldwide Holdings Inc. | 0,01 | -7,66 | 3,20 | 8,07 | 0,0751 | 0,0020 | |||
| DAL / Delta Air Lines, Inc. | 0,06 | -14,67 | 3,15 | -3,76 | 0,0739 | -0,0069 | |||
| QLYS / Qualys, Inc. | 0,02 | 0,04 | 3,10 | 13,51 | 0,0728 | 0,0053 | |||
| CMG / Chipotle Mexican Grill, Inc. | 0,05 | -73,50 | 2,98 | -70,37 | 0,0699 | -0,1781 | |||
| SNX / TD SYNNEX Corporation | 0,02 | 0,00 | 2,90 | 30,53 | 0,0682 | 0,0132 | |||
| WD / Walker & Dunlop, Inc. | 0,04 | 0,00 | 2,74 | -17,44 | 0,0644 | -0,0176 | |||
| NPO / Enpro Inc. | 0,01 | 0,00 | 2,53 | 18,41 | 0,0594 | 0,0066 | |||
| QCOM / QUALCOMM Incorporated | 0,02 | -16,51 | 2,39 | -13,42 | 0,0562 | -0,0121 | |||
| PYPL / PayPal Holdings, Inc. | 0,03 | 0,00 | 2,38 | 13,89 | 0,0558 | 0,0043 | |||
| DXCM / DexCom, Inc. | 0,03 | 0,00 | 2,36 | 27,87 | 0,0554 | 0,0098 | |||
| BMRN / BioMarin Pharmaceutical Inc. | 0,04 | -63,81 | 2,09 | -71,87 | 0,0490 | -0,1343 | |||
| PBH / Prestige Consumer Healthcare Inc. | 0,02 | 0,00 | 1,55 | -7,08 | 0,0364 | -0,0048 | |||
| HRI / Herc Holdings Inc. | 0,01 | 0,00 | 1,07 | -1,93 | 0,0250 | -0,0018 | |||
| ASGN / ASGN Incorporated | 0,02 | 0,00 | 1,00 | -20,77 | 0,0236 | -0,0077 | |||
| WK / Workiva Inc. | 0,01 | -84,42 | 0,81 | -85,96 | 0,0191 | -0,1241 | |||
| LFUS / Littelfuse, Inc. | 0,00 | 0,43 | 0,68 | 15,76 | 0,0160 | 0,0015 | |||
| ADBE / Adobe Inc. | 0,00 | -100,00 | 0,00 | 0,0000 | |||||
| LULU / lululemon athletica inc. | 0,00 | -100,00 | 0,00 | 0,0000 | |||||
| EPAM / EPAM Systems, Inc. | 0,00 | -100,00 | 0,00 | 0,0000 | |||||
| FCN / FTI Consulting, Inc. | 0,00 | -100,00 | 0,00 | 0,0000 | |||||
| USPH / U.S. Physical Therapy, Inc. | 0,00 | -100,00 | 0,00 | 0,0000 | |||||
| STZ / Constellation Brands, Inc. | 0,00 | -100,00 | 0,00 | 0,0000 |