Statistiques de base
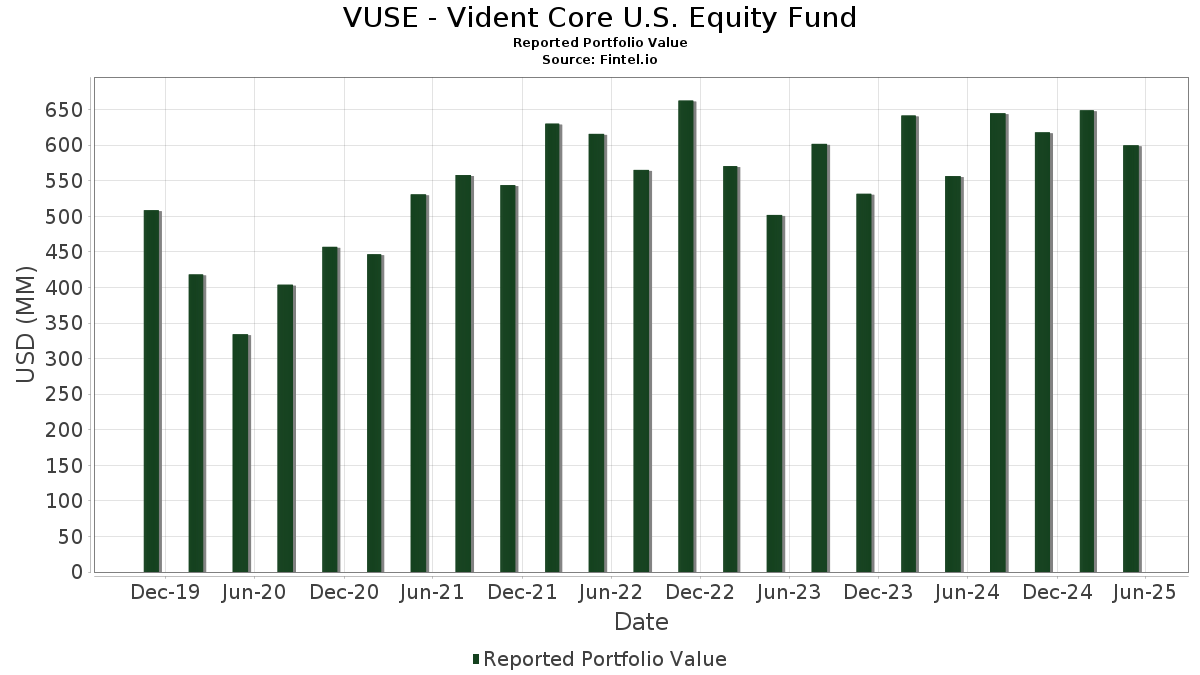
| Valeur du portefeuille | $ 599 849 716 |
| Positions actuelles | 129 |
Dernières positions, performances, ASG (à partir des dépôts 13F, 13D)
VUSE - Vident Core U.S. Equity Fund a déclaré un total de 129 positions dans ses derniers dépôts auprès de la SEC. La valeur la plus récente du portefeuille est calculée à 599 849 716 USD. Les actifs sous gestion réels (ASG) sont cette valeur plus les liquidités (qui ne sont pas divulguées). Les principales positions de VUSE - Vident Core U.S. Equity Fund sont Broadcom Inc. (US:AVGO) , Walmart Inc. (US:WMT) , NVIDIA Corporation (US:NVDA) , Oracle Corporation (US:ORCL) , and Microsoft Corporation (US:MSFT) . Les nouvelles positions de VUSE - Vident Core U.S. Equity Fund incluent Moody's Corporation (US:MCO) , Parker-Hannifin Corporation (US:PH) , CVB Financial Corp. (US:CVBF) , Clear Secure, Inc. (US:YOU) , and SBA Communications Corporation (US:SBAC) .
Meilleures augmentations ce trimestre
Nous utilisons la variation de l'allocation du portefeuille car il s'agit de l'indicateur le plus significatif. Les changements peuvent être dus à des transactions ou à des variations de prix des actions.
| Titre | Actions (en millions) |
Valeur ($ en millions) |
% du portefeuille | ΔPortefeuille % |
|---|---|---|---|---|
| 0,01 | 11,97 | 1,9954 | 1,1154 | |
| 0,02 | 5,99 | 0,9990 | 0,9990 | |
| 0,07 | 11,42 | 1,9036 | 0,9790 | |
| 0,02 | 6,56 | 1,0931 | 0,9639 | |
| 0,11 | 15,46 | 2,5773 | 0,9585 | |
| 0,01 | 5,70 | 0,9504 | 0,9504 | |
| 0,07 | 17,35 | 2,8910 | 0,8452 | |
| 0,07 | 11,88 | 1,9794 | 0,7762 | |
| 0,02 | 11,53 | 1,9224 | 0,7659 | |
| 0,03 | 5,23 | 0,8709 | 0,7282 |
Principales baisses ce trimestre
Nous utilisons la variation de l'allocation du portefeuille car il s'agit de l'indicateur le plus significatif. Les changements peuvent être dus à des transactions ou à des variations de prix des actions.
| Titre | Actions (en millions) |
Valeur ($ en millions) |
% du portefeuille | ΔPortefeuille % |
|---|---|---|---|---|
| 0,12 | 5,12 | 0,8525 | -1,0659 | |
| 0,01 | 0,58 | 0,0963 | -0,9464 | |
| 0,06 | 11,49 | 1,9150 | -0,8666 | |
| 0,05 | 3,57 | 0,5957 | -0,8073 | |
| 0,00 | 0,00 | -0,6489 | ||
| 0,04 | 2,23 | 0,3710 | -0,6048 | |
| 0,00 | 1,92 | 0,3207 | -0,4616 | |
| 0,02 | 4,05 | 0,6747 | -0,4257 | |
| 0,03 | 12,44 | 2,0739 | -0,4150 | |
| 0,01 | 1,93 | 0,3214 | -0,3167 |
Déclarations 13F et dépôts de fonds
Ce formulaire a été déposé le 2025-07-30 pour la période de déclaration 2025-05-31. Cliquez sur l'icône du lien pour voir l'historique complet des transactions.
Mettre à niveau pour débloquer les données premium et exporter vers Excel ![]() .
.
| Titre | Type | Prix moyen de l'action | Actions (en millions) |
ΔActions (%) |
ΔActions (%) |
Valeur ($ en millions) |
Portefeuille (%) |
ΔPortefeuille (%) |
|
|---|---|---|---|---|---|---|---|---|---|
| AVGO / Broadcom Inc. | 0,07 | 7,60 | 17,35 | 30,61 | 2,8910 | 0,8452 | |||
| WMT / Walmart Inc. | 0,16 | 1,27 | 15,70 | 1,38 | 2,6174 | 0,2312 | |||
| NVDA / NVIDIA Corporation | 0,11 | 36,03 | 15,46 | 47,15 | 2,5773 | 0,9585 | |||
| ORCL / Oracle Corporation | 0,09 | 6,21 | 14,51 | 5,87 | 2,4186 | 0,3072 | |||
| MSFT / Microsoft Corporation | 0,03 | 6,29 | 13,59 | 23,25 | 2,2643 | 0,5664 | |||
| MA / Mastercard Incorporated | 0,02 | -16,28 | 12,49 | -14,93 | 2,0815 | -0,1800 | |||
| V / Visa Inc. | 0,03 | -23,51 | 12,44 | -22,98 | 2,0739 | -0,4150 | |||
| AAPL / Apple Inc. | 0,06 | 14,53 | 12,11 | -4,88 | 2,0177 | 0,0571 | |||
| JPM / JPMorgan Chase & Co. | 0,05 | -16,30 | 12,04 | -16,51 | 2,0070 | -0,2147 | |||
| COST / Costco Wholesale Corporation | 0,01 | 111,27 | 11,97 | 109,59 | 1,9954 | 1,1154 | |||
| PG / The Procter & Gamble Company | 0,07 | 55,58 | 11,88 | 52,05 | 1,9794 | 0,7762 | |||
| META / Meta Platforms, Inc. | 0,02 | 58,54 | 11,53 | 53,64 | 1,9224 | 0,7659 | |||
| AMZN / Amazon.com, Inc. | 0,06 | -34,11 | 11,49 | -36,37 | 1,9150 | -0,8666 | |||
| HD / The Home Depot, Inc. | 0,03 | -2,32 | 11,48 | -9,29 | 1,9136 | -0,0362 | |||
| GOOGL / Alphabet Inc. | 0,07 | 88,67 | 11,42 | 90,29 | 1,9036 | 0,9790 | |||
| JNJ / Johnson & Johnson | 0,07 | 0,34 | 11,30 | -5,63 | 1,8833 | 0,0390 | |||
| ABBV / AbbVie Inc. | 0,06 | 50,74 | 10,87 | 34,21 | 1,8120 | 0,5641 | |||
| LLY / Eli Lilly and Company | 0,01 | 88,43 | 9,97 | 50,98 | 1,6625 | 0,6448 | |||
| NFLX / Netflix, Inc. | 0,01 | -30,44 | 9,10 | -14,37 | 1,5165 | -0,1203 | |||
| BKNG / Booking Holdings Inc. | 0,00 | -25,15 | 8,16 | -17,65 | 1,3604 | -0,1664 | |||
| TJX / The TJX Companies, Inc. | 0,06 | 23,24 | 7,78 | 25,35 | 1,2973 | 0,3408 | |||
| CMG / Chipotle Mexican Grill, Inc. | 0,15 | 6,70 | 7,29 | -0,99 | 1,2143 | 0,0807 | |||
| TDG / TransDigm Group Incorporated | 0,00 | 71,48 | 6,66 | 84,20 | 1,1097 | 0,5528 | |||
| UBER / Uber Technologies, Inc. | 0,08 | -24,23 | 6,56 | -16,09 | 1,0940 | -0,1112 | |||
| CEG / Constellation Energy Corporation | 0,02 | 61,71 | 6,56 | 976,85 | 1,0931 | 0,9639 | |||
| ADP / Automatic Data Processing, Inc. | 0,02 | -13,33 | 6,21 | -10,49 | 1,0357 | -0,0336 | |||
| ORLY / O'Reilly Automotive, Inc. | 0,00 | -21,94 | 6,19 | -5,52 | 1,0320 | 0,0144 | |||
| MCD / McDonald's Corporation | 0,02 | -6,40 | 6,08 | -4,72 | 1,0137 | 0,0303 | |||
| ECL / Ecolab Inc. | 0,02 | -25,33 | 6,00 | -26,27 | 1,0002 | -0,2537 | |||
| PGR / The Progressive Corporation | 0,02 | 5,99 | 0,9990 | 0,9990 | |||||
| MCO / Moody's Corporation | 0,01 | 5,70 | 0,9504 | 0,9504 | |||||
| MSI / Motorola Solutions, Inc. | 0,01 | -21,62 | 5,66 | -26,04 | 0,9436 | -0,2356 | |||
| ADBE / Adobe Inc. | 0,01 | 25,47 | 5,57 | 18,78 | 0,9279 | 0,2058 | |||
| FTNT / Fortinet, Inc. | 0,05 | -6,21 | 5,37 | -11,62 | 0,8952 | -0,0409 | |||
| FI / Fiserv, Inc. | 0,03 | 353,26 | 5,23 | 508,27 | 0,8709 | 0,7282 | |||
| TMUS / T-Mobile US, Inc. | 0,02 | 1,38 | 5,18 | -8,95 | 0,8635 | -0,0130 | |||
| BAC / Bank of America Corporation | 0,12 | -57,09 | 5,12 | -58,93 | 0,8525 | -1,0659 | |||
| ADSK / Autodesk, Inc. | 0,02 | -38,55 | 5,11 | -18,03 | 0,8512 | -0,1828 | |||
| EOG / EOG Resources, Inc. | 0,04 | 120,89 | 4,84 | 88,92 | 0,8072 | 0,4123 | |||
| IESC / IES Holdings, Inc. | 0,02 | 3,49 | 4,81 | 50,66 | 0,8017 | 0,3099 | |||
| PLTR / Palantir Technologies Inc. | 0,04 | -42,14 | 4,79 | -10,22 | 0,7978 | -0,0235 | |||
| CTAS / Cintas Corporation | 0,02 | 20,03 | 4,73 | 31,03 | 0,7883 | 0,2322 | |||
| EME / EMCOR Group, Inc. | 0,01 | -3,87 | 4,49 | 10,92 | 0,7485 | 0,1249 | |||
| SHW / The Sherwin-Williams Company | 0,01 | -22,58 | 4,43 | -23,33 | 0,7383 | -0,1516 | |||
| LAUR / Laureate Education, Inc. | 0,19 | 68,44 | 4,35 | 261,65 | 0,7246 | 0,4877 | |||
| ZTS / Zoetis Inc. | 0,03 | 10,21 | 4,33 | 11,14 | 0,7219 | 0,1215 | |||
| EXEL / Exelixis, Inc. | 0,10 | -13,71 | 4,32 | -4,00 | 0,7197 | 0,0268 | |||
| PH / Parker-Hannifin Corporation | 0,01 | 4,28 | 0,7133 | 0,7133 | |||||
| MAR / Marriott International, Inc. | 0,02 | -39,76 | 4,05 | -43,33 | 0,6747 | -0,4257 | |||
| CVLT / Commvault Systems, Inc. | 0,02 | -10,87 | 4,02 | -4,29 | 0,6695 | 0,0230 | |||
| WDAY / Workday, Inc. | 0,02 | -0,25 | 4,01 | -6,19 | 0,6692 | 0,0100 | |||
| ITW / Illinois Tool Works Inc. | 0,02 | -4,71 | 3,98 | -11,53 | 0,6625 | -0,0296 | |||
| IDCC / InterDigital, Inc. | 0,02 | -36,19 | 3,86 | -35,10 | 0,6434 | -0,2730 | |||
| FICO / Fair Isaac Corporation | 0,00 | 9,16 | 3,70 | -0,11 | 0,6174 | 0,0462 | |||
| CARG / CarGurus, Inc. | 0,12 | -26,91 | 3,67 | -20,97 | 0,6125 | -0,1093 | |||
| NOW / ServiceNow, Inc. | 0,00 | -13,01 | 3,67 | -5,39 | 0,6117 | 0,0140 | |||
| TW / Tradeweb Markets Inc. | 0,03 | 3,64 | 0,6059 | 0,6059 | |||||
| MRK / Merck & Co., Inc. | 0,05 | -52,89 | 3,57 | -60,77 | 0,5957 | -0,8073 | |||
| AMP / Ameriprise Financial, Inc. | 0,01 | -17,15 | 3,57 | -21,49 | 0,5956 | -0,1055 | |||
| CVBF / CVB Financial Corp. | 0,19 | 3,56 | 0,5927 | 0,5927 | |||||
| NYT / The New York Times Company | 0,06 | -8,54 | 3,54 | 8,61 | 0,5906 | 0,0881 | |||
| YOU / Clear Secure, Inc. | 0,14 | 3,41 | 0,5690 | 0,5690 | |||||
| CASH / Pathward Financial, Inc. | 0,04 | 12,54 | 3,39 | 13,34 | 0,5653 | 0,1043 | |||
| LNTH / Lantheus Holdings, Inc. | 0,04 | 381,26 | 3,34 | 241,76 | 0,5566 | 0,4048 | |||
| LOPE / Grand Canyon Education, Inc. | 0,02 | 3,32 | 0,5526 | 0,5526 | |||||
| MTG / MGIC Investment Corporation | 0,12 | 3,79 | 3,30 | 11,54 | 0,5495 | 0,0942 | |||
| FAST / Fastenal Company | 0,08 | 80,98 | 3,30 | -1,20 | 0,5492 | 0,0354 | |||
| SBAC / SBA Communications Corporation | 0,01 | 3,25 | 0,5410 | 0,5410 | |||||
| CBOE / Cboe Global Markets, Inc. | 0,01 | -26,76 | 3,24 | -18,32 | 0,5396 | -0,0756 | |||
| YELP / Yelp Inc. | 0,08 | -1,22 | 3,22 | 9,90 | 0,5364 | 0,0853 | |||
| EA / Electronic Arts Inc. | 0,02 | 10,34 | 3,19 | 22,85 | 0,5325 | 0,1319 | |||
| ACT / Enact Holdings, Inc. | 0,09 | 3,17 | 0,5290 | 0,5290 | |||||
| RMD / ResMed Inc. | 0,01 | -2,14 | 3,17 | 2,59 | 0,5289 | 0,0524 | |||
| TPL / Texas Pacific Land Corporation | 0,00 | 3,16 | 0,5260 | 0,5260 | |||||
| PAYX / Paychex, Inc. | 0,02 | -13,52 | 3,14 | -9,95 | 0,5232 | -0,0138 | |||
| VRSK / Verisk Analytics, Inc. | 0,01 | 97,39 | 3,11 | 108,80 | 0,5180 | 0,2887 | |||
| EQH / Equitable Holdings, Inc. | 0,06 | -37,39 | 2,96 | -39,84 | 0,4926 | -0,2641 | |||
| UTHR / United Therapeutics Corporation | 0,01 | -3,72 | 2,95 | -4,09 | 0,4919 | 0,0179 | |||
| WTS / Watts Water Technologies, Inc. | 0,01 | -30,74 | 2,93 | -17,78 | 0,4880 | -0,0664 | |||
| MORN / Morningstar, Inc. | 0,01 | 2,83 | 0,4722 | 0,4722 | |||||
| EPAC / Enerpac Tool Group Corp. | 0,07 | -19,44 | 2,82 | -25,34 | 0,4704 | -0,1119 | |||
| DECK / Deckers Outdoor Corporation | 0,03 | 2,80 | 0,4672 | 0,4672 | |||||
| VOYA / Voya Financial, Inc. | 0,04 | 37,13 | 2,77 | 58,28 | 0,4623 | -0,0381 | |||
| DBRG / DigitalBridge Group, Inc. | 0,25 | 7,24 | 2,77 | 4,29 | 0,4616 | 0,0526 | |||
| ADMA / ADMA Biologics, Inc. | 0,14 | 2,77 | 0,4613 | 0,4613 | |||||
| RAMP / LiveRamp Holdings, Inc. | 0,08 | -11,40 | 2,72 | 11,33 | 0,4537 | 0,0742 | |||
| CNR / Core Natural Resources, Inc. | 0,04 | 2,71 | 0,4518 | 0,4518 | |||||
| BMI / Badger Meter, Inc. | 0,01 | 57,12 | 2,67 | 85,48 | 0,4449 | 0,2232 | |||
| QLYS / Qualys, Inc. | 0,02 | -6,31 | 2,66 | -1,26 | 0,4441 | 0,0284 | |||
| ODFL / Old Dominion Freight Line, Inc. | 0,02 | 8,93 | 2,62 | -1,17 | 0,4368 | 0,0284 | |||
| INSW / International Seaways, Inc. | 0,07 | 2,55 | 0,4247 | 0,4247 | |||||
| MSCI / MSCI Inc. | 0,00 | -13,33 | 2,54 | -17,22 | 0,4231 | -0,0493 | |||
| NVR / NVR, Inc. | 0,00 | -34,56 | 2,41 | -26,98 | 0,4021 | -0,1463 | |||
| VMI / Valmont Industries, Inc. | 0,01 | 2,40 | 0,3994 | 0,3994 | |||||
| NTAP / NetApp, Inc. | 0,02 | -14,49 | 2,39 | 17,83 | 0,3988 | -0,0203 | |||
| SEZL / Sezzle Inc. | 0,02 | 2,39 | 0,3978 | 0,3978 | |||||
| APP / AppLovin Corporation | 0,01 | 2,36 | 0,3940 | 0,3940 | |||||
| DOCU / DocuSign, Inc. | 0,03 | 10,97 | 2,35 | 18,23 | 0,3915 | 0,0854 | |||
| CRUS / Cirrus Logic, Inc. | 0,02 | 1,89 | 2,34 | -3,82 | 0,3899 | 0,0152 | |||
| CRVL / CorVel Corporation | 0,02 | 2,32 | 0,3872 | 0,3872 | |||||
| PLAB / Photronics, Inc. | 0,14 | 10,77 | 2,31 | -11,20 | 0,3848 | -0,0156 | |||
| ANET / Arista Networks Inc | 0,03 | 0,08 | 2,31 | -6,83 | 0,3843 | 0,0031 | |||
| DLB / Dolby Laboratories, Inc. | 0,03 | 2,31 | 0,3843 | 0,3843 | |||||
| RMBS / Rambus Inc. | 0,04 | -24,97 | 2,30 | -28,24 | 0,3826 | -0,1101 | |||
| MO / Altria Group, Inc. | 0,04 | -67,62 | 2,23 | -64,86 | 0,3710 | -0,6048 | |||
| ATEN / A10 Networks, Inc. | 0,13 | 2,21 | 0,3686 | 0,3686 | |||||
| AAON / AAON, Inc. | 0,02 | 2,13 | 0,3558 | 0,3558 | |||||
| CAT / Caterpillar Inc. | 0,01 | -53,99 | 1,93 | -53,45 | 0,3214 | -0,3167 | |||
| KLAC / KLA Corporation | 0,00 | -64,52 | 1,92 | -62,13 | 0,3207 | -0,4616 | |||
| CSL / Carlisle Companies Incorporated | 0,00 | -15,83 | 1,65 | -6,09 | 0,2749 | 0,0043 | |||
| HIMS / Hims & Hers Health, Inc. | 0,03 | 1,60 | 0,2670 | 0,2670 | |||||
| VST / Vistra Corp. | 0,01 | -55,25 | 1,55 | -46,26 | 0,2588 | -0,1862 | |||
| MANH / Manhattan Associates, Inc. | 0,01 | -2,11 | 1,52 | 4,48 | 0,2526 | 0,0291 | |||
| MPWR / Monolithic Power Systems, Inc. | 0,00 | 1,50 | 0,2493 | 0,2493 | |||||
| MSA / MSA Safety Incorporated | 0,01 | 1,49 | 0,2484 | 0,2484 | |||||
| JLL / Jones Lang LaSalle Incorporated | 0,01 | -51,60 | 1,22 | -60,38 | 0,2031 | -0,2705 | |||
| CRWD / CrowdStrike Holdings, Inc. | 0,00 | -58,47 | 1,15 | -49,80 | 0,1922 | -0,1614 | |||
| U.S. Bank Money Market Deposit Account / STIV (8AMMF0A84) | 1,06 | 59,79 | 1,06 | 59,82 | 0,1764 | 0,0744 | |||
| DOCS / Doximity, Inc. | 0,02 | 1,04 | 0,1736 | 0,1736 | |||||
| WHD / Cactus, Inc. | 0,02 | 1,01 | 0,1684 | 0,1684 | |||||
| ABNB / Airbnb, Inc. | 0,01 | -5,01 | 0,85 | -11,78 | 0,1424 | -0,0067 | |||
| SPG / Simon Property Group, Inc. | 0,01 | 7,72 | 0,85 | -5,58 | 0,1411 | 0,0029 | |||
| CRM / Salesforce, Inc. | 0,00 | 0,83 | 0,1376 | 0,1376 | |||||
| AMR / Alpha Metallurgical Resources, Inc. | 0,01 | -60,15 | 0,75 | -67,56 | 0,1252 | -0,2311 | |||
| SEIC / SEI Investments Company | 0,01 | -2,12 | 0,74 | 4,24 | 0,1229 | 0,0139 | |||
| MEDP / Medpace Holdings, Inc. | 0,00 | -45,17 | 0,59 | -50,63 | 0,0987 | -0,0860 | |||
| PINS / Pinterest, Inc. | 0,02 | -57,85 | 0,58 | -64,56 | 0,0971 | -0,1560 | |||
| GILD / Gilead Sciences, Inc. | 0,01 | -94,35 | 0,58 | -91,37 | 0,0963 | -0,9464 | |||
| CMCSA / Comcast Corporation | 0,02 | -19,90 | 0,56 | -22,81 | 0,0926 | -0,0183 | |||
| NRG / NRG Energy, Inc. | 0,00 | -100,00 | 0,00 | -100,00 | -0,6489 | ||||
| PANW / Palo Alto Networks, Inc. | 0,00 | -100,00 | 0,00 | -100,00 | -0,2508 | ||||
| NSSC / Napco Security Technologies, Inc. | 0,00 | -100,00 | 0,00 | -100,00 | -0,1725 |