Statistiques de base
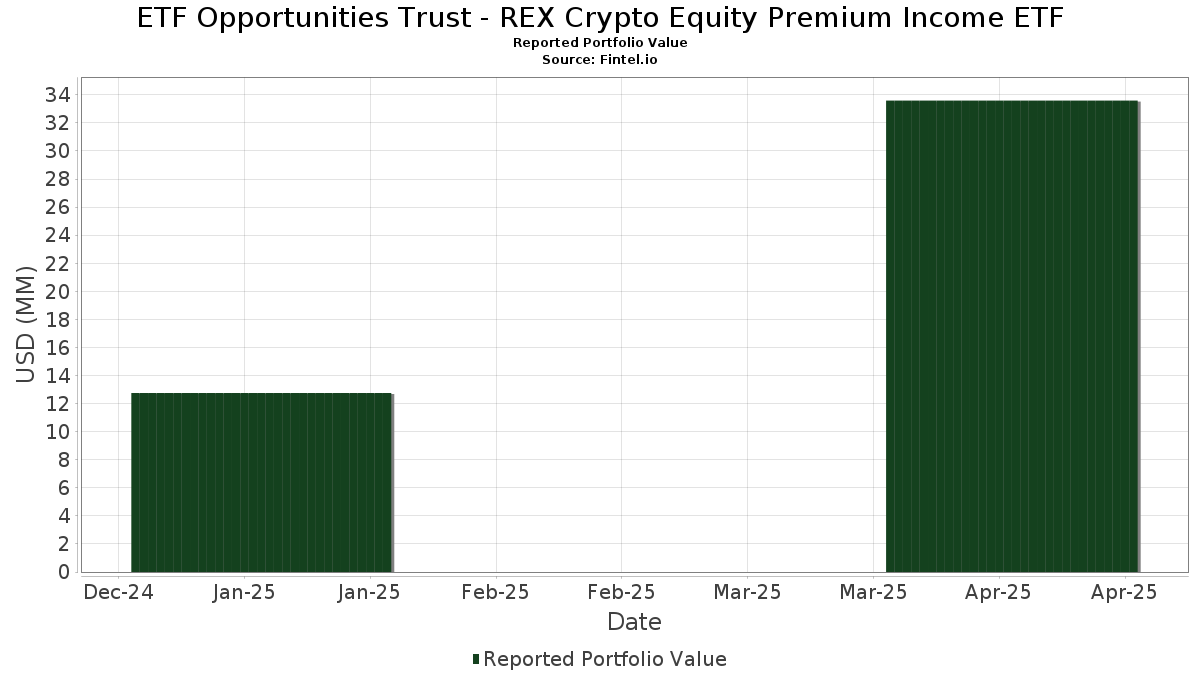
| Valeur du portefeuille | $ 33 588 821 |
| Positions actuelles | 87 |
Dernières positions, performances, ASG (à partir des dépôts 13F, 13D)
ETF Opportunities Trust - REX Crypto Equity Premium Income ETF a déclaré un total de 87 positions dans ses derniers dépôts auprès de la SEC. La valeur la plus récente du portefeuille est calculée à 33 588 821 USD. Les actifs sous gestion réels (ASG) sont cette valeur plus les liquidités (qui ne sont pas divulguées). Les principales positions de ETF Opportunities Trust - REX Crypto Equity Premium Income ETF sont Robinhood Markets, Inc. (US:HOOD) , Strategy Inc (US:MSTR) , Nu Holdings Ltd. (US:NU) , Coinbase Global, Inc. (US:COIN) , and Micron Technology, Inc. (US:MU) .
Meilleures augmentations ce trimestre
Nous utilisons la variation de l'allocation du portefeuille car il s'agit de l'indicateur le plus significatif. Les changements peuvent être dus à des transactions ou à des variations de prix des actions.
| Titre | Actions (en millions) |
Valeur ($ en millions) |
% du portefeuille | ΔPortefeuille % |
|---|---|---|---|---|
| 0,02 | 1,78 | 5,3017 | 1,1153 | |
| 0,01 | 1,99 | 5,9470 | 0,9882 | |
| 0,15 | 0,68 | 2,0278 | 0,8076 | |
| 0,34 | 0,95 | 2,8225 | 0,7630 | |
| 0,14 | 1,82 | 5,4317 | 0,7306 | |
| 0,02 | 1,75 | 5,2113 | 0,5523 | |
| 0,01 | 1,65 | 4,9170 | 0,4521 | |
| 0,01 | 1,81 | 5,4111 | 0,4409 | |
| 0,01 | 1,94 | 5,8003 | 0,3784 | |
| 0,02 | 1,83 | 5,4588 | 0,3439 |
Principales baisses ce trimestre
Nous utilisons la variation de l'allocation du portefeuille car il s'agit de l'indicateur le plus significatif. Les changements peuvent être dus à des transactions ou à des variations de prix des actions.
| Titre | Actions (en millions) |
Valeur ($ en millions) |
% du portefeuille | ΔPortefeuille % |
|---|---|---|---|---|
| 0,00 | 0,00 | -3,4702 | ||
| 0,01 | 0,51 | 1,5332 | -1,3040 | |
| 0,00 | 0,00 | -0,9267 | ||
| -0,15 | -0,4559 | -0,4559 | ||
| -0,15 | -0,4512 | -0,4512 | ||
| -0,15 | -0,4493 | -0,4493 | ||
| 0,00 | 1,70 | 5,0685 | -0,4019 | |
| -0,13 | -0,3732 | -0,3732 | ||
| -0,11 | -0,3186 | -0,3186 | ||
| -0,10 | -0,3040 | -0,3040 |
Déclarations 13F et dépôts de fonds
Ce formulaire a été déposé le 2025-06-26 pour la période de déclaration 2025-04-30. Cliquez sur l'icône du lien pour voir l'historique complet des transactions.
Mettre à niveau pour débloquer les données premium et exporter vers Excel ![]() .
.
| Titre | Type | Prix moyen de l'action | Actions (en millions) |
ΔActions (%) |
ΔActions (%) |
Valeur ($ en millions) |
Portefeuille (%) |
ΔPortefeuille (%) |
|
|---|---|---|---|---|---|---|---|---|---|
| HOOD / Robinhood Markets, Inc. | 0,04 | 187,38 | 2,19 | 171,71 | 6,5328 | 0,2050 | |||
| MSTR / Strategy Inc | 0,01 | 177,95 | 1,99 | 215,85 | 5,9470 | 0,9882 | |||
| NU / Nu Holdings Ltd. | 0,16 | 174,02 | 1,99 | 157,36 | 5,9441 | -0,1361 | |||
| COIN / Coinbase Global, Inc. | 0,01 | 304,22 | 1,94 | 181,74 | 5,8003 | 0,3784 | |||
| MU / Micron Technology, Inc. | 0,02 | 232,99 | 1,83 | 181,11 | 5,4588 | 0,3439 | |||
| MARA / MARA Holdings, Inc. | 0,14 | 317,06 | 1,82 | 204,35 | 5,4317 | 0,7306 | |||
| TSLA / Tesla, Inc. | 0,01 | 310,80 | 1,81 | 186,57 | 5,4111 | 0,4409 | |||
| NVDA / NVIDIA Corporation | 0,02 | 267,36 | 1,78 | 233,40 | 5,3017 | 1,1153 | |||
| TSM / Taiwan Semiconductor Manufacturing Company Limited - Depositary Receipt (Common Stock) | 0,01 | 240,75 | 1,75 | 171,27 | 5,2134 | 0,1578 | |||
| AMD / Advanced Micro Devices, Inc. | 0,02 | 250,58 | 1,75 | 194,60 | 5,2113 | 0,5523 | |||
| MA / Mastercard Incorporated | 0,00 | 155,19 | 1,72 | 151,90 | 5,1399 | -0,2313 | |||
| CLSK / CleanSpark, Inc. | 0,21 | 253,93 | 1,72 | 177,10 | 5,1257 | 0,2559 | |||
| V / Visa Inc. | 0,00 | 141,20 | 1,70 | 144,11 | 5,0685 | -0,4019 | |||
| IBKR / Interactive Brokers Group, Inc. | 0,01 | 266,67 | 1,65 | 190,14 | 4,9170 | 0,4521 | |||
| RIOT / Riot Platforms, Inc. | 0,22 | 314,41 | 1,56 | 152,84 | 4,6550 | -0,1952 | |||
| PYPL / PayPal Holdings, Inc. | 0,02 | 235,16 | 1,52 | 149,18 | 4,5195 | -0,2544 | |||
| FXFXX / First American Funds Inc - First American Treasury Obligations Fund Class X | 1,23 | 168,03 | 1,23 | 168,27 | 3,6588 | 0,0668 | |||
| XYZ / Block, Inc. | 0,02 | 313,89 | 1,05 | 166,33 | 3,1401 | 0,0391 | |||
| CORZ / Core Scientific, Inc. | 0,12 | 346,63 | 1,01 | 194,74 | 3,0081 | 0,3234 | |||
| WULF / TeraWulf Inc. | 0,34 | 518,79 | 0,95 | 261,07 | 2,8225 | 0,7630 | |||
| FI / Fiserv, Inc. | 0,00 | 209,79 | 0,77 | 164,95 | 2,3008 | 0,0132 | |||
| APLD / Applied Digital Corporation | 0,15 | 585,85 | 0,68 | 338,06 | 2,0278 | 0,8076 | |||
| RMBS / Rambus Inc. | 0,01 | 79,59 | 0,51 | 42,38 | 1,5332 | -1,3040 | |||
| CIFR / Cipher Mining Inc. | 0,16 | 445,83 | 0,46 | 171,60 | 1,3717 | 0,0422 | |||
| BTBT / Bit Digital, Inc. | 0,00 | -100,00 | 0,00 | -100,00 | -0,9267 | ||||
| IREN / IREN Limited | 0,00 | -100,00 | 0,00 | -100,00 | -3,4702 | ||||
| Bitdeer Technologies Group / DE (N/A) | -0,00 | -0,0008 | -0,0008 | ||||||
| Fiserv Inc / DE (N/A) | -0,00 | -0,0009 | -0,0009 | ||||||
| Mastercard Inc / DE (N/A) | -0,00 | -0,0009 | -0,0009 | ||||||
| Mastercard Inc / DE (N/A) | -0,00 | -0,0009 | -0,0009 | ||||||
| IREN Ltd / DE (N/A) | -0,00 | -0,0010 | -0,0010 | ||||||
| Rambus Inc / DE (N/A) | -0,00 | -0,0011 | -0,0011 | ||||||
| Cipher Mining Inc / DE (N/A) | -0,00 | -0,0013 | -0,0013 | ||||||
| Cipher Mining Inc / DE (N/A) | -0,00 | -0,0014 | -0,0014 | ||||||
| Fiserv Inc / DE (N/A) | -0,00 | -0,0022 | -0,0022 | ||||||
| Taiwan Semiconductor Manufacturing Co Ltd / DE (N/A) | -0,00 | -0,0026 | -0,0026 | ||||||
| Visa Inc / DE (N/A) | -0,00 | -0,0028 | -0,0028 | ||||||
| PayPal Holdings Inc / DE (N/A) | -0,00 | -0,0029 | -0,0029 | ||||||
| Bitdeer Technologies Group / DE (N/A) | -0,00 | -0,0031 | -0,0031 | ||||||
| Bitdeer Technologies Group / DE (N/A) | -0,00 | -0,0032 | -0,0032 | ||||||
| NVIDIA Corp / DE (N/A) | -0,00 | -0,0033 | -0,0033 | ||||||
| NVIDIA Corp / DE (N/A) | -0,00 | -0,0033 | -0,0033 | ||||||
| IREN Ltd / DE (N/A) | -0,00 | -0,0037 | -0,0037 | ||||||
| PayPal Holdings Inc / DE (N/A) | -0,00 | -0,0043 | -0,0043 | ||||||
| NVIDIA Corp / DE (N/A) | -0,00 | -0,0047 | -0,0047 | ||||||
| Core Scientific Inc / DE (N/A) | -0,00 | -0,0048 | -0,0048 | ||||||
| Block Inc / DE (N/A) | -0,00 | -0,0051 | -0,0051 | ||||||
| Micron Technology Inc / DE (N/A) | -0,00 | -0,0058 | -0,0058 | ||||||
| Terawulf Inc / DE (N/A) | -0,00 | -0,0066 | -0,0066 | ||||||
| Taiwan Semiconductor Manufacturing Co Ltd / DE (N/A) | -0,00 | -0,0082 | -0,0082 | ||||||
| Tesla Inc / DE (N/A) | -0,00 | -0,0090 | -0,0090 | ||||||
| Tesla Inc / DE (N/A) | -0,00 | -0,0090 | -0,0090 | ||||||
| Riot Platforms Inc / DE (N/A) | -0,00 | -0,0105 | -0,0105 | ||||||
| Advanced Micro Devices Inc / DE (N/A) | -0,00 | -0,0105 | -0,0105 | ||||||
| Cleanspark Inc / DE (N/A) | -0,00 | -0,0113 | -0,0113 | ||||||
| Terawulf Inc / DE (N/A) | -0,00 | -0,0125 | -0,0125 | ||||||
| NU Holdings Ltd/Cayman Islands / DE (N/A) | -0,00 | -0,0125 | -0,0125 | ||||||
| Coinbase Global Inc / DE (N/A) | -0,00 | -0,0125 | -0,0125 | ||||||
| MicroStrategy Inc / DE (N/A) | -0,01 | -0,0155 | -0,0155 | ||||||
| MicroStrategy Inc / DE (N/A) | -0,01 | -0,0155 | -0,0155 | ||||||
| MARA Holdings Inc / DE (N/A) | -0,01 | -0,0159 | -0,0159 | ||||||
| Visa Inc / DE (N/A) | -0,01 | -0,0185 | -0,0185 | ||||||
| Robinhood Markets Inc / DE (N/A) | -0,01 | -0,0204 | -0,0204 | ||||||
| Coinbase Global Inc / DE (N/A) | -0,01 | -0,0217 | -0,0217 | ||||||
| Coinbase Global Inc / DE (N/A) | -0,01 | -0,0217 | -0,0217 | ||||||
| Robinhood Markets Inc / DE (N/A) | -0,01 | -0,0226 | -0,0226 | ||||||
| Tesla Inc / DE (N/A) | -0,01 | -0,0228 | -0,0228 | ||||||
| Rambus Inc / DE (N/A) | -0,02 | -0,0464 | -0,0464 | ||||||
| PayPal Holdings Inc / DE (N/A) | -0,03 | -0,0789 | -0,0789 | ||||||
| Applied Digital Corp / DE (N/A) | -0,03 | -0,1027 | -0,1027 | ||||||
| Mastercard Inc / DE (N/A) | -0,03 | -0,1028 | -0,1028 | ||||||
| Taiwan Semiconductor Manufacturing Co Ltd / DE (N/A) | -0,04 | -0,1124 | -0,1124 | ||||||
| Cipher Mining Inc / DE (N/A) | -0,04 | -0,1193 | -0,1193 | ||||||
| Advanced Micro Devices Inc / DE (N/A) | -0,05 | -0,1391 | -0,1391 | ||||||
| Block Inc / DE (N/A) | -0,05 | -0,1526 | -0,1526 | ||||||
| Riot Platforms Inc / DE (N/A) | -0,06 | -0,1771 | -0,1771 | ||||||
| Terawulf Inc / DE (N/A) | -0,06 | -0,1809 | -0,1809 | ||||||
| Interactive Brokers Group Inc / DE (N/A) | -0,07 | -0,1969 | -0,1969 | ||||||
| Interactive Brokers Group Inc / DE (N/A) | -0,07 | -0,1969 | -0,1969 | ||||||
| Core Scientific Inc / DE (N/A) | -0,07 | -0,2012 | -0,2012 | ||||||
| IREN Ltd / DE (N/A) | 0,18 | -0,09 | -0,2734 | -0,2734 | |||||
| IREN Ltd / DE (N/A) | -0,09 | -0,2734 | -0,2734 | ||||||
| Bitdeer Technologies Group / DE (N/A) | -0,10 | -0,3040 | -0,3040 | ||||||
| Bitdeer Technologies Group / DE (N/A) | 0,05 | -0,10 | -0,3040 | -0,3040 | |||||
| Micron Technology Inc / DE (N/A) | -0,11 | -0,3186 | -0,3186 | ||||||
| NU Holdings Ltd/Cayman Islands / DE (N/A) | -0,13 | -0,3732 | -0,3732 | ||||||
| Cleanspark Inc / DE (N/A) | -0,15 | -0,4493 | -0,4493 | ||||||
| MARA Holdings Inc / DE (N/A) | -0,15 | -0,4512 | -0,4512 | ||||||
| Robinhood Markets Inc / DE (N/A) | -0,15 | -0,4559 | -0,4559 |