Statistiques de base
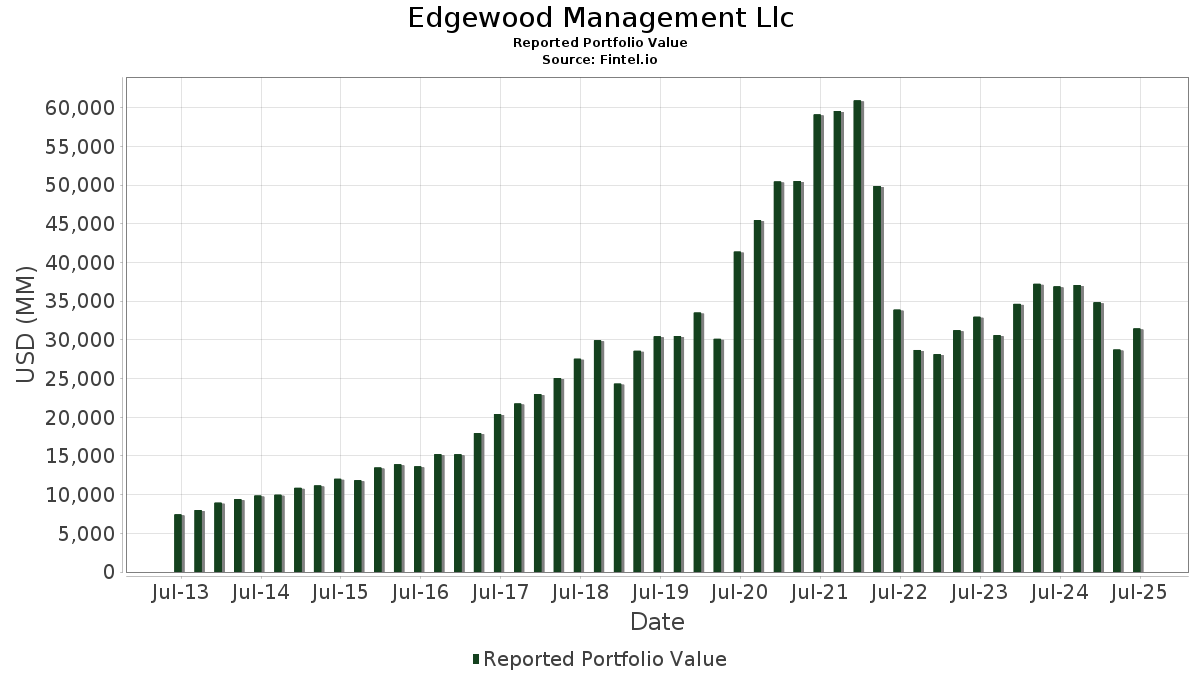
| Valeur du portefeuille | $ 31 453 340 782 |
| Positions actuelles | 83 |
Dernières positions, performances, ASG (à partir des dépôts 13F, 13D)
Edgewood Management Llc a déclaré un total de 83 positions dans ses derniers dépôts auprès de la SEC. La valeur la plus récente du portefeuille est calculée à 31 453 340 782 USD. Les actifs sous gestion réels (ASG) sont cette valeur plus les liquidités (qui ne sont pas divulguées). Les principales positions de Edgewood Management Llc sont NVIDIA Corporation (US:NVDA) , Netflix, Inc. (US:NFLX) , ASML Holding N.V. - Depositary Receipt (Common Stock) (US:ASML) , Visa Inc. (US:V) , and Intuit Inc. (US:INTU) . Les nouvelles positions de Edgewood Management Llc incluent Broadcom Inc. (US:AVGO) , Boston Scientific Corporation (US:BSX) , Fair Isaac Corporation (US:FICO) , .
Meilleures augmentations ce trimestre
Nous utilisons la variation de l'allocation du portefeuille car il s'agit de l'indicateur le plus significatif. Les changements peuvent être dus à des transactions ou à des variations de prix des actions.
| Titre | Actions (en millions) |
Valeur ($ en millions) |
% du portefeuille | ΔPortefeuille % |
|---|---|---|---|---|
| 5,70 | 1 571,44 | 4,9961 | 4,9961 | |
| 6,95 | 746,66 | 2,3739 | 2,3739 | |
| 0,34 | 612,79 | 1,9482 | 1,9482 | |
| 1,25 | 959,01 | 3,0490 | 0,9577 | |
| 16,39 | 2 588,79 | 8,2306 | 0,8688 | |
| 9,56 | 1 102,52 | 3,5053 | 0,6314 | |
| 1,82 | 2 436,19 | 7,7454 | 0,4630 | |
| 2,24 | 1 763,46 | 5,6066 | 0,4309 | |
| 1,50 | 1 540,85 | 4,8988 | 0,4095 | |
| 13,66 | 983,20 | 3,1259 | 0,3167 |
Principales baisses ce trimestre
Nous utilisons la variation de l'allocation du portefeuille car il s'agit de l'indicateur le plus significatif. Les changements peuvent être dus à des transactions ou à des variations de prix des actions.
| Titre | Actions (en millions) |
Valeur ($ en millions) |
% du portefeuille | ΔPortefeuille % |
|---|---|---|---|---|
| 0,00 | 0,89 | 0,0028 | -3,9102 | |
| 0,04 | 2,52 | 0,0080 | -2,3990 | |
| 19,92 | 977,28 | 3,1071 | -1,1274 | |
| 1,98 | 1 545,67 | 4,9142 | -1,0806 | |
| 5,62 | 1 996,49 | 6,3475 | -1,0281 | |
| 2,45 | 1 092,94 | 3,4748 | -0,9876 | |
| 2,09 | 1 207,32 | 3,8384 | -0,6030 | |
| 2,50 | 1 316,88 | 4,1868 | -0,5699 | |
| 8,63 | 1 291,60 | 4,1064 | -0,4123 | |
| 10,62 | 1 404,99 | 4,4669 | -0,3098 |
Déclarations 13F et dépôts de fonds
Ce formulaire a été déposé le 2025-08-13 pour la période de déclaration 2025-06-30. Cliquez sur l'icône du lien pour voir l'historique complet des transactions.
Mettre à niveau pour débloquer les données premium et exporter vers Excel ![]() .
.
| Titre | Type | Prix moyen de l'action | Actions (en millions) |
ΔActions (%) |
ΔActions (%) |
Valeur ($ en millions) |
Portefeuille (%) |
ΔPortefeuille (%) |
|
|---|---|---|---|---|---|---|---|---|---|
| NVDA / NVIDIA Corporation | 16,39 | -16,02 | 2 588,79 | 22,42 | 8,2306 | 0,8688 | |||
| NFLX / Netflix, Inc. | 1,82 | -18,90 | 2 436,19 | 16,46 | 7,7454 | 0,4630 | |||
| ASML / ASML Holding N.V. - Depositary Receipt (Common Stock) | 2,72 | -7,08 | 2 175,96 | 12,38 | 6,9181 | 0,1778 | |||
| V / Visa Inc. | 5,62 | -6,99 | 1 996,49 | -5,77 | 6,3475 | -1,0281 | |||
| INTU / Intuit Inc. | 2,24 | -7,54 | 1 763,46 | 18,61 | 5,6066 | 0,4309 | |||
| AVGO / Broadcom Inc. | 5,70 | 1 571,44 | 4,9961 | 4,9961 | |||||
| LLY / Eli Lilly and Company | 1,98 | -4,90 | 1 545,67 | -10,24 | 4,9142 | -1,0806 | |||
| NOW / ServiceNow, Inc. | 1,50 | -7,47 | 1 540,85 | 19,48 | 4,8988 | 0,4095 | |||
| SNPS / Synopsys, Inc. | 2,92 | -7,64 | 1 494,94 | 10,41 | 4,7529 | 0,0395 | |||
| ABNB / Airbnb, Inc. | 10,62 | -7,57 | 1 404,99 | 2,39 | 4,4669 | -0,3098 | |||
| SPGI / S&P Global Inc. | 2,50 | -7,13 | 1 316,88 | -3,62 | 4,1868 | -0,5699 | |||
| ISRG / Intuitive Surgical, Inc. | 2,39 | -7,04 | 1 297,57 | 1,99 | 4,1254 | -0,3034 | |||
| BX / Blackstone Inc. | 8,63 | -7,01 | 1 291,60 | -0,50 | 4,1064 | -0,4123 | |||
| MSCI / MSCI Inc. | 2,09 | -7,22 | 1 207,32 | -5,37 | 3,8384 | -0,6030 | |||
| SHOP / Shopify Inc. | 9,56 | 10,55 | 1 102,52 | 33,55 | 3,5053 | 0,6314 | |||
| VRTX / Vertex Pharmaceuticals Incorporated | 2,45 | -7,15 | 1 092,94 | -14,74 | 3,4748 | -0,9876 | |||
| TDG / TransDigm Group Incorporated | 0,70 | 6,23 | 1 058,69 | 16,78 | 3,3659 | 0,2100 | |||
| TTD / The Trade Desk, Inc. | 13,66 | -7,39 | 983,20 | 21,84 | 3,1259 | 0,3167 | |||
| CPRT / Copart, Inc. | 19,92 | -7,35 | 977,28 | -19,66 | 3,1071 | -1,1274 | |||
| SPOT / Spotify Technology S.A. | 1,25 | 14,43 | 959,01 | 59,63 | 3,0490 | 0,9577 | |||
| BSX / Boston Scientific Corporation | 6,95 | 746,66 | 2,3739 | 2,3739 | |||||
| FICO / Fair Isaac Corporation | 0,34 | 612,79 | 1,9482 | 1,9482 | |||||
| CL / Colgate-Palmolive Company | 0,64 | -4,35 | 58,08 | -7,21 | 0,1847 | -0,0332 | |||
| AAPL / Apple Inc. | 0,20 | -2,53 | 40,96 | -9,97 | 0,1302 | -0,0282 | |||
| MMM / 3M Company | 0,13 | -41,60 | 19,33 | -39,46 | 0,0614 | -0,0497 | |||
| EQIX / Equinix, Inc. | 0,02 | -0,32 | 15,99 | -2,76 | 0,0508 | -0,0064 | |||
| ABBV / AbbVie Inc. | 0,07 | 0,00 | 13,04 | -11,41 | 0,0415 | -0,0098 | |||
| SPY / SPDR S&P 500 ETF | 0,02 | -26,83 | 10,63 | -19,19 | 0,0338 | -0,0120 | |||
| META / Meta Platforms, Inc. | 0,01 | 0,00 | 10,52 | 28,05 | 0,0334 | 0,0048 | |||
| CME / CME Group Inc. | 0,03 | -16,17 | 9,45 | -12,91 | 0,0300 | -0,0077 | |||
| ABT / Abbott Laboratories | 0,07 | 0,00 | 9,25 | 2,53 | 0,0294 | -0,0020 | |||
| DVY / iShares Trust - iShares Select Dividend ETF | 0,05 | -3,99 | 7,29 | -5,05 | 0,0232 | -0,0035 | |||
| XLU / The Select Sector SPDR Trust - The Utilities Select Sector SPDR Fund | 0,09 | 0,00 | 7,21 | 3,56 | 0,0229 | -0,0013 | |||
| AMT / American Tower Corporation | 0,03 | -33,89 | 6,49 | -32,86 | 0,0206 | -0,0130 | |||
| JPM / JPMorgan Chase & Co. | 0,02 | -0,70 | 5,73 | 17,36 | 0,0182 | 0,0012 | |||
| SOLV / Solventum Corporation | 0,07 | 0,00 | 5,25 | -0,27 | 0,0167 | -0,0016 | |||
| DLR / Digital Realty Trust, Inc. | 0,03 | 0,00 | 4,85 | 21,65 | 0,0154 | 0,0015 | |||
| PLD / Prologis, Inc. | 0,04 | 0,00 | 4,71 | -5,97 | 0,0150 | -0,0025 | |||
| AVAV / AeroVironment, Inc. | 0,01 | 0,00 | 4,27 | 139,17 | 0,0136 | 0,0074 | |||
| GILD / Gilead Sciences, Inc. | 0,04 | -6,00 | 4,16 | -7,00 | 0,0132 | -0,0023 | |||
| JNJ / Johnson & Johnson | 0,02 | 0,00 | 2,85 | -7,89 | 0,0091 | -0,0017 | |||
| PEP / PepsiCo, Inc. | 0,02 | -14,33 | 2,76 | -24,56 | 0,0088 | -0,0040 | |||
| BK / The Bank of New York Mellon Corporation | 0,03 | 0,00 | 2,71 | 8,63 | 0,0086 | -0,0001 | |||
| SYY / Sysco Corporation | 0,04 | 0,00 | 2,66 | 0,95 | 0,0085 | -0,0007 | |||
| CMG / Chipotle Mexican Grill, Inc. | 0,04 | -99,67 | 2,52 | -99,64 | 0,0080 | -2,3990 | |||
| TSM / Taiwan Semiconductor Manufacturing Company Limited - Depositary Receipt (Common Stock) | 0,01 | -26,00 | 2,51 | 0,96 | 0,0080 | -0,0007 | |||
| BMY / Bristol-Myers Squibb Company | 0,05 | -17,35 | 2,34 | -37,26 | 0,0074 | -0,0055 | |||
| BRK.B / Berkshire Hathaway Inc. | 0,00 | 0,00 | 2,20 | -8,79 | 0,0070 | -0,0014 | |||
| BRK.A / Berkshire Hathaway Inc. | 0,00 | 0,00 | 2,19 | -8,73 | 0,0070 | -0,0014 | |||
| PFE / Pfizer Inc. | 0,08 | 0,00 | 2,06 | -4,32 | 0,0065 | -0,0009 | |||
| AMD / Advanced Micro Devices, Inc. | 0,01 | -3,08 | 1,92 | 33,87 | 0,0061 | 0,0011 | |||
| CSCO / Cisco Systems, Inc. | 0,03 | -5,94 | 1,86 | 5,70 | 0,0059 | -0,0002 | |||
| NEE / NextEra Energy, Inc. | 0,03 | 0,00 | 1,83 | -2,08 | 0,0058 | -0,0007 | |||
| ETG / Eaton Vance Tax-Advantaged Global Dividend Income Fund | 0,08 | 0,00 | 1,72 | 14,93 | 0,0055 | 0,0003 | |||
| MSFT / Microsoft Corporation | 0,00 | -76,90 | 1,69 | -69,39 | 0,0054 | -0,0138 | |||
| AMZN / Amazon.com, Inc. | 0,01 | -81,52 | 1,54 | -78,70 | 0,0049 | -0,0202 | |||
| VLTO / Veralto Corporation | 0,01 | 0,00 | 1,48 | 3,56 | 0,0047 | -0,0003 | |||
| KO / The Coca-Cola Company | 0,02 | 0,00 | 1,47 | -1,21 | 0,0047 | -0,0005 | |||
| DHR / Danaher Corporation | 0,01 | 0,00 | 1,34 | -3,68 | 0,0042 | -0,0006 | |||
| AGIO / Agios Pharmaceuticals, Inc. | 0,04 | 0,00 | 1,16 | 13,56 | 0,0037 | 0,0001 | |||
| XOM / Exxon Mobil Corporation | 0,01 | -1,29 | 0,98 | -10,47 | 0,0031 | -0,0007 | |||
| ADBE / Adobe Inc. | 0,00 | -99,92 | 0,89 | -99,92 | 0,0028 | -3,9102 | |||
| BMRN / BioMarin Pharmaceutical Inc. | 0,01 | 0,00 | 0,82 | -22,26 | 0,0026 | -0,0011 | |||
| DUK / Duke Energy Corporation | 0,01 | 0,00 | 0,74 | -3,26 | 0,0024 | -0,0003 | |||
| QXO / QXO, Inc. | 0,03 | 200,00 | 0,65 | 378,52 | 0,0021 | 0,0016 | |||
| GRAL / GRAIL, Inc. | 0,01 | 0,00 | 0,64 | 101,25 | 0,0020 | 0,0009 | |||
| UBER / Uber Technologies, Inc. | 0,01 | -85,74 | 0,63 | -81,77 | 0,0020 | -0,0101 | |||
| FCX / Freeport-McMoRan Inc. | 0,01 | 0,00 | 0,62 | 14,39 | 0,0020 | 0,0001 | |||
| MRK / Merck & Co., Inc. | 0,01 | 0,00 | 0,61 | -11,85 | 0,0019 | -0,0005 | |||
| ARWR / Arrowhead Pharmaceuticals, Inc. | 0,03 | 0,00 | 0,47 | 24,08 | 0,0015 | 0,0002 | |||
| EL / The Estée Lauder Companies Inc. | 0,01 | -66,67 | 0,44 | -59,16 | 0,0014 | -0,0023 | |||
| PG / The Procter & Gamble Company | 0,00 | 0,00 | 0,35 | -6,42 | 0,0011 | -0,0002 | |||
| ZTS / Zoetis Inc. | 0,00 | 0,00 | 0,32 | -5,28 | 0,0010 | -0,0002 | |||
| SCHW / The Charles Schwab Corporation | 0,00 | 0,00 | 0,32 | 16,85 | 0,0010 | 0,0001 | |||
| HD / The Home Depot, Inc. | 0,00 | 0,00 | 0,28 | 0,00 | 0,0009 | -0,0001 | |||
| NLY / Annaly Capital Management, Inc. | 0,01 | 0,00 | 0,26 | -7,39 | 0,0008 | -0,0002 | |||
| WBD / Warner Bros. Discovery, Inc. | 0,02 | 0,00 | 0,23 | 7,01 | 0,0007 | -0,0000 | |||
| SEER / Seer, Inc. | 0,10 | 0,00 | 0,21 | 26,63 | 0,0007 | 0,0001 | |||
| ARMP / Armata Pharmaceuticals, Inc. | 0,10 | 0,00 | 0,19 | 30,14 | 0,0006 | 0,0001 | |||
| PRTA / Prothena Corporation plc | 0,02 | 0,00 | 0,15 | -50,84 | 0,0005 | -0,0006 | |||
| LAC / Lithium Americas Corp. | 0,05 | 0,00 | 0,13 | -0,74 | 0,0004 | -0,0000 | |||
| LAR / Lithium Argentina AG | 0,05 | 0,00 | 0,10 | -2,80 | 0,0003 | -0,0000 | |||
| HOWL / Werewolf Therapeutics, Inc. | 0,05 | 0,00 | 0,05 | 12,50 | 0,0002 | 0,0000 | |||
| AXON / Axon Enterprise, Inc. | 0,00 | -100,00 | 0,00 | 0,0000 | |||||
| LULU / lululemon athletica inc. | 0,00 | -100,00 | 0,00 | 0,0000 | |||||
| DELL / Dell Technologies Inc. | 0,00 | -100,00 | 0,00 | 0,0000 | |||||
| APO / Apollo Global Management, Inc. | 0,00 | -100,00 | 0,00 | 0,0000 |