Statistiques de base
| Valeur du portefeuille | $ 1 158 313 502 |
| Positions actuelles | 170 |
Dernières positions, performances, ASG (à partir des dépôts 13F, 13D)
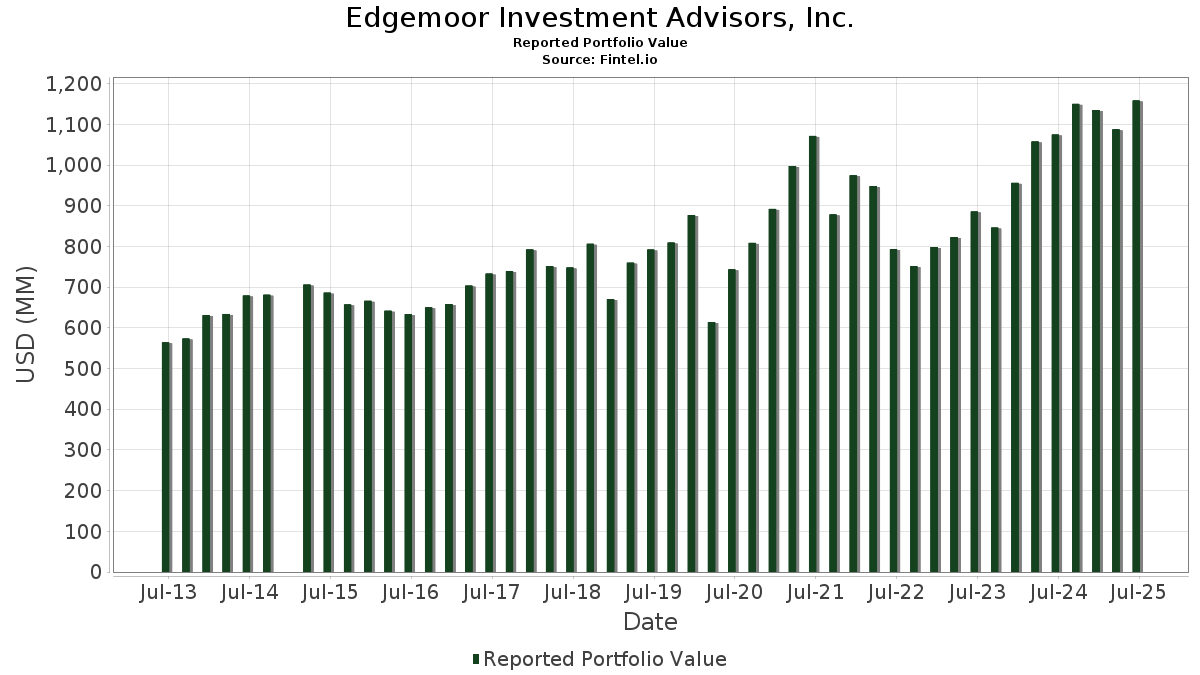
Edgemoor Investment Advisors, Inc. a déclaré un total de 170 positions dans ses derniers dépôts auprès de la SEC. La valeur la plus récente du portefeuille est calculée à 1 158 313 502 USD. Les actifs sous gestion réels (ASG) sont cette valeur plus les liquidités (qui ne sont pas divulguées). Les principales positions de Edgemoor Investment Advisors, Inc. sont Microsoft Corporation (US:MSFT) , Berkshire Hathaway Inc. (US:BRK.B) , Apple Inc. (US:AAPL) , United Rentals, Inc. (US:URI) , and Broadcom Inc. (US:AVGO) . Les nouvelles positions de Edgemoor Investment Advisors, Inc. incluent Millrose Properties, Inc. (US:MRP) , First Solar, Inc. (US:FSLR) , U.S. Bancorp (US:USB) , Invesco QQQ Trust, Series 1 (US:QQQ) , and Palo Alto Networks, Inc. (US:PANW) .
Meilleures augmentations ce trimestre
Nous utilisons la variation de l'allocation du portefeuille car il s'agit de l'indicateur le plus significatif. Les changements peuvent être dus à des transactions ou à des variations de prix des actions.
| Titre | Actions (en millions) |
Valeur ($ en millions) |
% du portefeuille | ΔPortefeuille % |
|---|---|---|---|---|
| 0,21 | 104,95 | 9,0608 | 1,6169 | |
| 0,17 | 46,89 | 4,0479 | 1,3658 | |
| 0,17 | 27,11 | 2,3403 | 0,6333 | |
| 0,07 | 53,98 | 4,6600 | 0,4142 | |
| 0,15 | 27,53 | 2,3768 | 0,3299 | |
| 0,07 | 15,34 | 1,3247 | 0,2951 | |
| 0,19 | 19,99 | 1,7257 | 0,2627 | |
| 0,18 | 39,56 | 3,4149 | 0,2306 | |
| 0,09 | 2,49 | 0,2151 | 0,2151 | |
| 0,04 | 5,05 | 0,4361 | 0,1758 |
Principales baisses ce trimestre
Nous utilisons la variation de l'allocation du portefeuille car il s'agit de l'indicateur le plus significatif. Les changements peuvent être dus à des transactions ou à des variations de prix des actions.
| Titre | Actions (en millions) |
Valeur ($ en millions) |
% du portefeuille | ΔPortefeuille % |
|---|---|---|---|---|
| 0,15 | 74,84 | 6,4613 | -1,3000 | |
| 0,35 | 71,73 | 6,1929 | -1,1741 | |
| 0,20 | 44,28 | 3,8232 | -0,5041 | |
| 0,06 | 24,94 | 2,1533 | -0,3788 | |
| 0,20 | 22,41 | 1,9347 | -0,2491 | |
| 0,04 | 7,50 | 0,6474 | -0,2013 | |
| 0,68 | 15,04 | 1,2984 | -0,1744 | |
| 0,12 | 12,76 | 1,1019 | -0,1728 | |
| 0,05 | 3,81 | 0,3286 | -0,1706 | |
| 0,18 | 29,32 | 2,5308 | -0,1640 |
Déclarations 13F et dépôts de fonds
Ce formulaire a été déposé le 2025-08-11 pour la période de déclaration 2025-06-30. Cliquez sur l'icône du lien pour voir l'historique complet des transactions.
Mettre à niveau pour débloquer les données premium et exporter vers Excel ![]() .
.
| Titre | Type | Prix moyen de l'action | Actions (en millions) |
ΔActions (%) |
ΔActions (%) |
Valeur ($ en millions) |
Portefeuille (%) |
ΔPortefeuille (%) |
|
|---|---|---|---|---|---|---|---|---|---|
| MSFT / Microsoft Corporation | 0,21 | -2,15 | 104,95 | 29,65 | 9,0608 | 1,6169 | |||
| BRK.B / Berkshire Hathaway Inc. | 0,15 | -2,78 | 74,84 | -11,33 | 6,4613 | -1,3000 | |||
| AAPL / Apple Inc. | 0,35 | -3,06 | 71,73 | -10,46 | 6,1929 | -1,1741 | |||
| URI / United Rentals, Inc. | 0,07 | -2,75 | 53,98 | 16,91 | 4,6600 | 0,4142 | |||
| AVGO / Broadcom Inc. | 0,17 | -2,36 | 46,89 | 60,75 | 4,0479 | 1,3658 | |||
| LOW / Lowe's Companies, Inc. | 0,20 | -1,07 | 44,28 | -5,89 | 3,8232 | -0,5041 | |||
| AMZN / Amazon.com, Inc. | 0,18 | -0,94 | 39,56 | 14,23 | 3,4149 | 0,2306 | |||
| GOOG / Alphabet Inc. | 0,22 | -5,70 | 38,44 | 7,07 | 3,3190 | 0,0173 | |||
| WSM / Williams-Sonoma, Inc. | 0,18 | -3,19 | 29,32 | 0,03 | 2,5308 | -0,1640 | |||
| AMAT / Applied Materials, Inc. | 0,15 | -1,96 | 27,53 | 23,68 | 2,3768 | 0,3299 | |||
| GOOGL / Alphabet Inc. | 0,16 | -0,37 | 27,36 | 13,54 | 2,3624 | 0,1461 | |||
| NVDA / NVIDIA Corporation | 0,17 | 0,18 | 27,11 | 46,03 | 2,3403 | 0,6333 | |||
| VRTX / Vertex Pharmaceuticals Incorporated | 0,06 | -1,36 | 24,94 | -9,42 | 2,1533 | -0,3788 | |||
| BX / Blackstone Inc. | 0,15 | -0,54 | 22,71 | 6,43 | 1,9609 | -0,0016 | |||
| LEN / Lennar Corporation | 0,20 | -2,07 | 22,41 | -5,63 | 1,9347 | -0,2491 | |||
| V / Visa Inc. | 0,06 | -2,49 | 21,42 | -1,21 | 1,8496 | -0,1447 | |||
| JCI / Johnson Controls International plc | 0,19 | -4,70 | 19,99 | 25,65 | 1,7257 | 0,2627 | |||
| BLK / BlackRock, Inc. | 0,02 | -5,37 | 19,23 | 4,91 | 1,6606 | -0,0254 | |||
| GD / General Dynamics Corporation | 0,06 | -2,50 | 16,52 | 4,33 | 1,4262 | -0,0299 | |||
| SCHW / The Charles Schwab Corporation | 0,18 | 0,95 | 16,41 | 17,66 | 1,4171 | 0,1342 | |||
| TSM / Taiwan Semiconductor Manufacturing Company Limited - Depositary Receipt (Common Stock) | 0,07 | 0,45 | 15,34 | 37,05 | 1,3247 | 0,2951 | |||
| ARCC / Ares Capital Corporation | 0,68 | -5,24 | 15,04 | -6,09 | 1,2984 | -0,1744 | |||
| NVS / Novartis AG - Depositary Receipt (Common Stock) | 0,11 | -1,42 | 13,40 | 7,00 | 1,1569 | 0,0053 | |||
| DE / Deere & Company | 0,03 | 0,31 | 12,84 | 8,69 | 1,1084 | 0,0221 | |||
| AEP / American Electric Power Company, Inc. | 0,12 | -3,04 | 12,76 | -7,93 | 1,1019 | -0,1728 | |||
| C / Citigroup Inc. | 0,14 | -0,23 | 12,22 | 19,62 | 1,0554 | 0,1157 | |||
| ICSH / iShares U.S. ETF Trust - iShares Ultra Short Duration Bond Active ETF | 0,23 | 1,79 | 11,89 | 1,81 | 1,0265 | -0,0474 | |||
| SPG / Simon Property Group, Inc. | 0,07 | 0,52 | 11,25 | -2,71 | 0,9711 | -0,0920 | |||
| SHEL / Shell plc - Depositary Receipt (Common Stock) | 0,16 | 1,06 | 11,24 | -2,89 | 0,9705 | -0,0940 | |||
| O / Realty Income Corporation | 0,18 | 1,97 | 10,43 | 1,26 | 0,9002 | -0,0467 | |||
| ETR / Entergy Corporation | 0,12 | -2,38 | 10,04 | -5,09 | 0,8672 | -0,1060 | |||
| VZ / Verizon Communications Inc. | 0,23 | 1,41 | 9,75 | -3,27 | 0,8415 | -0,0851 | |||
| EPD / Enterprise Products Partners L.P. - Limited Partnership | 0,31 | -1,45 | 9,49 | -10,48 | 0,8197 | -0,1557 | |||
| CCI / Crown Castle Inc. | 0,09 | 2,36 | 9,36 | 0,89 | 0,8084 | -0,0451 | |||
| TMO / Thermo Fisher Scientific Inc. | 0,02 | 25,80 | 9,29 | 2,50 | 0,8024 | -0,0314 | |||
| T / AT&T Inc. | 0,29 | -1,33 | 8,47 | 0,98 | 0,7313 | -0,0402 | |||
| PSA / Public Storage | 0,03 | 0,48 | 8,28 | -1,49 | 0,7146 | -0,0581 | |||
| JEPI / J.P. Morgan Exchange-Traded Fund Trust - JPMorgan Equity Premium Income ETF | 0,14 | 3,98 | 8,13 | 3,45 | 0,7023 | -0,0208 | |||
| FI / Fiserv, Inc. | 0,04 | 4,06 | 7,50 | -18,76 | 0,6474 | -0,2013 | |||
| NEE / NextEra Energy, Inc. | 0,11 | -1,53 | 7,32 | -3,56 | 0,6319 | -0,0661 | |||
| DLR / Digital Realty Trust, Inc. | 0,04 | -2,75 | 7,16 | 18,30 | 0,6178 | 0,0616 | |||
| SO / The Southern Company | 0,08 | -10,65 | 7,09 | -10,77 | 0,6122 | -0,1186 | |||
| CNP / CenterPoint Energy, Inc. | 0,17 | -1,02 | 6,43 | 0,37 | 0,5548 | -0,0339 | |||
| FCT / First Trust Senior Floating Rate Income Fund II | 0,63 | -1,62 | 6,39 | -1,42 | 0,5514 | -0,0444 | |||
| CWENA / Clearway Energy Inc - Class A | 0,21 | -0,20 | 6,30 | 6,11 | 0,5443 | -0,0021 | |||
| BKNG / Booking Holdings Inc. | 0,00 | 2,39 | 6,21 | 28,68 | 0,5358 | 0,0922 | |||
| EVRG / Evergy, Inc. | 0,09 | 5,30 | 5,88 | 5,26 | 0,5080 | -0,0060 | |||
| PFE / Pfizer Inc. | 0,24 | 10,77 | 5,73 | 5,97 | 0,4951 | -0,0026 | |||
| VRT / Vertiv Holdings Co | 0,04 | 0,32 | 5,05 | 78,42 | 0,4361 | 0,1758 | |||
| KMI / Kinder Morgan, Inc. | 0,17 | -2,52 | 4,88 | 0,45 | 0,4215 | -0,0254 | |||
| IVV / iShares Trust - iShares Core S&P 500 ETF | 0,01 | 0,01 | 4,53 | 10,51 | 0,3913 | 0,0142 | |||
| ATO / Atmos Energy Corporation | 0,03 | -3,80 | 4,29 | -4,09 | 0,3707 | -0,0410 | |||
| ES / Eversource Energy | 0,07 | 4,96 | 4,22 | 7,51 | 0,3646 | 0,0034 | |||
| STWD / Starwood Property Trust, Inc. | 0,19 | 0,75 | 3,88 | 2,30 | 0,3345 | -0,0139 | |||
| ARE / Alexandria Real Estate Equities, Inc. | 0,05 | -10,70 | 3,81 | -29,90 | 0,3286 | -0,1706 | |||
| OKE / ONEOK, Inc. | 0,05 | -1,35 | 3,72 | -18,84 | 0,3213 | -0,1004 | |||
| WFC.PRL / Wells Fargo & Company - Preferred Stock | 0,00 | -3,26 | 3,66 | -5,40 | 0,3163 | -0,0399 | |||
| MRK / Merck & Co., Inc. | 0,04 | -6,12 | 3,47 | -17,22 | 0,2994 | -0,0858 | |||
| KO / The Coca-Cola Company | 0,05 | 1,91 | 3,32 | 0,67 | 0,2863 | -0,0166 | |||
| PBA / Pembina Pipeline Corporation | 0,09 | -2,73 | 3,28 | -8,84 | 0,2831 | -0,0477 | |||
| BTZ / BlackRock Credit Allocation Income Trust | 0,27 | -0,75 | 2,91 | 1,08 | 0,2512 | -0,0135 | |||
| EMO / ClearBridge Energy Midstream Opportunity Fund Inc | 0,05 | 13,98 | 2,51 | 10,18 | 0,2168 | 0,0072 | |||
| MRP / Millrose Properties, Inc. | 0,09 | 2,49 | 0,2151 | 0,2151 | |||||
| WELL / Welltower Inc. | 0,02 | -1,86 | 2,47 | -1,52 | 0,2133 | -0,0174 | |||
| FRA / BlackRock Floating Rate Income Strategies Fund, Inc. | 0,19 | 9,10 | 2,47 | 10,93 | 0,2131 | 0,0085 | |||
| XEL / Xcel Energy Inc. | 0,04 | -2,19 | 2,43 | -5,92 | 0,2099 | -0,0277 | |||
| NZF / Nuveen Municipal Credit Income Fund | 0,20 | 5,03 | 2,38 | 2,36 | 0,2057 | -0,0083 | |||
| UBER / Uber Technologies, Inc. | 0,03 | 75,86 | 2,36 | 125,33 | 0,2035 | 0,1072 | |||
| KYN / Kayne Anderson Energy Infrastructure Fund, Inc. | 0,18 | 16,02 | 2,23 | 15,00 | 0,1926 | 0,0142 | |||
| AGG / iShares Trust - iShares Core U.S. Aggregate Bond ETF | 0,02 | -2,69 | 2,23 | -2,41 | 0,1922 | -0,0176 | |||
| BRK.A / Berkshire Hathaway Inc. | 0,00 | 0,00 | 2,19 | -8,73 | 0,1888 | -0,0315 | |||
| JPM / JPMorgan Chase & Co. | 0,01 | 3,26 | 2,10 | 22,05 | 0,1816 | 0,0231 | |||
| ORCL / Oracle Corporation | 0,01 | 0,84 | 1,97 | 57,77 | 0,1700 | 0,0552 | |||
| SLB / Schlumberger Limited | 0,06 | -1,33 | 1,94 | -20,21 | 0,1671 | -0,0560 | |||
| BAC.PRL / Bank of America Corporation - Preferred Stock | 0,00 | -0,50 | 1,93 | -2,28 | 0,1666 | -0,0149 | |||
| CI / The Cigna Group | 0,01 | 0,56 | 1,89 | 1,07 | 0,1631 | -0,0088 | |||
| ACN / Accenture plc | 0,01 | 1,63 | 1,88 | -2,64 | 0,1623 | -0,0153 | |||
| RLJ.PRA / RLJ Lodging Trust - Preferred Stock | 0,07 | 0,00 | 1,76 | -3,03 | 0,1518 | -0,0150 | |||
| BEPC / Brookfield Renewable Corporation | 0,05 | 18,17 | 1,75 | 38,75 | 0,1512 | 0,0351 | |||
| BK / The Bank of New York Mellon Corporation | 0,02 | 0,00 | 1,71 | 8,67 | 0,1472 | 0,0029 | |||
| JNJ / Johnson & Johnson | 0,01 | -0,98 | 1,66 | -8,79 | 0,1434 | -0,0241 | |||
| BEP / Brookfield Renewable Partners L.P. - Limited Partnership | 0,06 | -2,50 | 1,64 | 12,30 | 0,1419 | 0,0072 | |||
| IWF / iShares Trust - iShares Russell 1000 Growth ETF | 0,00 | 0,00 | 1,60 | 17,60 | 0,1379 | 0,0130 | |||
| DHR / Danaher Corporation | 0,01 | 0,99 | 1,45 | -2,69 | 0,1248 | -0,0118 | |||
| MMC / Marsh & McLennan Companies, Inc. | 0,01 | 0,36 | 1,42 | -10,04 | 0,1222 | -0,0226 | |||
| SHV / iShares Trust - iShares Short Treasury Bond ETF | 0,01 | -16,20 | 1,26 | -16,23 | 0,1087 | -0,0295 | |||
| XOM / Exxon Mobil Corporation | 0,01 | 3,39 | 1,25 | -6,32 | 0,1076 | -0,0147 | |||
| WMT / Walmart Inc. | 0,01 | 0,16 | 1,23 | 11,58 | 0,1065 | 0,0048 | |||
| VOO / Vanguard Index Funds - Vanguard S&P 500 ETF | 0,00 | 0,00 | 1,18 | 10,49 | 0,1019 | 0,0037 | |||
| IJH / iShares Trust - iShares Core S&P Mid-Cap ETF | 0,02 | 0,64 | 1,14 | 6,95 | 0,0983 | 0,0004 | |||
| ADBE / Adobe Inc. | 0,00 | 10,45 | 1,08 | 11,40 | 0,0928 | 0,0041 | |||
| NVO / Novo Nordisk A/S - Depositary Receipt (Common Stock) | 0,02 | -3,41 | 1,05 | -4,03 | 0,0905 | -0,0099 | |||
| HD / The Home Depot, Inc. | 0,00 | 10,99 | 1,02 | 11,09 | 0,0882 | 0,0036 | |||
| GBDC / Golub Capital BDC, Inc. | 0,07 | -1,42 | 1,01 | -4,61 | 0,0875 | -0,0102 | |||
| ED / Consolidated Edison, Inc. | 0,01 | 0,00 | 0,98 | -9,25 | 0,0847 | -0,0147 | |||
| WY / Weyerhaeuser Company | 0,04 | -9,33 | 0,94 | -20,49 | 0,0815 | -0,0276 | |||
| SUB / iShares Trust - iShares Short-Term National Muni Bond ETF | 0,01 | 196,58 | 0,94 | 198,73 | 0,0813 | 0,0523 | |||
| CSX / CSX Corporation | 0,03 | 0,00 | 0,91 | 10,91 | 0,0782 | 0,0031 | |||
| ADP / Automatic Data Processing, Inc. | 0,00 | -0,41 | 0,83 | 0,61 | 0,0716 | -0,0043 | |||
| CVX / Chevron Corporation | 0,01 | 0,00 | 0,82 | -14,39 | 0,0704 | -0,0172 | |||
| LLY / Eli Lilly and Company | 0,00 | -9,50 | 0,81 | -14,57 | 0,0699 | -0,0173 | |||
| COST / Costco Wholesale Corporation | 0,00 | 16,47 | 0,78 | 21,79 | 0,0671 | 0,0085 | |||
| MUB / iShares Trust - iShares National Muni Bond ETF | 0,01 | -25,35 | 0,77 | -25,99 | 0,0664 | -0,0292 | |||
| IJR / iShares Trust - iShares Core S&P Small-Cap ETF | 0,01 | -14,30 | 0,77 | -10,42 | 0,0661 | -0,0125 | |||
| PG / The Procter & Gamble Company | 0,00 | 1,28 | 0,72 | -5,41 | 0,0620 | -0,0077 | |||
| META / Meta Platforms, Inc. | 0,00 | 2,82 | 0,70 | 31,83 | 0,0605 | 0,0116 | |||
| USIG / iShares Trust - iShares Broad USD Investment Grade Corporate Bond ETF | 0,01 | 1,88 | 0,70 | 2,65 | 0,0602 | -0,0023 | |||
| CSCO / Cisco Systems, Inc. | 0,01 | -0,60 | 0,67 | 11,83 | 0,0580 | 0,0027 | |||
| IVE / iShares Trust - iShares S&P 500 Value ETF | 0,00 | 0,00 | 0,66 | 2,63 | 0,0572 | -0,0022 | |||
| RTX / RTX Corporation | 0,00 | 1,28 | 0,66 | 11,69 | 0,0569 | 0,0026 | |||
| KKR / KKR & Co. Inc. | 0,00 | 1,20 | 0,65 | 16,46 | 0,0563 | 0,0048 | |||
| UPS / United Parcel Service, Inc. | 0,01 | 0,62 | 0,0533 | 0,0533 | |||||
| FSLR / First Solar, Inc. | 0,00 | 0,61 | 0,0526 | 0,0526 | |||||
| JFR / Nuveen Floating Rate Income Fund | 0,07 | -3,95 | 0,61 | -3,96 | 0,0523 | -0,0057 | |||
| ORLY / O'Reilly Automotive, Inc. | 0,01 | 1 400,00 | 0,60 | -5,66 | 0,0518 | -0,0067 | |||
| LMT / Lockheed Martin Corporation | 0,00 | -1,16 | 0,59 | 2,43 | 0,0511 | -0,0020 | |||
| PEP / PepsiCo, Inc. | 0,00 | 1,44 | 0,59 | -10,65 | 0,0507 | -0,0098 | |||
| SYK / Stryker Corporation | 0,00 | 8,91 | 0,57 | 15,85 | 0,0493 | 0,0039 | |||
| IWR / iShares Trust - iShares Russell Mid-Cap ETF | 0,01 | 0,00 | 0,55 | 8,09 | 0,0473 | 0,0007 | |||
| AMGN / Amgen Inc. | 0,00 | -0,10 | 0,53 | -10,46 | 0,0459 | -0,0087 | |||
| IWD / iShares Trust - iShares Russell 1000 Value ETF | 0,00 | 0,00 | 0,49 | 3,18 | 0,0420 | -0,0013 | |||
| PM / Philip Morris International Inc. | 0,00 | 0,00 | 0,48 | 14,69 | 0,0419 | 0,0030 | |||
| NOW / ServiceNow, Inc. | 0,00 | 0,00 | 0,47 | 29,32 | 0,0408 | 0,0071 | |||
| EMR / Emerson Electric Co. | 0,00 | 0,00 | 0,47 | 21,65 | 0,0408 | 0,0051 | |||
| ABBV / AbbVie Inc. | 0,00 | 4,79 | 0,45 | -7,20 | 0,0389 | -0,0058 | |||
| ABT / Abbott Laboratories | 0,00 | 5,30 | 0,44 | 7,90 | 0,0378 | 0,0005 | |||
| TXN / Texas Instruments Incorporated | 0,00 | 0,00 | 0,43 | 15,73 | 0,0375 | 0,0029 | |||
| MCD / McDonald's Corporation | 0,00 | 26,54 | 0,43 | 18,38 | 0,0367 | 0,0037 | |||
| ET / Energy Transfer LP - Limited Partnership | 0,02 | 0,00 | 0,37 | -2,61 | 0,0323 | -0,0030 | |||
| SPLG / SPDR Series Trust - SPDR Portfolio S&P 500 ETF | 0,01 | 0,00 | 0,37 | 10,39 | 0,0322 | 0,0012 | |||
| USB / U.S. Bancorp | 0,01 | 0,37 | 0,0321 | 0,0321 | |||||
| GS / The Goldman Sachs Group, Inc. | 0,00 | 0,00 | 0,37 | 29,89 | 0,0315 | 0,0056 | |||
| IPAC / iShares Trust - iShares Core MSCI Pacific ETF | 0,01 | 0,00 | 0,36 | 10,30 | 0,0315 | 0,0011 | |||
| QCOM / QUALCOMM Incorporated | 0,00 | 0,00 | 0,36 | 3,43 | 0,0313 | -0,0009 | |||
| PAYX / Paychex, Inc. | 0,00 | 5,59 | 0,34 | -0,58 | 0,0297 | -0,0021 | |||
| MO / Altria Group, Inc. | 0,01 | 0,00 | 0,33 | -2,37 | 0,0285 | -0,0026 | |||
| PFF / iShares Trust - iShares Preferred and Income Securities ETF | 0,01 | 5,95 | 0,33 | 5,83 | 0,0283 | -0,0002 | |||
| VTR / Ventas, Inc. | 0,01 | 0,00 | 0,32 | -8,26 | 0,0278 | -0,0044 | |||
| SPY / SPDR S&P 500 ETF | 0,00 | 19,48 | 0,31 | 31,91 | 0,0268 | 0,0052 | |||
| VO / Vanguard Index Funds - Vanguard Mid-Cap ETF | 0,00 | 0,00 | 0,31 | 8,54 | 0,0263 | 0,0004 | |||
| ETN / Eaton Corporation plc | 0,00 | 2,04 | 0,30 | 34,51 | 0,0263 | 0,0054 | |||
| MKL / Markel Group Inc. | 0,00 | 0,00 | 0,30 | 6,79 | 0,0259 | 0,0001 | |||
| AXP / American Express Company | 0,00 | 1,85 | 0,30 | 21,05 | 0,0258 | 0,0030 | |||
| IGSB / iShares Trust - iShares 1-5 Year Investment Grade Corporate Bond ETF | 0,01 | 4,62 | 0,30 | 5,30 | 0,0258 | -0,0003 | |||
| IBM / International Business Machines Corporation | 0,00 | 0,00 | 0,29 | 18,78 | 0,0252 | 0,0026 | |||
| YUM / Yum! Brands, Inc. | 0,00 | 0,00 | 0,28 | -5,98 | 0,0245 | -0,0032 | |||
| IEFA / iShares Trust - iShares Core MSCI EAFE ETF | 0,00 | 6,04 | 0,28 | 17,37 | 0,0239 | 0,0021 | |||
| QQQ / Invesco QQQ Trust, Series 1 | 0,00 | 0,26 | 0,0226 | 0,0226 | |||||
| NTCT / NetScout Systems, Inc. | 0,01 | 0,00 | 0,25 | 18,10 | 0,0214 | 0,0021 | |||
| PANW / Palo Alto Networks, Inc. | 0,00 | 0,25 | 0,0214 | 0,0214 | |||||
| VLTO / Veralto Corporation | 0,00 | 0,00 | 0,25 | 3,38 | 0,0212 | -0,0006 | |||
| CEG / Constellation Energy Corporation | 0,00 | 0,25 | 0,0212 | 0,0212 | |||||
| NFLX / Netflix, Inc. | 0,00 | 0,24 | 0,0211 | 0,0211 | |||||
| IEMG / iShares, Inc. - iShares Core MSCI Emerging Markets ETF | 0,00 | 5,16 | 0,24 | 16,83 | 0,0210 | 0,0019 | |||
| IVW / iShares Trust - iShares S&P 500 Growth ETF | 0,00 | 0,24 | 0,0205 | 0,0205 | |||||
| CRWD / CrowdStrike Holdings, Inc. | 0,00 | 0,23 | 0,0202 | 0,0202 | |||||
| WFC / Wells Fargo & Company | 0,00 | 0,62 | 0,23 | 12,50 | 0,0202 | 0,0010 | |||
| IWS / iShares Trust - iShares Russell Mid-Cap Value ETF | 0,00 | 0,00 | 0,23 | 4,93 | 0,0202 | -0,0003 | |||
| COP / ConocoPhillips | 0,00 | 2,52 | 0,23 | -12,41 | 0,0201 | -0,0043 | |||
| CARR / Carrier Global Corporation | 0,00 | 0,00 | 0,23 | 15,50 | 0,0200 | 0,0015 | |||
| MAR / Marriott International, Inc. | 0,00 | 0,23 | 0,0199 | 0,0199 | |||||
| XLK / The Select Sector SPDR Trust - The Technology Select Sector SPDR Fund | 0,00 | 0,23 | 0,0196 | 0,0196 | |||||
| AZO / AutoZone, Inc. | 0,00 | 0,00 | 0,22 | -2,63 | 0,0192 | -0,0018 | |||
| SYY / Sysco Corporation | 0,00 | 0,63 | 0,22 | 1,40 | 0,0188 | -0,0009 | |||
| AMLP / ALPS ETF Trust - Alerian MLP ETF | 0,00 | 0,00 | 0,22 | -6,06 | 0,0188 | -0,0025 | |||
| HON / Honeywell International Inc. | 0,00 | -25,02 | 0,22 | -17,56 | 0,0187 | -0,0055 | |||
| XLV / The Select Sector SPDR Trust - The Health Care Select Sector SPDR Fund | 0,00 | 0,00 | 0,22 | -7,73 | 0,0186 | -0,0029 | |||
| IWP / iShares Trust - iShares Russell Mid-Cap Growth ETF | 0,00 | 0,21 | 0,0181 | 0,0181 | |||||
| DD / DuPont de Nemours, Inc. | 0,00 | 0,50 | 0,21 | -7,66 | 0,0178 | -0,0027 | |||
| WEC / WEC Energy Group, Inc. | 0,00 | 0,00 | 0,20 | -4,25 | 0,0176 | -0,0020 | |||
| UNH / UnitedHealth Group Incorporated | 0,00 | -100,00 | 0,00 | 0,0000 | |||||
| FTV / Fortive Corporation | 0,00 | -100,00 | 0,00 | 0,0000 | |||||
| BOTZ / Global X Funds - Global X Robotics & Artificial Intelligence ETF | 0,00 | -100,00 | 0,00 | 0,0000 | |||||
| BCE / BCE Inc. | 0,00 | -100,00 | 0,00 | 0,0000 |