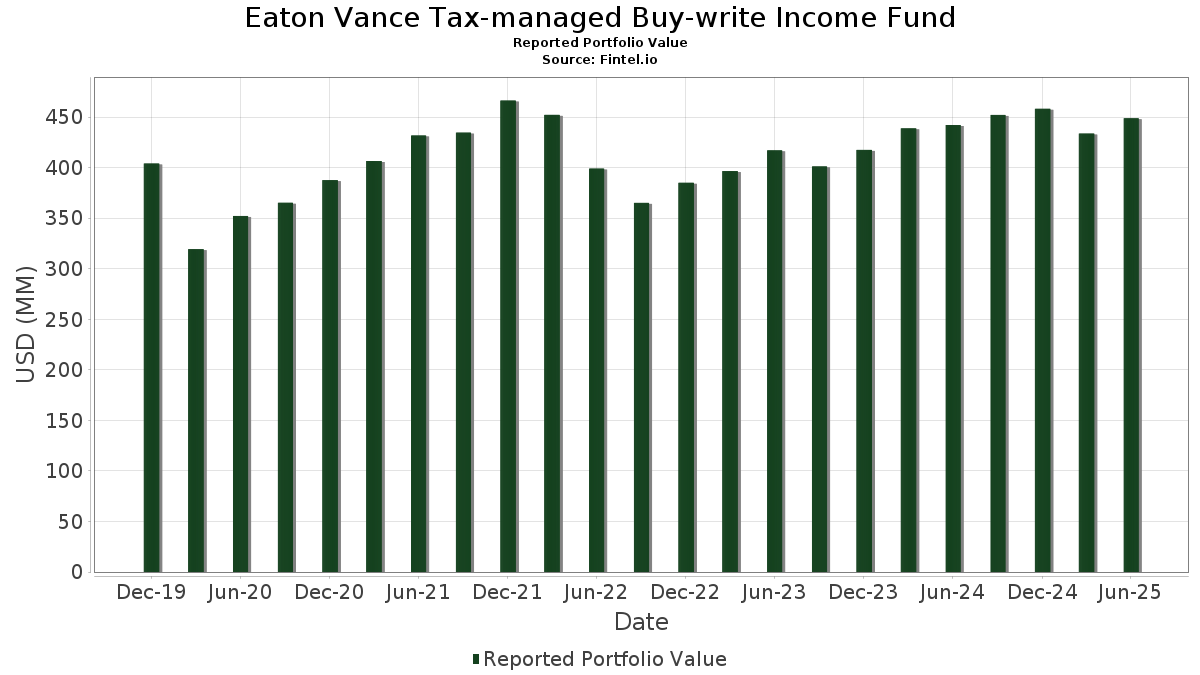
Statistiques de base
| Valeur du portefeuille | $ 448 900 041 |
| Positions actuelles | 165 |
Dernières positions, performances, ASG (à partir des dépôts 13F, 13D)
Eaton Vance Tax-managed Buy-write Income Fund a déclaré un total de 165 positions dans ses derniers dépôts auprès de la SEC. La valeur la plus récente du portefeuille est calculée à 448 900 041 USD. Les actifs sous gestion réels (ASG) sont cette valeur plus les liquidités (qui ne sont pas divulguées). Les principales positions de Eaton Vance Tax-managed Buy-write Income Fund sont NVIDIA Corporation (US:NVDA) , Microsoft Corporation (US:MSFT) , Apple Inc. (US:AAPL) , Amazon.com, Inc. (US:AMZN) , and Meta Platforms, Inc. (US:META) . Les nouvelles positions de Eaton Vance Tax-managed Buy-write Income Fund incluent Capital One Financial Corporation (US:COF) , GE HealthCare Technologies Inc. (CO:GEHC) , Williams-Sonoma, Inc. (US:WSM) , First Solar, Inc. (US:FSLR) , and Palo Alto Networks, Inc. (US:PANW) .
Meilleures augmentations ce trimestre
Nous utilisons la variation de l'allocation du portefeuille car il s'agit de l'indicateur le plus significatif. Les changements peuvent être dus à des transactions ou à des variations de prix des actions.
| Titre | Actions (en millions) |
Valeur ($ en millions) |
% du portefeuille | ΔPortefeuille % |
|---|---|---|---|---|
| 0,23 | 35,85 | 8,0125 | 1,9334 | |
| 0,07 | 34,61 | 7,7349 | 1,3399 | |
| 0,05 | 13,50 | 3,0183 | 0,9390 | |
| 0,01 | 2,87 | 0,6411 | 0,6411 | |
| 0,02 | 14,08 | 3,1463 | 0,5185 | |
| 0,01 | 7,06 | 1,5780 | 0,4272 | |
| 0,03 | 4,58 | 1,0246 | 0,3698 | |
| 0,01 | 1,46 | 0,3259 | 0,3259 | |
| 0,09 | 20,23 | 4,5205 | 0,2652 | |
| 0,01 | 3,06 | 0,6836 | 0,1980 |
Principales baisses ce trimestre
Nous utilisons la variation de l'allocation du portefeuille car il s'agit de l'indicateur le plus significatif. Les changements peuvent être dus à des transactions ou à des variations de prix des actions.
| Titre | Actions (en millions) |
Valeur ($ en millions) |
% du portefeuille | ΔPortefeuille % |
|---|---|---|---|---|
| 0,14 | 29,11 | 6,5054 | -1,0817 | |
| 0,01 | 4,00 | 0,8936 | -0,6549 | |
| 0,02 | 9,92 | 2,2165 | -0,3605 | |
| 0,00 | 1,54 | 0,3440 | -0,2477 | |
| 0,00 | 0,00 | -0,2247 | ||
| -1,00 | -0,2227 | -0,2227 | ||
| -0,85 | -0,1897 | -0,1897 | ||
| -0,82 | -0,1832 | -0,1832 | ||
| 0,02 | 2,40 | 0,5358 | -0,1804 | |
| 0,01 | 2,93 | 0,6542 | -0,1745 |
Déclarations 13F et dépôts de fonds
Ce formulaire a été déposé le 2025-08-25 pour la période de déclaration 2025-06-30. Cliquez sur l'icône du lien pour voir l'historique complet des transactions.
Mettre à niveau pour débloquer les données premium et exporter vers Excel ![]() .
.
| Titre | Type | Prix moyen de l'action | Actions (en millions) |
ΔActions (%) |
ΔActions (%) |
Valeur ($ en millions) |
Portefeuille (%) |
ΔPortefeuille (%) |
|
|---|---|---|---|---|---|---|---|---|---|
| NVDA / NVIDIA Corporation | 0,23 | -6,67 | 35,85 | 36,05 | 8,0125 | 1,9334 | |||
| MSFT / Microsoft Corporation | 0,07 | -5,78 | 34,61 | 24,85 | 7,7349 | 1,3399 | |||
| AAPL / Apple Inc. | 0,14 | -4,18 | 29,11 | -11,50 | 6,5054 | -1,0817 | |||
| AMZN / Amazon.com, Inc. | 0,09 | -4,91 | 20,23 | 9,65 | 4,5205 | 0,2652 | |||
| META / Meta Platforms, Inc. | 0,02 | -3,50 | 14,08 | 23,58 | 3,1463 | 0,5185 | |||
| AVGO / Broadcom Inc. | 0,05 | -8,99 | 13,50 | 49,84 | 3,0183 | 0,9390 | |||
| GOOGL / Alphabet Inc. | 0,06 | -4,39 | 10,19 | 8,95 | 2,2765 | 0,1198 | |||
| BRK.B / Berkshire Hathaway Inc. | 0,02 | -2,67 | 9,92 | -11,23 | 2,2165 | -0,3605 | |||
| JPM / JPMorgan Chase & Co. | 0,03 | -7,94 | 9,46 | 8,80 | 2,1136 | 0,1085 | |||
| GOOG / Alphabet Inc. | 0,05 | -7,14 | 8,22 | 5,44 | 1,8383 | 0,0386 | |||
| TSLA / Tesla, Inc. | 0,02 | -7,03 | 7,18 | 13,97 | 1,6048 | 0,1512 | |||
| NFLX / Netflix, Inc. | 0,01 | -1,44 | 7,06 | 41,52 | 1,5780 | 0,4272 | |||
| MA / Mastercard Incorporated | 0,01 | -9,88 | 6,09 | -7,60 | 1,3606 | -0,1595 | |||
| HD / The Home Depot, Inc. | 0,01 | 0,00 | 5,32 | 0,04 | 1,1895 | -0,0378 | |||
| V / Visa Inc. | 0,01 | 0,00 | 4,90 | 1,32 | 1,0954 | -0,0206 | |||
| CSCO / Cisco Systems, Inc. | 0,07 | -12,33 | 4,67 | -1,43 | 1,0441 | -0,0493 | |||
| ORCL / Oracle Corporation | 0,02 | -21,85 | 4,64 | 22,19 | 1,0363 | 0,1610 | |||
| PLTR / Palantir Technologies Inc. | 0,03 | 0,00 | 4,58 | 61,52 | 1,0246 | 0,3698 | |||
| ABT / Abbott Laboratories | 0,03 | -7,10 | 4,43 | -4,76 | 0,9892 | -0,0827 | |||
| PM / Philip Morris International Inc. | 0,02 | -9,44 | 4,41 | 3,91 | 0,9855 | 0,0066 | |||
| BAC / Bank of America Corporation | 0,09 | 0,00 | 4,09 | 13,41 | 0,9133 | 0,0820 | |||
| UNH / UnitedHealth Group Incorporated | 0,01 | 0,00 | 4,00 | -40,44 | 0,8936 | -0,6549 | |||
| BKNG / Booking Holdings Inc. | 0,00 | -8,47 | 3,94 | 15,03 | 0,8812 | 0,0904 | |||
| AXP / American Express Company | 0,01 | -7,63 | 3,90 | 9,52 | 0,8718 | 0,0501 | |||
| MCD / McDonald's Corporation | 0,01 | -5,19 | 3,87 | -11,34 | 0,8656 | -0,1419 | |||
| JNJ / Johnson & Johnson | 0,02 | 0,00 | 3,77 | -7,89 | 0,8428 | -0,1017 | |||
| SPGI / S&P Global Inc. | 0,01 | -8,96 | 3,70 | -5,51 | 0,8273 | -0,0765 | |||
| SYK / Stryker Corporation | 0,01 | 0,00 | 3,65 | 6,30 | 0,8152 | 0,0235 | |||
| KO / The Coca-Cola Company | 0,05 | 0,00 | 3,61 | -1,21 | 0,8063 | -0,0362 | |||
| HON / Honeywell International Inc. | 0,02 | -6,18 | 3,58 | 3,17 | 0,7994 | -0,0003 | |||
| LLY / Eli Lilly and Company | 0,00 | -9,62 | 3,38 | -14,68 | 0,7546 | -0,1585 | |||
| ADI / Analog Devices, Inc. | 0,01 | -0,86 | 3,30 | 17,00 | 0,7384 | 0,0870 | |||
| ABBV / AbbVie Inc. | 0,02 | -5,39 | 3,19 | -16,18 | 0,7133 | -0,1651 | |||
| MMC / Marsh & McLennan Companies, Inc. | 0,01 | 0,00 | 3,15 | -10,41 | 0,7039 | -0,1070 | |||
| EMR / Emerson Electric Co. | 0,02 | -5,73 | 3,08 | 14,62 | 0,6888 | 0,0686 | |||
| GEV / GE Vernova Inc. | 0,01 | -16,17 | 3,06 | 45,34 | 0,6836 | 0,1980 | |||
| TMO / Thermo Fisher Scientific Inc. | 0,01 | 1,60 | 3,01 | -17,19 | 0,6728 | -0,1660 | |||
| SHW / The Sherwin-Williams Company | 0,01 | 0,00 | 2,97 | -1,66 | 0,6630 | -0,0330 | |||
| NOC / Northrop Grumman Corporation | 0,01 | 0,00 | 2,95 | -2,35 | 0,6599 | -0,0376 | |||
| MDLZ / Mondelez International, Inc. | 0,04 | -2,03 | 2,93 | -2,62 | 0,6559 | -0,0393 | |||
| AMGN / Amgen Inc. | 0,01 | -9,08 | 2,93 | -18,54 | 0,6542 | -0,1745 | |||
| BA / The Boeing Company | 0,01 | 0,00 | 2,91 | 22,85 | 0,6504 | 0,1040 | |||
| CVX / Chevron Corporation | 0,02 | 0,00 | 2,87 | -14,40 | 0,6418 | -0,1321 | |||
| COF / Capital One Financial Corporation | 0,01 | 2,87 | 0,6411 | 0,6411 | |||||
| AMAT / Applied Materials, Inc. | 0,02 | 0,00 | 2,80 | 26,15 | 0,6266 | 0,1139 | |||
| COST / Costco Wholesale Corporation | 0,00 | 0,00 | 2,79 | 4,65 | 0,6233 | 0,0086 | |||
| MPC / Marathon Petroleum Corporation | 0,02 | -3,94 | 2,72 | 9,50 | 0,6079 | 0,0350 | |||
| NSC / Norfolk Southern Corporation | 0,01 | -4,51 | 2,71 | 3,20 | 0,6049 | -0,0001 | |||
| GILD / Gilead Sciences, Inc. | 0,02 | -10,13 | 2,70 | -11,07 | 0,6034 | -0,0970 | |||
| VRSN / VeriSign, Inc. | 0,01 | -19,54 | 2,67 | -8,45 | 0,5957 | -0,0761 | |||
| AMD / Advanced Micro Devices, Inc. | 0,02 | -15,64 | 2,64 | 16,49 | 0,5892 | 0,0672 | |||
| DIS / The Walt Disney Company | 0,02 | -22,13 | 2,59 | -2,19 | 0,5789 | -0,0319 | |||
| ALL / The Allstate Corporation | 0,01 | -13,51 | 2,57 | -15,92 | 0,5751 | -0,1309 | |||
| SPG / Simon Property Group, Inc. | 0,02 | 0,00 | 2,55 | -3,19 | 0,5707 | -0,0379 | |||
| CMCSA / Comcast Corporation | 0,07 | -1,50 | 2,52 | -4,73 | 0,5626 | -0,0470 | |||
| PEG / Public Service Enterprise Group Incorporated | 0,03 | -1,91 | 2,51 | 0,32 | 0,5616 | -0,0161 | |||
| STT / State Street Corporation | 0,02 | 0,00 | 2,50 | 18,79 | 0,5596 | 0,0733 | |||
| PEP / PepsiCo, Inc. | 0,02 | -12,31 | 2,40 | -22,78 | 0,5358 | -0,1804 | |||
| CINF / Cincinnati Financial Corporation | 0,02 | -1,42 | 2,37 | -0,63 | 0,5301 | -0,0205 | |||
| FITB / Fifth Third Bancorp | 0,06 | 0,00 | 2,36 | 4,93 | 0,5281 | 0,0086 | |||
| CMS / CMS Energy Corporation | 0,03 | -8,01 | 2,36 | -15,14 | 0,5273 | -0,1142 | |||
| MRK / Merck & Co., Inc. | 0,03 | 0,00 | 2,31 | -11,82 | 0,5155 | -0,0878 | |||
| PLD / Prologis, Inc. | 0,02 | 0,00 | 2,30 | -5,97 | 0,5142 | -0,0502 | |||
| PG / The Procter & Gamble Company | 0,01 | 0,00 | 2,21 | -6,53 | 0,4933 | -0,0513 | |||
| FIS / Fidelity National Information Services, Inc. | 0,03 | 0,00 | 2,05 | 9,00 | 0,4574 | 0,0243 | |||
| NI / NiSource Inc. | 0,05 | 0,00 | 2,02 | 0,60 | 0,4508 | -0,0116 | |||
| CTVA / Corteva, Inc. | 0,03 | 0,00 | 2,00 | 18,47 | 0,4473 | 0,0575 | |||
| PSX / Phillips 66 | 0,02 | 0,00 | 1,99 | -3,36 | 0,4442 | -0,0304 | |||
| SNA / Snap-on Incorporated | 0,01 | 0,00 | 1,99 | -7,67 | 0,4437 | -0,0523 | |||
| FANG / Diamondback Energy, Inc. | 0,01 | 0,00 | 1,98 | -14,04 | 0,4419 | -0,0889 | |||
| NKE / NIKE, Inc. | 0,03 | 0,00 | 1,93 | 11,91 | 0,4305 | 0,0334 | |||
| XOM / Exxon Mobil Corporation | 0,02 | -11,75 | 1,92 | -20,02 | 0,4297 | -0,1248 | |||
| AVB / AvalonBay Communities, Inc. | 0,01 | 0,00 | 1,92 | -5,19 | 0,4290 | -0,0380 | |||
| AVY / Avery Dennison Corporation | 0,01 | 0,00 | 1,83 | -1,45 | 0,4094 | -0,0192 | |||
| CVS / CVS Health Corporation | 0,03 | -19,30 | 1,81 | -17,84 | 0,4047 | -0,1037 | |||
| PNC / The PNC Financial Services Group, Inc. | 0,01 | 0,00 | 1,80 | 6,06 | 0,4034 | 0,0108 | |||
| EOG / EOG Resources, Inc. | 0,01 | 0,00 | 1,69 | -6,69 | 0,3775 | -0,0403 | |||
| WMT / Walmart Inc. | 0,02 | -27,12 | 1,64 | -18,80 | 0,3668 | -0,0996 | |||
| URI / United Rentals, Inc. | 0,00 | -35,92 | 1,63 | -22,97 | 0,3644 | -0,1239 | |||
| CRM / Salesforce, Inc. | 0,01 | 0,00 | 1,63 | 1,63 | 0,3634 | -0,0057 | |||
| TSN / Tyson Foods, Inc. | 0,03 | 0,00 | 1,61 | -12,34 | 0,3588 | -0,0636 | |||
| PWR / Quanta Services, Inc. | 0,00 | 0,00 | 1,60 | 48,84 | 0,3576 | 0,1095 | |||
| LEN / Lennar Corporation | 0,01 | 0,00 | 1,60 | -3,63 | 0,3566 | -0,0254 | |||
| ADBE / Adobe Inc. | 0,00 | -40,51 | 1,54 | -39,98 | 0,3440 | -0,2477 | |||
| BMY / Bristol-Myers Squibb Company | 0,03 | 0,00 | 1,53 | -24,13 | 0,3410 | -0,1228 | |||
| TER / Teradyne, Inc. | 0,02 | 0,00 | 1,49 | 8,84 | 0,3331 | 0,0173 | |||
| CBOE / Cboe Global Markets, Inc. | 0,01 | 1,46 | 0,3259 | 0,3259 | |||||
| VMC / Vulcan Materials Company | 0,01 | 0,00 | 1,43 | 11,82 | 0,3196 | 0,0245 | |||
| QCOM / QUALCOMM Incorporated | 0,01 | 0,00 | 1,40 | 3,62 | 0,3134 | 0,0014 | |||
| MAR / Marriott International, Inc. | 0,01 | -15,49 | 1,38 | -3,08 | 0,3094 | -0,0201 | |||
| CRWD / CrowdStrike Holdings, Inc. | 0,00 | 4,25 | 1,37 | 50,71 | 0,3069 | 0,0966 | |||
| DTE / DTE Energy Company | 0,01 | 0,00 | 1,37 | -4,20 | 0,3062 | -0,0237 | |||
| KMB / Kimberly-Clark Corporation | 0,01 | -3,38 | 1,37 | -12,42 | 0,3058 | -0,0546 | |||
| CAT / Caterpillar Inc. | 0,00 | -3,06 | 1,36 | 14,14 | 0,3050 | 0,0291 | |||
| PFE / Pfizer Inc. | 0,05 | 0,00 | 1,30 | -4,36 | 0,2897 | -0,0229 | |||
| DLTR / Dollar Tree, Inc. | 0,01 | 0,00 | 1,22 | 31,92 | 0,2717 | 0,0591 | |||
| CBRE / CBRE Group, Inc. | 0,01 | 0,00 | 1,14 | 7,22 | 0,2555 | 0,0094 | |||
| RTX / RTX Corporation | 0,01 | 0,00 | 1,09 | 10,24 | 0,2431 | 0,0155 | |||
| UBER / Uber Technologies, Inc. | 0,01 | 38,93 | 1,08 | 78,00 | 0,2424 | 0,1018 | |||
| IRM / Iron Mountain Incorporated | 0,01 | -1,66 | 1,08 | 17,28 | 0,2413 | 0,0288 | |||
| WM / Waste Management, Inc. | 0,00 | 0,00 | 1,07 | -1,11 | 0,2381 | -0,0106 | |||
| CMG / Chipotle Mexican Grill, Inc. | 0,02 | 0,00 | 1,05 | 11,94 | 0,2347 | 0,0181 | |||
| TRV / The Travelers Companies, Inc. | 0,00 | 0,00 | 1,04 | 1,16 | 0,2333 | -0,0047 | |||
| WAB / Westinghouse Air Brake Technologies Corporation | 0,00 | 0,00 | 1,04 | 15,39 | 0,2331 | 0,0247 | |||
| GPC / Genuine Parts Company | 0,01 | 0,00 | 0,98 | 1,88 | 0,2182 | -0,0030 | |||
| AXON / Axon Enterprise, Inc. | 0,00 | 0,00 | 0,94 | 57,58 | 0,2093 | 0,0721 | |||
| TXT / Textron Inc. | 0,01 | 0,00 | 0,94 | 11,18 | 0,2090 | 0,0149 | |||
| LUV / Southwest Airlines Co. | 0,03 | 0,00 | 0,89 | -3,38 | 0,1982 | -0,0136 | |||
| KEY / KeyCorp | 0,05 | 0,00 | 0,88 | 8,90 | 0,1970 | 0,0104 | |||
| FAST / Fastenal Company | 0,02 | 100,00 | 0,88 | 8,40 | 0,1963 | 0,0092 | |||
| CLX / The Clorox Company | 0,01 | 0,00 | 0,82 | -18,47 | 0,1836 | -0,0488 | |||
| XEL / Xcel Energy Inc. | 0,01 | 0,00 | 0,82 | -3,88 | 0,1828 | -0,0133 | |||
| VRTX / Vertex Pharmaceuticals Incorporated | 0,00 | -2,22 | 0,81 | -10,16 | 0,1800 | -0,0269 | |||
| EIX / Edison International | 0,02 | 0,00 | 0,80 | -12,44 | 0,1778 | -0,0318 | |||
| MTB / M&T Bank Corporation | 0,00 | 0,00 | 0,78 | 8,46 | 0,1750 | 0,0086 | |||
| T / AT&T Inc. | 0,02 | -12,69 | 0,71 | -10,75 | 0,1580 | -0,0245 | |||
| BAX / Baxter International Inc. | 0,02 | -13,74 | 0,70 | -23,77 | 0,1564 | -0,0552 | |||
| SMCI / Super Micro Computer, Inc. | 0,01 | -34,86 | 0,67 | -6,78 | 0,1508 | -0,0161 | |||
| PNW / Pinnacle West Capital Corporation | 0,01 | 0,00 | 0,64 | -6,01 | 0,1433 | -0,0142 | |||
| PRU / Prudential Financial, Inc. | 0,01 | 0,00 | 0,63 | -3,80 | 0,1417 | -0,0103 | |||
| US61747C7074 / Morgan Stanley Institutional Liquidity Funds Government Portfolio, Institutional Class | 0,63 | -3,68 | 0,63 | -3,68 | 0,1408 | -0,0101 | |||
| WBA / Walgreens Boots Alliance, Inc. | 0,05 | -26,92 | 0,58 | -24,90 | 0,1302 | -0,0487 | |||
| VST / Vistra Corp. | 0,00 | 0,00 | 0,58 | 65,04 | 0,1288 | 0,0483 | |||
| DTM / DT Midstream, Inc. | 0,01 | 0,00 | 0,57 | 14,06 | 0,1270 | 0,0119 | |||
| TYIA / Johnson Controls International plc | 0,01 | -51,48 | 0,57 | -36,08 | 0,1269 | -0,0779 | |||
| CNP / CenterPoint Energy, Inc. | 0,02 | 0,00 | 0,56 | 1,45 | 0,1253 | -0,0022 | |||
| RHI / Robert Half Inc. | 0,01 | 0,00 | 0,56 | -24,76 | 0,1251 | -0,0465 | |||
| TT / Trane Technologies plc | 0,00 | 0,00 | 0,56 | 29,98 | 0,1241 | 0,0254 | |||
| SCHW / The Charles Schwab Corporation | 0,01 | 0,00 | 0,51 | 16,36 | 0,1131 | 0,0129 | |||
| MMM / 3M Company | 0,00 | 0,00 | 0,50 | 3,56 | 0,1109 | 0,0005 | |||
| TNL / Travel + Leisure Co. | 0,01 | 0,00 | 0,48 | 11,63 | 0,1073 | 0,0080 | |||
| CHRW / C.H. Robinson Worldwide, Inc. | 0,00 | 0,00 | 0,43 | -6,30 | 0,0964 | -0,0098 | |||
| DVA / DaVita Inc. | 0,00 | -13,38 | 0,41 | -19,22 | 0,0921 | -0,0258 | |||
| PODD / Insulet Corporation | 0,00 | 98,03 | 0,41 | 136,99 | 0,0916 | 0,0517 | |||
| PFG / Principal Financial Group, Inc. | 0,01 | 0,00 | 0,40 | -5,88 | 0,0895 | -0,0086 | |||
| GEHC / GE HealthCare Technologies Inc. | 0,01 | 0,39 | 0,0881 | 0,0881 | |||||
| SWK / Stanley Black & Decker, Inc. | 0,01 | -54,97 | 0,39 | -60,32 | 0,0881 | -0,1411 | |||
| JBHT / J.B. Hunt Transport Services, Inc. | 0,00 | 0,00 | 0,38 | -2,80 | 0,0855 | -0,0054 | |||
| WSM / Williams-Sonoma, Inc. | 0,00 | 0,38 | 0,0854 | 0,0854 | |||||
| DG / Dollar General Corporation | 0,00 | 0,00 | 0,36 | 30,07 | 0,0804 | 0,0166 | |||
| ZBH / Zimmer Biomet Holdings, Inc. | 0,00 | 0,00 | 0,35 | -19,54 | 0,0784 | -0,0220 | |||
| EMN / Eastman Chemical Company | 0,00 | 0,00 | 0,35 | -15,33 | 0,0780 | -0,0170 | |||
| FSLR / First Solar, Inc. | 0,00 | 0,30 | 0,0677 | 0,0677 | |||||
| EL / The Estée Lauder Companies Inc. | 0,00 | 0,00 | 0,27 | 22,37 | 0,0601 | 0,0094 | |||
| HII / Huntington Ingalls Industries, Inc. | 0,00 | 16,47 | 0,27 | 14,53 | 0,0599 | 0,0068 | |||
| PANW / Palo Alto Networks, Inc. | 0,00 | 0,24 | 0,0531 | 0,0531 | |||||
| MRP / Millrose Properties, Inc. | 0,01 | 0,00 | 0,21 | 7,33 | 0,0460 | 0,0018 | |||
| 1FCX / Freeport-McMoRan Inc. | 0,00 | 0,17 | 0,0373 | 0,0373 | |||||
| LEA / Lear Corporation | 0,00 | 0,00 | 0,16 | 7,89 | 0,0368 | 0,0015 | |||
| VAC / Marriott Vacations Worldwide Corporation | 0,00 | 0,00 | 0,15 | 12,88 | 0,0334 | 0,0028 | |||
| GDDY / GoDaddy Inc. | 0,00 | 0,00 | 0,12 | 0,00 | 0,0266 | -0,0009 | |||
| ICE / Intercontinental Exchange, Inc. | 0,00 | -92,06 | 0,12 | -84,51 | 0,0260 | -0,1625 | |||
| PARA / Paramount Global | 0,01 | 0,00 | 0,09 | 8,14 | 0,0210 | 0,0009 | |||
| ASIX / AdvanSix Inc. | 0,00 | 0,00 | 0,04 | 5,88 | 0,0081 | 0,0001 | |||
| LYB / LyondellBasell Industries N.V. | 0,00 | -100,00 | 0,00 | -100,00 | -0,2247 | ||||
| S+P 500 INDEX / DE (000000000) | -0,39 | -0,0875 | -0,0875 | ||||||
| S+P 500 INDEX / DE (000000000) | -0,51 | -0,1151 | -0,1151 | ||||||
| S+P 500 INDEX / DE (000000000) | -0,55 | -0,1229 | -0,1229 | ||||||
| S+P 500 INDEX / DE (000000000) | -0,60 | -0,1337 | -0,1337 | ||||||
| S+P 500 INDEX / DE (000000000) | -0,65 | -0,1459 | -0,1459 | ||||||
| S+P 500 INDEX / DE (000000000) | -0,68 | -0,1517 | -0,1517 | ||||||
| S+P 500 INDEX / DE (000000000) | -0,77 | -0,1719 | -0,1719 | ||||||
| S+P 500 INDEX / DE (000000000) | -0,77 | -0,1720 | -0,1720 | ||||||
| S+P 500 INDEX / DE (000000000) | -0,82 | -0,1832 | -0,1832 | ||||||
| S+P 500 INDEX / DE (000000000) | -0,85 | -0,1897 | -0,1897 | ||||||
| S+P 500 INDEX / DE (000000000) | -1,00 | -0,2227 | -0,2227 |