Statistiques de base
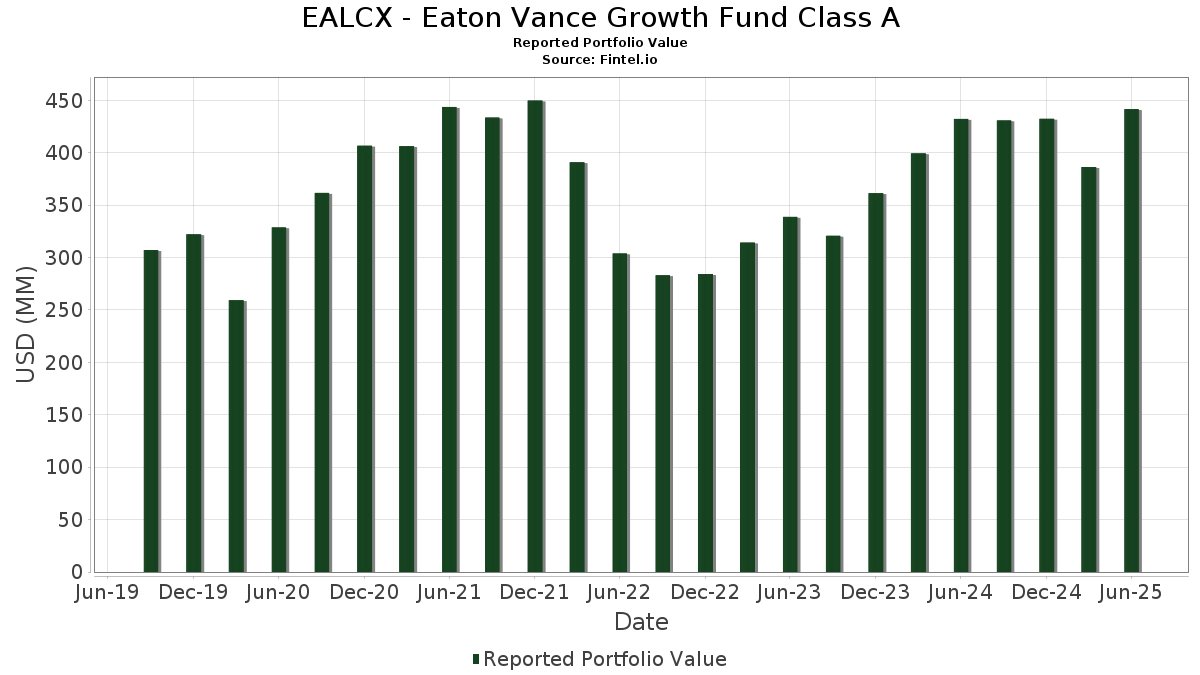
| Valeur du portefeuille | $ 441 658 321 |
| Positions actuelles | 53 |
Dernières positions, performances, ASG (à partir des dépôts 13F, 13D)
EALCX - Eaton Vance Growth Fund Class A a déclaré un total de 53 positions dans ses derniers dépôts auprès de la SEC. La valeur la plus récente du portefeuille est calculée à 441 658 321 USD. Les actifs sous gestion réels (ASG) sont cette valeur plus les liquidités (qui ne sont pas divulguées). Les principales positions de EALCX - Eaton Vance Growth Fund Class A sont NVIDIA Corporation (US:NVDA) , Microsoft Corporation (US:MSFT) , Amazon.com, Inc. (US:AMZN) , Apple Inc. (US:AAPL) , and Broadcom Inc. (US:AVGO) . Les nouvelles positions de EALCX - Eaton Vance Growth Fund Class A incluent Synopsys, Inc. (US:SNPS) , AAON, Inc. (US:AAON) , Humana Inc. (US:HUM) , Caris Life Sciences, Inc. (US:CAI) , and .
Meilleures augmentations ce trimestre
Nous utilisons la variation de l'allocation du portefeuille car il s'agit de l'indicateur le plus significatif. Les changements peuvent être dus à des transactions ou à des variations de prix des actions.
| Titre | Actions (en millions) |
Valeur ($ en millions) |
% du portefeuille | ΔPortefeuille % |
|---|---|---|---|---|
| 0,36 | 57,03 | 13,0604 | 2,8970 | |
| 8,34 | 8,34 | 1,9103 | 1,5606 | |
| 0,09 | 24,32 | 5,5686 | 1,4938 | |
| 0,01 | 5,60 | 1,2828 | 1,2828 | |
| 0,08 | 38,91 | 8,9096 | 1,1341 | |
| 0,06 | 4,42 | 1,0116 | 1,0116 | |
| 0,01 | 14,55 | 3,3315 | 0,6489 | |
| 0,03 | 11,85 | 2,7130 | 0,5458 | |
| 0,01 | 2,31 | 0,5286 | 0,5286 | |
| 0,03 | 21,46 | 4,9147 | 0,4766 |
Principales baisses ce trimestre
Nous utilisons la variation de l'allocation du portefeuille car il s'agit de l'indicateur le plus significatif. Les changements peuvent être dus à des transactions ou à des variations de prix des actions.
| Titre | Actions (en millions) |
Valeur ($ en millions) |
% du portefeuille | ΔPortefeuille % |
|---|---|---|---|---|
| 0,13 | 25,94 | 5,9391 | -1,4965 | |
| 0,01 | 9,81 | 2,2458 | -1,2920 | |
| 0,10 | 16,83 | 3,8533 | -1,1513 | |
| 0,02 | 2,99 | 0,6844 | -0,7350 | |
| 0,02 | 3,39 | 0,7753 | -0,6417 | |
| 0,01 | 2,18 | 0,5002 | -0,4566 | |
| 0,00 | 2,19 | 0,5009 | -0,4368 | |
| 0,08 | 9,96 | 2,2812 | -0,3207 | |
| 0,02 | 4,18 | 0,9565 | -0,3129 | |
| 0,02 | 4,37 | 1,0017 | -0,2971 |
Déclarations 13F et dépôts de fonds
Ce formulaire a été déposé le 2025-08-25 pour la période de déclaration 2025-06-30. Cliquez sur l'icône du lien pour voir l'historique complet des transactions.
Mettre à niveau pour débloquer les données premium et exporter vers Excel ![]() .
.
| Titre | Type | Prix moyen de l'action | Actions (en millions) |
ΔActions (%) |
ΔActions (%) |
Valeur ($ en millions) |
Portefeuille (%) |
ΔPortefeuille (%) |
|
|---|---|---|---|---|---|---|---|---|---|
| NVDA / NVIDIA Corporation | 0,36 | 0,84 | 57,03 | 46,99 | 13,0604 | 2,8970 | |||
| MSFT / Microsoft Corporation | 0,08 | -1,08 | 38,91 | 31,07 | 8,9096 | 1,1341 | |||
| AMZN / Amazon.com, Inc. | 0,16 | -1,08 | 35,01 | 14,06 | 8,0162 | -0,0228 | |||
| AAPL / Apple Inc. | 0,13 | -1,08 | 25,94 | -8,63 | 5,9391 | -1,4965 | |||
| AVGO / Broadcom Inc. | 0,09 | -5,05 | 24,32 | 56,32 | 5,5686 | 1,4938 | |||
| META / Meta Platforms, Inc. | 0,03 | -1,09 | 21,46 | 26,67 | 4,9147 | 0,4766 | |||
| GOOGL / Alphabet Inc. | 0,10 | -22,72 | 16,83 | -11,93 | 3,8533 | -1,1513 | |||
| NFLX / Netflix, Inc. | 0,01 | -1,07 | 14,55 | 42,06 | 3,3315 | 0,6489 | |||
| V / Visa Inc. | 0,03 | 41,34 | 11,85 | 43,18 | 2,7130 | 0,5458 | |||
| INTU / Intuit Inc. | 0,01 | -1,09 | 10,23 | 26,88 | 2,3416 | 0,2306 | |||
| TJX / The TJX Companies, Inc. | 0,08 | -1,08 | 9,96 | 0,29 | 2,2812 | -0,3207 | |||
| LLY / Eli Lilly and Company | 0,01 | -23,07 | 9,81 | -27,39 | 2,2458 | -1,2920 | |||
| US61747C7074 / Morgan Stanley Institutional Liquidity Funds Government Portfolio, Institutional Class | 8,34 | 524,80 | 8,34 | 524,87 | 1,9103 | 1,5606 | |||
| LRCX / Lam Research Corporation | 0,08 | -20,02 | 7,72 | 7,09 | 1,7669 | -0,1204 | |||
| COST / Costco Wholesale Corporation | 0,01 | -1,07 | 7,29 | 3,54 | 1,6698 | -0,1748 | |||
| GOOG / Alphabet Inc. | 0,04 | 0,00 | 7,08 | 13,54 | 1,6212 | -0,0120 | |||
| ISRG / Intuitive Surgical, Inc. | 0,01 | -1,09 | 6,48 | 8,52 | 1,4848 | -0,0801 | |||
| FOUR / Shift4 Payments, Inc. | 0,06 | -1,08 | 5,61 | 19,98 | 1,2846 | 0,0599 | |||
| SNPS / Synopsys, Inc. | 0,01 | 5,60 | 1,2828 | 1,2828 | |||||
| KO / The Coca-Cola Company | 0,08 | -1,08 | 5,57 | -2,28 | 1,2751 | -0,2176 | |||
| HEI / HEICO Corporation | 0,02 | -1,08 | 5,00 | 21,42 | 1,1448 | 0,0664 | |||
| FICO / Fair Isaac Corporation | 0,00 | 38,03 | 4,90 | 36,81 | 1,1227 | 0,1841 | |||
| US8575093013 / State Street Navigator Securities Lending Government Money Market Portfolio | 4,68 | 8,04 | 4,68 | 8,04 | 1,0715 | -0,0630 | |||
| FTNT / Fortinet, Inc. | 0,04 | -1,08 | 4,51 | 8,64 | 1,0338 | -0,0547 | |||
| CNSWF / Constellation Software Inc. | 0,00 | 15,96 | 4,42 | 34,28 | 1,0126 | 0,1499 | |||
| AAON / AAON, Inc. | 0,06 | 4,42 | 1,0116 | 1,0116 | |||||
| WMT / Walmart Inc. | 0,05 | -1,09 | 4,40 | 10,19 | 1,0078 | -0,0386 | |||
| TT / Trane Technologies plc | 0,01 | -16,61 | 4,40 | 8,27 | 1,0076 | -0,0570 | |||
| WCN / Waste Connections, Inc. | 0,02 | -7,77 | 4,37 | -11,78 | 1,0017 | -0,2971 | |||
| ANET / Arista Networks Inc | 0,04 | -1,09 | 4,34 | 30,64 | 0,9930 | 0,1234 | |||
| AME / AMETEK, Inc. | 0,02 | -18,01 | 4,18 | -13,83 | 0,9565 | -0,3129 | |||
| TSLA / Tesla, Inc. | 0,01 | -1,08 | 4,00 | 21,27 | 0,9167 | 0,0519 | |||
| CPRT / Copart, Inc. | 0,08 | 14,02 | 3,87 | -1,12 | 0,8862 | -0,1391 | |||
| TRU / TransUnion | 0,04 | -1,09 | 3,85 | 4,90 | 0,8816 | -0,0799 | |||
| NTNX / Nutanix, Inc. | 0,05 | -1,08 | 3,84 | 8,32 | 0,8794 | -0,0493 | |||
| IT / Gartner, Inc. | 0,01 | -1,08 | 3,82 | -4,74 | 0,8753 | -0,1757 | |||
| EW / Edwards Lifesciences Corporation | 0,05 | -1,09 | 3,57 | 6,73 | 0,8177 | -0,0586 | |||
| TW / Tradeweb Markets Inc. | 0,02 | -36,54 | 3,39 | -37,42 | 0,7753 | -0,6417 | |||
| BJ / BJ's Wholesale Club Holdings, Inc. | 0,03 | -1,08 | 3,32 | -6,51 | 0,7599 | -0,1699 | |||
| CSGP / CoStar Group, Inc. | 0,04 | 17,81 | 3,19 | 19,59 | 0,7298 | 0,0315 | |||
| ADI / Analog Devices, Inc. | 0,01 | -1,08 | 3,00 | 16,73 | 0,6871 | 0,0139 | |||
| ABBV / AbbVie Inc. | 0,02 | -47,62 | 2,99 | -50,78 | 0,6844 | -0,7350 | |||
| AJG / Arthur J. Gallagher & Co. | 0,01 | -1,08 | 2,96 | -8,27 | 0,6781 | -0,1676 | |||
| MCK / McKesson Corporation | 0,00 | -1,05 | 2,75 | 7,75 | 0,6303 | -0,0389 | |||
| HUM / Humana Inc. | 0,01 | 2,31 | 0,5286 | 0,5286 | |||||
| OWL / Blue Owl Capital Inc. | 0,12 | -23,45 | 2,27 | -26,63 | 0,5195 | -0,2903 | |||
| BURL / Burlington Stores, Inc. | 0,01 | -1,09 | 2,24 | -3,45 | 0,5136 | -0,0949 | |||
| HD / The Home Depot, Inc. | 0,01 | -1,08 | 2,23 | -1,02 | 0,5099 | -0,0795 | |||
| SPGI / S&P Global Inc. | 0,00 | -41,12 | 2,19 | -38,89 | 0,5009 | -0,4368 | |||
| FSV / FirstService Corporation | 0,01 | -43,17 | 2,18 | -40,21 | 0,5002 | -0,4566 | |||
| ICE / Intercontinental Exchange, Inc. | 0,01 | -30,32 | 2,18 | -25,89 | 0,4990 | -0,2711 | |||
| ABT / Abbott Laboratories | 0,02 | -1,08 | 2,08 | 1,42 | 0,4753 | -0,0608 | |||
| CAI / Caris Life Sciences, Inc. | 0,01 | 0,23 | 0,0538 | 0,0538 | |||||
| RDDT / Reddit, Inc. | 0,00 | -100,00 | 0,00 | -100,00 | -0,1383 |