Statistiques de base
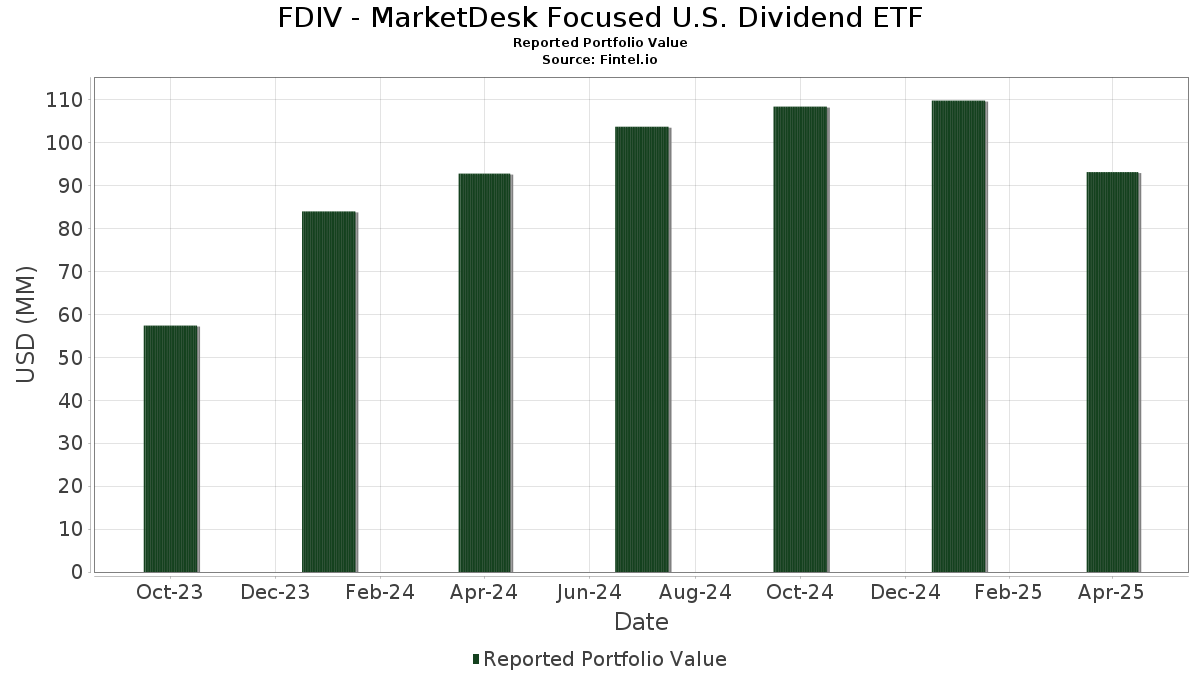
| Valeur du portefeuille | $ 93 124 580 |
| Positions actuelles | 67 |
Dernières positions, performances, ASG (à partir des dépôts 13F, 13D)
FDIV - MarketDesk Focused U.S. Dividend ETF a déclaré un total de 67 positions dans ses derniers dépôts auprès de la SEC. La valeur la plus récente du portefeuille est calculée à 93 124 580 USD. Les actifs sous gestion réels (ASG) sont cette valeur plus les liquidités (qui ne sont pas divulguées). Les principales positions de FDIV - MarketDesk Focused U.S. Dividend ETF sont Lockheed Martin Corporation (US:LMT) , PPG Industries, Inc. (US:PPG) , Brown-Forman Corp. - Class B (US:BFB) , A. O. Smith Corporation (US:AOS) , and The Home Depot, Inc. (US:HD) . Les nouvelles positions de FDIV - MarketDesk Focused U.S. Dividend ETF incluent The Home Depot, Inc. (US:HD) , The Clorox Company (US:CLX) , Accenture plc (US:ACN) , CSX Corporation (US:CSX) , and DICK'S Sporting Goods, Inc. (US:DKS) .
Meilleures augmentations ce trimestre
Nous utilisons la variation de l'allocation du portefeuille car il s'agit de l'indicateur le plus significatif. Les changements peuvent être dus à des transactions ou à des variations de prix des actions.
| Titre | Actions (en millions) |
Valeur ($ en millions) |
% du portefeuille | ΔPortefeuille % |
|---|---|---|---|---|
| 0,01 | 1,99 | 2,1400 | 2,1400 | |
| 0,01 | 1,96 | 2,1000 | 2,1000 | |
| 0,01 | 1,92 | 2,0600 | 2,0600 | |
| 0,07 | 1,89 | 2,0200 | 2,0200 | |
| 0,01 | 1,77 | 1,9000 | 1,9000 | |
| 0,01 | 1,98 | 2,1200 | 1,1200 | |
| 0,01 | 1,03 | 1,1000 | 1,1000 | |
| 0,03 | 1,95 | 2,0900 | 1,0900 | |
| 0,01 | 1,01 | 1,0800 | 1,0800 | |
| 0,03 | 1,93 | 2,0700 | 1,0700 |
Principales baisses ce trimestre
Nous utilisons la variation de l'allocation du portefeuille car il s'agit de l'indicateur le plus significatif. Les changements peuvent être dus à des transactions ou à des variations de prix des actions.
| Titre | Actions (en millions) |
Valeur ($ en millions) |
% du portefeuille | ΔPortefeuille % |
|---|---|---|---|---|
| 0,00 | 0,00 | -2,0500 | ||
| 0,00 | 0,00 | -2,0200 | ||
| 0,00 | 0,00 | -1,9900 | ||
| 0,00 | 0,00 | -1,9700 | ||
| 0,00 | 0,00 | -1,9100 | ||
| 0,01 | 0,83 | 0,8900 | -1,0800 | |
| 0,01 | 0,82 | 0,8800 | -1,0700 | |
| 0,00 | 0,00 | -1,0300 | ||
| 0,00 | 0,00 | -1,0300 | ||
| 0,00 | 0,00 | -1,0100 |
Déclarations 13F et dépôts de fonds
Ce formulaire a été déposé le 2025-06-27 pour la période de déclaration 2025-04-30. Cliquez sur l'icône du lien pour voir l'historique complet des transactions.
Mettre à niveau pour débloquer les données premium et exporter vers Excel ![]() .
.
| Titre | Type | Prix moyen de l'action | Actions (en millions) |
ΔActions (%) |
ΔActions (%) |
Valeur ($ en millions) |
Portefeuille (%) |
ΔPortefeuille (%) |
|
|---|---|---|---|---|---|---|---|---|---|
| LMT / Lockheed Martin Corporation | 0,00 | -8,60 | 2,15 | -5,67 | 2,3000 | 0,2300 | |||
| PPG / PPG Industries, Inc. | 0,02 | 3,70 | 2,04 | -2,16 | 2,1800 | 0,2900 | |||
| BFB / Brown-Forman Corp. - Class B | 0,06 | -14,68 | 2,03 | -9,92 | 2,1700 | 0,1200 | |||
| AOS / A. O. Smith Corporation | 0,03 | -7,27 | 2,02 | -6,52 | 2,1700 | 0,2000 | |||
| HD / The Home Depot, Inc. | 0,01 | 1,99 | 2,1400 | 2,1400 | |||||
| AFG / American Financial Group, Inc. | 0,02 | -2,97 | 1,98 | -10,03 | 2,1300 | 0,1200 | |||
| ADP / Automatic Data Processing, Inc. | 0,01 | 82,18 | 1,98 | 80,73 | 2,1200 | 1,1200 | |||
| LW / Lamb Weston Holdings, Inc. | 0,04 | 1,82 | 1,97 | -10,29 | 2,1100 | 0,1100 | |||
| CLX / The Clorox Company | 0,01 | 1,96 | 2,1000 | 2,1000 | |||||
| GPC / Genuine Parts Company | 0,02 | -12,24 | 1,96 | -11,28 | 2,1000 | 0,0900 | |||
| ESNT / Essent Group Ltd. | 0,03 | 80,77 | 1,95 | 76,82 | 2,0900 | 1,0900 | |||
| MRK / Merck & Co., Inc. | 0,02 | 1,13 | 1,94 | -12,80 | 2,0800 | 0,0500 | |||
| SYY / Sysco Corporation | 0,03 | -12,19 | 1,93 | -14,02 | 2,0700 | 0,0200 | |||
| SWKS / Skyworks Solutions, Inc. | 0,03 | 142,47 | 1,93 | 75,64 | 2,0700 | 1,0700 | |||
| AVY / Avery Dennison Corporation | 0,01 | -1,65 | 1,93 | -9,40 | 2,0700 | 0,1300 | |||
| ACN / Accenture plc | 0,01 | 1,92 | 2,0600 | 2,0600 | |||||
| GIS / General Mills, Inc. | 0,03 | -9,33 | 1,90 | -14,47 | 2,0400 | 0,0200 | |||
| CSX / CSX Corporation | 0,07 | 1,89 | 2,0200 | 2,0200 | |||||
| TROW / T. Rowe Price Group, Inc. | 0,02 | 9,56 | 1,88 | -17,00 | 2,0100 | -0,0500 | |||
| FLO / Flowers Foods, Inc. | 0,11 | -6,69 | 1,87 | -16,05 | 2,0100 | -0,0200 | |||
| CBT / Cabot Corporation | 0,02 | -5,98 | 1,87 | -14,59 | 2,0000 | 0,0100 | |||
| CMCSA / Comcast Corporation | 0,05 | -9,21 | 1,83 | -7,75 | 1,9700 | 0,1600 | |||
| LANC / Lancaster Colony Corporation | 0,01 | 72,27 | 1,83 | 66,18 | 1,9700 | 0,9700 | |||
| TTC / The Toro Company | 0,03 | 2,68 | 1,83 | -15,81 | 1,9600 | -0,0200 | |||
| PEP / PepsiCo, Inc. | 0,01 | -8,97 | 1,81 | -18,12 | 1,9400 | -0,0800 | |||
| TGT / Target Corporation | 0,02 | 18,77 | 1,80 | -16,70 | 1,9300 | -0,0400 | |||
| BBY / Best Buy Co., Inc. | 0,03 | 3,41 | 1,77 | -19,69 | 1,9000 | -0,1100 | |||
| DKS / DICK'S Sporting Goods, Inc. | 0,01 | 1,77 | 1,9000 | 1,9000 | |||||
| OSK / Oshkosh Corporation | 0,02 | 78,26 | 1,72 | 28,33 | 1,8400 | 0,6200 | |||
| UPS / United Parcel Service, Inc. | 0,02 | 9,53 | 1,72 | -8,62 | 1,8400 | 0,1300 | |||
| VOYA / Voya Financial, Inc. | 0,03 | -6,29 | 1,70 | -21,88 | 1,8300 | -0,1500 | |||
| NKE / NIKE, Inc. | 0,03 | 105,70 | 1,69 | 50,94 | 1,8100 | 0,7900 | |||
| RHI / Robert Half Inc. | 0,04 | 126,19 | 1,61 | 54,70 | 1,7300 | 0,7800 | |||
| NSP / Insperity, Inc. | 0,02 | 58,70 | 1,44 | 37,60 | 1,5500 | 0,6000 | |||
| FAST / Fastenal Company | 0,01 | -13,48 | 1,04 | -4,31 | 1,1200 | 0,1300 | |||
| Bunge Global SA / EC (N/A) | 0,01 | 1,03 | 1,1000 | 1,1000 | |||||
| STZ / Constellation Brands, Inc. | 0,01 | -10,12 | 1,02 | -6,74 | 1,1000 | 0,1000 | |||
| GD / General Dynamics Corporation | 0,00 | -14,57 | 1,02 | -9,50 | 1,0900 | 0,0600 | |||
| MDLZ / Mondelez International, Inc. | 0,01 | -61,51 | 1,02 | -54,78 | 1,0900 | -0,9600 | |||
| CF / CF Industries Holdings, Inc. | 0,01 | 1,01 | 1,0800 | 1,0800 | |||||
| ABT / Abbott Laboratories | 0,01 | 1,00 | 1,0700 | 1,0700 | |||||
| CL / Colgate-Palmolive Company | 0,01 | 0,99 | 1,0700 | 1,0700 | |||||
| HSY / The Hershey Company | 0,01 | -59,91 | 0,99 | -55,09 | 1,0700 | -0,9400 | |||
| HRL / Hormel Foods Corporation | 0,03 | 0,99 | 1,0600 | 1,0600 | |||||
| 1NTAP / NetApp, Inc. | 0,01 | 0,98 | 1,0500 | 1,0500 | |||||
| JNJ / Johnson & Johnson | 0,01 | -58,27 | 0,96 | -57,16 | 1,0300 | -1,0000 | |||
| ITW / Illinois Tool Works Inc. | 0,00 | -7,13 | 0,96 | -14,04 | 1,0200 | 0,0100 | |||
| NEE / NextEra Energy, Inc. | 0,01 | 0,95 | 1,0200 | 1,0200 | |||||
| SNA / Snap-on Incorporated | 0,00 | -4,05 | 0,94 | -15,26 | 1,0100 | 0,0000 | |||
| QCOM_KZ / QUALCOMM Incorporated | 0,01 | 0,94 | 1,0100 | 1,0100 | |||||
| ROK / Rockwell Automation, Inc. | 0,00 | 0,92 | 0,9900 | 0,9900 | |||||
| KFY / Korn Ferry | 0,01 | 0,91 | 0,9700 | 0,9700 | |||||
| GNTX / Gentex Corporation | 0,04 | 0,90 | 0,9600 | 0,9600 | |||||
| THO / THOR Industries, Inc. | 0,01 | 0,90 | 0,9600 | 0,9600 | |||||
| SLVM / Sylvamo Corporation | 0,01 | 7,07 | 0,89 | -20,32 | 0,9600 | -0,0600 | |||
| TXN / Texas Instruments Incorporated | 0,01 | -9,57 | 0,89 | -21,62 | 0,9600 | -0,0800 | |||
| FDX / FedEx Corporation | 0,00 | 2,32 | 0,86 | -18,76 | 0,9200 | -0,0500 | |||
| LCII / LCI Industries | 0,01 | 1,57 | 0,84 | -25,36 | 0,9000 | -0,1200 | |||
| NXST / Nexstar Media Group, Inc. | 0,01 | -60,78 | 0,83 | -61,68 | 0,8900 | -1,0800 | |||
| LYB / LyondellBasell Industries N.V. | 0,01 | -50,15 | 0,82 | -61,69 | 0,8800 | -1,0700 | |||
| CVX / Chevron Corporation | 0,01 | -16,10 | 0,81 | -23,47 | 0,8700 | -0,1000 | |||
| CHRD / Chord Energy Corporation | 0,01 | -7,38 | 0,80 | -25,63 | 0,8500 | -0,1200 | |||
| NOG / Northern Oil and Gas, Inc. | 0,03 | 8,97 | 0,78 | -26,38 | 0,8400 | -0,1300 | |||
| CRC / California Resources Corporation | 0,02 | 4,54 | 0,78 | -26,69 | 0,8400 | -0,1300 | |||
| CIVI / Civitas Resources, Inc. | 0,03 | 30,54 | 0,77 | -29,98 | 0,8200 | -0,1800 | |||
| MTDR / Matador Resources Company | 0,02 | 0,76 | 0,8100 | 0,8100 | |||||
| FGXXX / First American Funds Inc - First American Government Obligations Fund Class X | 0,19 | -17,80 | 0,2100 | -0,0100 | |||||
| MCHP / Microchip Technology Incorporated | 0,00 | -100,00 | 0,00 | -100,00 | -1,9700 | ||||
| BC / Brunswick Corporation | 0,00 | -100,00 | 0,00 | -100,00 | -1,0000 | ||||
| KMB / Kimberly-Clark Corporation | 0,00 | -100,00 | 0,00 | -100,00 | -2,0200 | ||||
| HII / Huntington Ingalls Industries, Inc. | 0,00 | -100,00 | 0,00 | -100,00 | -1,0300 | ||||
| DG / Dollar General Corporation | 0,00 | -100,00 | 0,00 | -100,00 | -1,9900 | ||||
| LKQ / LKQ Corporation | 0,00 | -100,00 | 0,00 | -100,00 | -1,0000 | ||||
| PAYX / Paychex, Inc. | 0,00 | -100,00 | 0,00 | -100,00 | -1,0100 | ||||
| THG / The Hanover Insurance Group, Inc. | 0,00 | -100,00 | 0,00 | -100,00 | -0,9900 | ||||
| ADM / Archer-Daniels-Midland Company | 0,00 | -100,00 | 0,00 | -100,00 | -1,0100 | ||||
| OVV / Ovintiv Inc. | 0,00 | -100,00 | 0,00 | -100,00 | -0,9700 | ||||
| ASH / Ashland Inc. | 0,00 | -100,00 | 0,00 | -100,00 | -1,9100 | ||||
| AMGN / Amgen Inc. | 0,00 | -100,00 | 0,00 | -100,00 | -2,0500 | ||||
| AES / The AES Corporation | 0,00 | -100,00 | 0,00 | -100,00 | -1,0000 | ||||
| KLIC / Kulicke and Soffa Industries, Inc. | 0,00 | -100,00 | 0,00 | -100,00 | -1,0300 | ||||
| HIG / The Hartford Insurance Group, Inc. | 0,00 | -100,00 | 0,00 | -100,00 | -0,9900 |