Statistiques de base
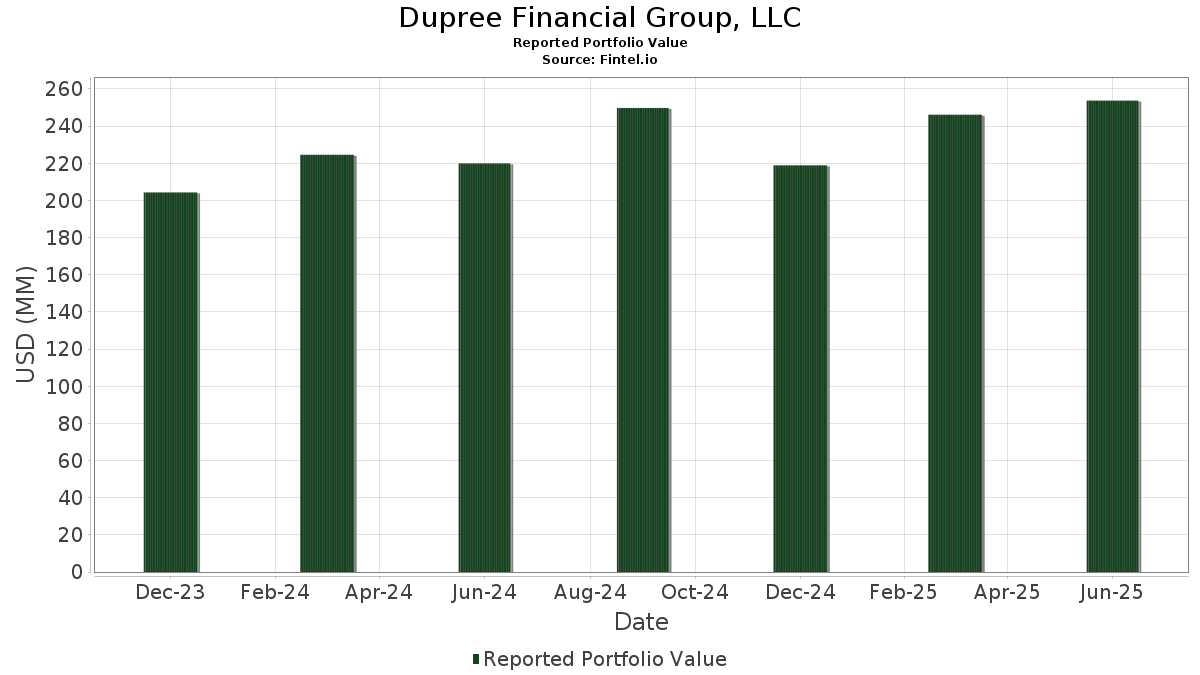
| Valeur du portefeuille | $ 253 768 923 |
| Positions actuelles | 69 |
Dernières positions, performances, ASG (à partir des dépôts 13F, 13D)
Dupree Financial Group, LLC a déclaré un total de 69 positions dans ses derniers dépôts auprès de la SEC. La valeur la plus récente du portefeuille est calculée à 253 768 923 USD. Les actifs sous gestion réels (ASG) sont cette valeur plus les liquidités (qui ne sont pas divulguées). Les principales positions de Dupree Financial Group, LLC sont AGNC Investment Corp. (US:AGNC) , Enbridge Inc. - Preferred Stock (US:EBGEF) , British American Tobacco p.l.c. - Depositary Receipt (Common Stock) (US:BTI) , Kinder Morgan, Inc. (US:KMI) , and Cincinnati Financial Corporation (US:CINF) . Les nouvelles positions de Dupree Financial Group, LLC incluent Synchrony Financial (US:SYF) , Macy's, Inc. (US:M) , Meta Platforms, Inc. (US:META) , UnitedHealth Group Incorporated (US:UNH) , and Diamondback Energy, Inc. (US:FANG) .
Meilleures augmentations ce trimestre
Nous utilisons la variation de l'allocation du portefeuille car il s'agit de l'indicateur le plus significatif. Les changements peuvent être dus à des transactions ou à des variations de prix des actions.
| Titre | Actions (en millions) |
Valeur ($ en millions) |
% du portefeuille | ΔPortefeuille % |
|---|---|---|---|---|
| 0,39 | 11,38 | 4,4828 | 4,4828 | |
| 0,11 | 7,10 | 2,7980 | 2,7980 | |
| 0,52 | 6,12 | 2,4097 | 2,4097 | |
| 0,06 | 7,03 | 2,0323 | 2,0323 | |
| 0,01 | 4,29 | 1,6919 | 1,6919 | |
| 0,01 | 3,08 | 1,2121 | 1,2121 | |
| 0,02 | 2,92 | 1,1501 | 1,1501 | |
| 0,02 | 2,71 | 1,0667 | 1,0667 | |
| 0,02 | 5,92 | 1,7120 | 0,5610 | |
| 0,02 | 7,28 | 2,1048 | 0,5465 |
Principales baisses ce trimestre
Nous utilisons la variation de l'allocation du portefeuille car il s'agit de l'indicateur le plus significatif. Les changements peuvent être dus à des transactions ou à des variations de prix des actions.
| Titre | Actions (en millions) |
Valeur ($ en millions) |
% du portefeuille | ΔPortefeuille % |
|---|---|---|---|---|
| 0,33 | 15,06 | 4,3542 | -2,9983 | |
| 0,31 | 14,91 | 4,3107 | -2,3014 | |
| 0,22 | 9,66 | 2,7941 | -2,1973 | |
| 0,13 | 4,16 | 1,2028 | -1,9990 | |
| 0,12 | 6,89 | 1,9931 | -1,4467 | |
| 0,05 | 7,28 | 2,1053 | -1,4123 | |
| 0,24 | 6,10 | 1,7634 | -1,1333 | |
| 0,08 | 5,21 | 1,5054 | -1,1050 | |
| 0,00 | 9,74 | 3,8375 | -0,9997 | |
| 0,21 | 8,14 | 2,3532 | -0,9835 |
Déclarations 13F et dépôts de fonds
Ce formulaire a été déposé le 2025-07-30 pour la période de déclaration 2025-06-30. Cliquez sur l'icône du lien pour voir l'historique complet des transactions.
Mettre à niveau pour débloquer les données premium et exporter vers Excel ![]() .
.
| Titre | Type | Prix moyen de l'action | Actions (en millions) |
ΔActions (%) |
ΔActions (%) |
Valeur ($ en millions) |
Portefeuille (%) |
ΔPortefeuille (%) |
|
|---|---|---|---|---|---|---|---|---|---|
| AGNC / AGNC Investment Corp. | 2,21 | 9,87 | 20,35 | 5,39 | 8,0179 | 0,1758 | |||
| EBGEF / Enbridge Inc. - Preferred Stock | 0,33 | -18,66 | 15,06 | -16,81 | 4,3542 | -2,9983 | |||
| BTI / British American Tobacco p.l.c. - Depositary Receipt (Common Stock) | 0,31 | -19,95 | 14,91 | -8,42 | 4,3107 | -2,3014 | |||
| KMI / Kinder Morgan, Inc. | 0,39 | 11,38 | 4,4828 | 4,4828 | |||||
| CINF / Cincinnati Financial Corporation | 0,08 | 43,31 | 11,30 | 44,48 | 3,2689 | 0,0904 | |||
| MELI / MercadoLibre, Inc. | 0,00 | -38,96 | 9,74 | -18,22 | 3,8375 | -0,9997 | |||
| VZ / Verizon Communications Inc. | 0,22 | -17,56 | 9,66 | -21,36 | 2,7941 | -2,1973 | |||
| ORI / Old Republic International Corporation | 0,21 | 1,08 | 8,14 | -0,94 | 2,3532 | -0,9835 | |||
| CVX / Chevron Corporation | 0,05 | -1,77 | 7,28 | -15,93 | 2,1053 | -1,4123 | |||
| CMI / Cummins Inc. | 0,02 | 81,60 | 7,28 | 89,75 | 2,1048 | 0,5465 | |||
| SYF / Synchrony Financial | 0,11 | 7,10 | 2,7980 | 2,7980 | |||||
| EOG / EOG Resources, Inc. | 0,06 | 7,03 | 2,0323 | 2,0323 | |||||
| O / Realty Income Corporation | 0,12 | -18,04 | 6,89 | -18,60 | 1,9931 | -1,4467 | |||
| M / Macy's, Inc. | 0,52 | 6,12 | 2,4097 | 2,4097 | |||||
| KHC / The Kraft Heinz Company | 0,24 | 0,79 | 6,10 | -14,47 | 1,7634 | -1,1333 | |||
| NLY / Annaly Capital Management, Inc. | 0,32 | -1,23 | 5,94 | -8,48 | 1,7167 | -0,9182 | |||
| ITW / Illinois Tool Works Inc. | 0,02 | 109,58 | 5,92 | 108,97 | 1,7120 | 0,5610 | |||
| BP / BP p.l.c. - Depositary Receipt (Common Stock) | 0,19 | 110,70 | 5,65 | 86,64 | 1,6328 | 0,4037 | |||
| BXMT / Blackstone Mortgage Trust, Inc. | 0,29 | 3,52 | 5,55 | -0,38 | 1,6043 | -0,6576 | |||
| ASO / Academy Sports and Outdoors, Inc. | 0,12 | 103,07 | 5,53 | 99,53 | 1,5983 | 0,4729 | |||
| DHI / D.R. Horton, Inc. | 0,04 | 0,73 | 5,35 | 2,16 | 1,5456 | -0,5801 | |||
| WPC / W. P. Carey Inc. | 0,08 | -18,04 | 5,21 | -19,00 | 1,5054 | -1,1050 | |||
| T / AT&T Inc. | 0,17 | -20,63 | 5,03 | -18,80 | 1,9821 | -0,5336 | |||
| TSM / Taiwan Semiconductor Manufacturing Company Limited - Depositary Receipt (Common Stock) | 0,02 | -1,53 | 4,44 | 34,38 | 1,7481 | 0,4069 | |||
| META / Meta Platforms, Inc. | 0,01 | 4,29 | 1,6919 | 1,6919 | |||||
| CNQ / Canadian Natural Resources Limited | 0,13 | -48,24 | 4,16 | -47,23 | 1,2028 | -1,9990 | |||
| AAPL / Apple Inc. | 0,02 | -2,94 | 3,86 | -10,36 | 1,1164 | -0,6330 | |||
| BRK.B / Berkshire Hathaway Inc. | 0,01 | -5,04 | 3,73 | -13,39 | 1,0774 | -0,6700 | |||
| VIG / Vanguard Specialized Funds - Vanguard Dividend Appreciation ETF | 0,02 | -0,56 | 3,46 | 4,95 | 1,0003 | -0,3390 | |||
| BEN / Franklin Resources, Inc. | 0,14 | -0,67 | 3,24 | 23,09 | 0,9372 | -0,1326 | |||
| UNH / UnitedHealth Group Incorporated | 0,01 | 3,08 | 1,2121 | 1,2121 | |||||
| CAVA / CAVA Group, Inc. | 0,03 | 70,45 | 2,94 | 66,14 | 0,8514 | 0,1315 | |||
| FANG / Diamondback Energy, Inc. | 0,02 | 2,92 | 1,1501 | 1,1501 | |||||
| PLTR / Palantir Technologies Inc. | 0,02 | 2,71 | 1,0667 | 1,0667 | |||||
| AMZN / Amazon.com, Inc. | 0,01 | -2,53 | 2,44 | 12,40 | 0,7052 | -0,1762 | |||
| ANF / Abercrombie & Fitch Co. | 0,02 | 1,14 | 1,68 | 9,73 | 0,6626 | 0,0401 | |||
| FNDF / Schwab Strategic Trust - Schwab Fundamental International Equity ETF | 0,04 | -7,63 | 1,59 | 2,32 | 0,4595 | -0,1716 | |||
| RSP / Invesco Exchange-Traded Fund Trust - Invesco S&P 500 Equal Weight ETF | 0,01 | -3,00 | 1,40 | 1,81 | 0,4057 | -0,1543 | |||
| XOM / Exxon Mobil Corporation | 0,01 | -7,48 | 1,12 | -16,12 | 0,3237 | -0,2185 | |||
| MSFT / Microsoft Corporation | 0,00 | 25,49 | 1,01 | 66,28 | 0,2924 | 0,0454 | |||
| VOO / Vanguard Index Funds - Vanguard S&P 500 ETF | 0,00 | -1,27 | 0,92 | 9,09 | 0,2674 | -0,0768 | |||
| DVY / iShares Trust - iShares Select Dividend ETF | 0,01 | -2,13 | 0,80 | -3,16 | 0,2309 | -0,1042 | |||
| SPHQ / Invesco Exchange-Traded Fund Trust - Invesco S&P 500 Quality ETF | 0,01 | -1,41 | 0,78 | 5,95 | 0,2268 | -0,0740 | |||
| JPM / JPMorgan Chase & Co. | 0,00 | 0,00 | 0,74 | 18,33 | 0,2128 | -0,0401 | |||
| GJR / Strats Trust For Procter & Gambel Security - Preferred Security | 0,00 | 27,80 | 0,67 | 19,57 | 0,1944 | -0,0342 | |||
| FBND / Fidelity Merrimack Street Trust - Fidelity Total Bond ETF | 0,01 | -1,55 | 0,65 | -1,36 | 0,1894 | -0,0803 | |||
| IJR / iShares Trust - iShares Core S&P Small-Cap ETF | 0,01 | -2,54 | 0,65 | 1,87 | 0,1894 | -0,0718 | |||
| CSX / CSX Corporation | 0,02 | 0,00 | 0,60 | 11,05 | 0,1744 | -0,0466 | |||
| BYON / Beyond, Inc. | 0,09 | -1,22 | 0,59 | 17,30 | 0,1708 | -0,0340 | |||
| GE / General Electric Company | 0,00 | 2,39 | 0,50 | 31,91 | 0,1435 | -0,0096 | |||
| GNR / SPDR Index Shares Funds - SPDR S&P Global Natural Resources ETF | 0,01 | -1,71 | 0,49 | 0,00 | 0,1419 | -0,0572 | |||
| LLY / Eli Lilly and Company | 0,00 | 4,99 | 0,48 | -0,84 | 0,1375 | -0,0574 | |||
| NFLX / Netflix, Inc. | 0,00 | 0,00 | 0,47 | 43,64 | 0,1868 | 0,0527 | |||
| HD / The Home Depot, Inc. | 0,00 | 0,00 | 0,44 | 0,00 | 0,1277 | -0,0516 | |||
| NVDA / NVIDIA Corporation | 0,00 | 0,40 | 0,1171 | 0,1171 | |||||
| IGV / iShares Trust - iShares Expanded Tech-Software Sector ETF | 0,00 | -1,07 | 0,39 | 22,05 | 0,1136 | -0,0175 | |||
| MMM / 3M Company | 0,00 | -8,05 | 0,39 | -4,85 | 0,1136 | -0,0538 | |||
| PEP / PepsiCo, Inc. | 0,00 | 0,00 | 0,39 | -11,99 | 0,1534 | -0,0262 | |||
| MRK / Merck & Co., Inc. | 0,00 | -0,44 | 0,38 | -12,38 | 0,1087 | -0,0652 | |||
| DFAR / Dimensional ETF Trust - Dimensional US Real Estate ETF | 0,01 | -3,18 | 0,35 | -4,41 | 0,1005 | -0,0473 | |||
| AVGO / Broadcom Inc. | 0,00 | -5,91 | 0,33 | 55,50 | 0,1281 | 0,0429 | |||
| GEV / GE Vernova Inc. | 0,00 | 0,25 | 0,0997 | 0,0997 | |||||
| SR / Spire Inc. | 0,00 | 0,00 | 0,25 | -6,79 | 0,0716 | -0,0362 | |||
| KO / The Coca-Cola Company | 0,00 | -4,06 | 0,23 | -4,98 | 0,0663 | -0,0320 | |||
| IBM / International Business Machines Corporation | 0,00 | -35,03 | 0,23 | -22,95 | 0,0651 | -0,0537 | |||
| IVV / iShares Trust - iShares Core S&P 500 ETF | 0,00 | -13,59 | 0,22 | -4,33 | 0,0640 | -0,0300 | |||
| PZZA / Papa John's International, Inc. | 0,00 | 0,21 | 0,0599 | 0,0599 | |||||
| COST / Costco Wholesale Corporation | 0,00 | -25,54 | 0,21 | -22,05 | 0,0809 | -0,0260 | |||
| WMT / Walmart Inc. | 0,00 | 0,20 | 0,0799 | 0,0799 | |||||
| UPS / United Parcel Service, Inc. | 0,00 | -100,00 | 0,00 | 0,0000 | |||||
| HUM / Humana Inc. | 0,00 | -100,00 | 0,00 | 0,0000 | |||||
| VVV / Valvoline Inc. | 0,00 | -100,00 | 0,00 | 0,0000 | |||||
| ONL / Orion Properties Inc. | 0,00 | -100,00 | 0,00 | 0,0000 | |||||
| CHCO / City Holding Company | 0,00 | -100,00 | 0,00 | 0,0000 | |||||
| EP.PRC / El Paso Energy Capital Trust I - Preferred Security | 0,00 | -100,00 | 0,00 | 0,0000 | |||||
| MPC / Marathon Petroleum Corporation | 0,00 | -100,00 | 0,00 | 0,0000 | |||||
| MBI / MBIA Inc. | 0,00 | -100,00 | 0,00 | 0,0000 | |||||
| EG / Everest Group, Ltd. | 0,00 | -100,00 | 0,00 | 0,0000 | |||||
| RDDT / Reddit, Inc. | 0,00 | -100,00 | 0,00 | -100,00 | -0,5975 | ||||
| KIRK / Kirkland's, Inc. | 0,00 | -100,00 | 0,00 | 0,0000 | |||||
| WBD / Warner Bros. Discovery, Inc. | 0,00 | -100,00 | 0,00 | 0,0000 | |||||
| TSLA / Tesla, Inc. | 0,00 | -100,00 | 0,00 | 0,0000 |