Statistiques de base
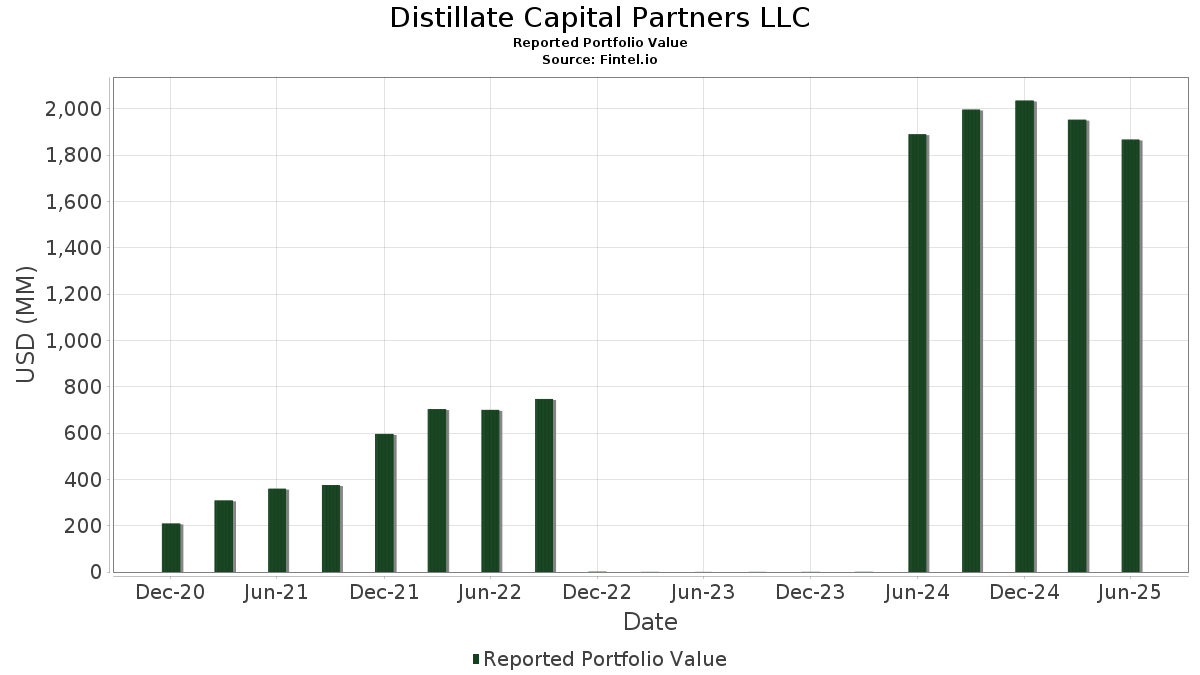
| Valeur du portefeuille | $ 1 866 794 330 |
| Positions actuelles | 117 |
Dernières positions, performances, ASG (à partir des dépôts 13F, 13D)
Distillate Capital Partners LLC a déclaré un total de 117 positions dans ses derniers dépôts auprès de la SEC. La valeur la plus récente du portefeuille est calculée à 1 866 794 330 USD. Les actifs sous gestion réels (ASG) sont cette valeur plus les liquidités (qui ne sont pas divulguées). Les principales positions de Distillate Capital Partners LLC sont UnitedHealth Group Incorporated (US:UNH) , Merck & Co., Inc. (US:MRK) , Johnson & Johnson (US:JNJ) , AbbVie Inc. (US:ABBV) , and T-Mobile US, Inc. (US:TMUS) . Les nouvelles positions de Distillate Capital Partners LLC incluent PepsiCo, Inc. (US:PEP) , Uber Technologies, Inc. (US:UBER) , EMCOR Group, Inc. (US:EME) , Crown Holdings, Inc. (US:CCK) , and Ralliant Corporation (US:RAL) .
Meilleures augmentations ce trimestre
Nous utilisons la variation de l'allocation du portefeuille car il s'agit de l'indicateur le plus significatif. Les changements peuvent être dus à des transactions ou à des variations de prix des actions.
| Titre | Actions (en millions) |
Valeur ($ en millions) |
% du portefeuille | ΔPortefeuille % |
|---|---|---|---|---|
| 0,10 | 28,29 | 1,5154 | 1,5154 | |
| 0,09 | 25,45 | 1,3635 | 1,3635 | |
| 0,19 | 24,59 | 1,3174 | 1,3174 | |
| 0,26 | 24,02 | 1,2865 | 1,2865 | |
| 0,11 | 19,24 | 1,0306 | 1,0306 | |
| 0,10 | 16,58 | 0,8879 | 0,8879 | |
| 0,05 | 15,92 | 0,8527 | 0,8527 | |
| 0,19 | 15,39 | 0,8242 | 0,8242 | |
| 0,03 | 14,11 | 0,7559 | 0,7559 | |
| 0,11 | 14,07 | 0,7537 | 0,7537 |
Principales baisses ce trimestre
Nous utilisons la variation de l'allocation du portefeuille car il s'agit de l'indicateur le plus significatif. Les changements peuvent être dus à des transactions ou à des variations de prix des actions.
| Titre | Actions (en millions) |
Valeur ($ en millions) |
% du portefeuille | ΔPortefeuille % |
|---|---|---|---|---|
| 0,14 | 44,84 | 2,4017 | -1,1304 | |
| 0,00 | 0,00 | -0,9672 | ||
| 0,57 | 44,75 | 2,3973 | -0,4686 | |
| 0,23 | 42,54 | 2,2790 | -0,4423 | |
| 0,03 | 14,69 | 0,7870 | -0,2351 | |
| 0,05 | 21,01 | 1,1253 | -0,1946 | |
| 0,06 | 22,56 | 1,2083 | -0,1872 | |
| 0,23 | 36,04 | 1,9304 | -0,1856 | |
| 0,11 | 11,44 | 0,6129 | -0,1793 | |
| 0,07 | 9,48 | 0,5080 | -0,1682 |
Déclarations 13F et dépôts de fonds
Ce formulaire a été déposé le 2025-08-13 pour la période de déclaration 2025-06-30. Cliquez sur l'icône du lien pour voir l'historique complet des transactions.
Mettre à niveau pour débloquer les données premium et exporter vers Excel ![]() .
.
| Titre | Type | Prix moyen de l'action | Actions (en millions) |
ΔActions (%) |
ΔActions (%) |
Valeur ($ en millions) |
Portefeuille (%) |
ΔPortefeuille (%) |
|
|---|---|---|---|---|---|---|---|---|---|
| UNH / UnitedHealth Group Incorporated | 0,14 | 9,14 | 44,84 | -34,99 | 2,4017 | -1,1304 | |||
| MRK / Merck & Co., Inc. | 0,57 | -9,31 | 44,75 | -20,02 | 2,3973 | -0,4686 | |||
| JNJ / Johnson & Johnson | 0,28 | 0,57 | 43,32 | -7,36 | 2,3206 | -0,0745 | |||
| ABBV / AbbVie Inc. | 0,23 | -9,62 | 42,54 | -19,93 | 2,2790 | -0,4423 | |||
| TMUS / T-Mobile US, Inc. | 0,16 | 1,35 | 37,02 | -9,46 | 1,9829 | -0,1111 | |||
| PG / The Procter & Gamble Company | 0,23 | -6,70 | 36,04 | -12,78 | 1,9304 | -0,1856 | |||
| CMCSA / Comcast Corporation | 0,93 | -5,97 | 33,13 | -9,05 | 1,7747 | -0,0910 | |||
| CSCO / Cisco Systems, Inc. | 0,47 | -20,39 | 32,43 | -10,49 | 1,7373 | -0,1185 | |||
| QCOM / QUALCOMM Incorporated | 0,19 | -6,88 | 30,37 | -3,46 | 1,6269 | 0,0157 | |||
| CI / The Cigna Group | 0,09 | -5,63 | 30,16 | -5,18 | 1,6156 | -0,0134 | |||
| BKNG / Booking Holdings Inc. | 0,01 | -6,62 | 30,07 | 17,35 | 1,6107 | 0,2984 | |||
| CRM / Salesforce, Inc. | 0,10 | 28,29 | 1,5154 | 1,5154 | |||||
| AMGN / Amgen Inc. | 0,09 | 25,45 | 1,3635 | 1,3635 | |||||
| BLK / BlackRock, Inc. | 0,02 | -6,07 | 24,74 | 4,13 | 1,3254 | 0,1085 | |||
| MO / Altria Group, Inc. | 0,42 | -6,06 | 24,61 | -8,23 | 1,3182 | -0,0552 | |||
| PEP / PepsiCo, Inc. | 0,19 | 24,59 | 1,3174 | 1,3174 | |||||
| ADBE / Adobe Inc. | 0,06 | -4,79 | 24,26 | -3,95 | 1,2997 | 0,0058 | |||
| UBER / Uber Technologies, Inc. | 0,26 | 24,02 | 1,2865 | 1,2865 | |||||
| LMT / Lockheed Martin Corporation | 0,05 | -1,70 | 23,92 | 1,91 | 1,2816 | 0,0793 | |||
| PYPL / PayPal Holdings, Inc. | 0,32 | -7,92 | 23,79 | 4,88 | 1,2742 | 0,1126 | |||
| MCK / McKesson Corporation | 0,03 | -4,40 | 23,15 | 4,09 | 1,2401 | 0,1010 | |||
| ELV / Elevance Health, Inc. | 0,06 | -7,43 | 22,56 | -17,22 | 1,2083 | -0,1872 | |||
| LOW / Lowe's Companies, Inc. | 0,10 | -6,28 | 22,54 | -10,85 | 1,2074 | -0,0874 | |||
| GD / General Dynamics Corporation | 0,07 | -3,84 | 21,86 | 2,90 | 1,1707 | 0,0829 | |||
| AMAT / Applied Materials, Inc. | 0,12 | -26,17 | 21,63 | -6,86 | 1,1587 | -0,0308 | |||
| EPD / Enterprise Products Partners L.P. - Limited Partnership | 0,69 | -7,19 | 21,43 | -15,69 | 1,1477 | -0,1539 | |||
| MPC / Marathon Petroleum Corporation | 0,13 | -23,13 | 21,27 | -12,35 | 1,1395 | -0,1036 | |||
| HCA / HCA Healthcare, Inc. | 0,05 | -26,47 | 21,01 | -18,49 | 1,1253 | -0,1946 | |||
| KR / The Kroger Co. | 0,28 | -5,79 | 20,42 | -0,17 | 1,0937 | 0,0463 | |||
| LRCX / Lam Research Corporation | 0,20 | -31,84 | 19,58 | -8,75 | 1,0489 | -0,0502 | |||
| FI / Fiserv, Inc. | 0,11 | 19,24 | 1,0306 | 1,0306 | |||||
| TEL / TE Connectivity plc | 0,11 | -9,98 | 18,68 | 7,44 | 1,0008 | 0,1102 | |||
| MPLX / MPLX LP - Limited Partnership | 0,36 | -7,88 | 18,47 | -11,34 | 0,9896 | -0,0776 | |||
| ABNB / Airbnb, Inc. | 0,14 | -5,43 | 18,33 | 4,77 | 0,9820 | 0,0858 | |||
| FANG / Diamondback Energy, Inc. | 0,13 | -3,03 | 18,07 | -16,67 | 0,9679 | -0,1426 | |||
| AJG / Arthur J. Gallagher & Co. | 0,06 | -4,81 | 17,71 | -11,74 | 0,9488 | -0,0790 | |||
| FOXA / Fox Corporation | 0,31 | -4,01 | 17,44 | -4,96 | 0,9342 | -0,0056 | |||
| PCAR / PACCAR Inc | 0,18 | -6,58 | 17,44 | -8,80 | 0,9342 | -0,0451 | |||
| CBOE / Cboe Global Markets, Inc. | 0,07 | -3,91 | 17,44 | -0,97 | 0,9341 | 0,0323 | |||
| DGX / Quest Diagnostics Incorporated | 0,09 | -4,65 | 16,84 | 1,23 | 0,9023 | 0,0500 | |||
| BDX / Becton, Dickinson and Company | 0,10 | 16,58 | 0,8879 | 0,8879 | |||||
| SSNC / SS&C Technologies Holdings, Inc. | 0,20 | -5,02 | 16,36 | -5,86 | 0,8766 | -0,0136 | |||
| RS / Reliance, Inc. | 0,05 | -4,15 | 16,31 | 4,19 | 0,8736 | 0,0720 | |||
| FTI / TechnipFMC plc | 0,47 | -9,38 | 16,27 | -1,51 | 0,8716 | 0,0255 | |||
| SYY / Sysco Corporation | 0,21 | -6,72 | 16,21 | -5,85 | 0,8685 | -0,0134 | |||
| CRH / CRH plc | 0,18 | -11,17 | 16,10 | -7,33 | 0,8627 | -0,0273 | |||
| FIX / Comfort Systems USA, Inc. | 0,03 | -6,22 | 16,07 | 56,01 | 0,8610 | 0,3333 | |||
| USFD / US Foods Holding Corp. | 0,21 | -4,79 | 16,01 | 12,01 | 0,8579 | 0,1256 | |||
| STLD / Steel Dynamics, Inc. | 0,12 | -4,92 | 15,97 | -2,71 | 0,8554 | 0,0148 | |||
| COR / Cencora, Inc. | 0,05 | 15,92 | 0,8527 | 0,8527 | |||||
| CTSH / Cognizant Technology Solutions Corporation | 0,20 | -5,38 | 15,90 | -3,48 | 0,8519 | 0,0080 | |||
| FFIV / F5, Inc. | 0,05 | -4,53 | 15,86 | 5,53 | 0,8495 | 0,0798 | |||
| TXT / Textron Inc. | 0,20 | -5,83 | 15,80 | 4,65 | 0,8465 | 0,0731 | |||
| RGLD / Royal Gold, Inc. | 0,09 | -1,57 | 15,63 | 7,05 | 0,8373 | 0,0895 | |||
| TDY / Teledyne Technologies Incorporated | 0,03 | -4,98 | 15,60 | -2,19 | 0,8355 | 0,0188 | |||
| PHM / PulteGroup, Inc. | 0,15 | -4,89 | 15,58 | -2,44 | 0,8345 | 0,0167 | |||
| GPN / Global Payments Inc. | 0,19 | 15,39 | 0,8242 | 0,8242 | |||||
| NBIX / Neurocrine Biosciences, Inc. | 0,12 | -6,30 | 15,29 | 6,49 | 0,8188 | 0,0836 | |||
| CTRA / Coterra Energy Inc. | 0,60 | -4,65 | 15,12 | -16,27 | 0,8100 | -0,1149 | |||
| PR / Permian Resources Corporation | 1,08 | -3,67 | 14,77 | -5,28 | 0,7914 | -0,0074 | |||
| LECO / Lincoln Electric Holdings, Inc. | 0,07 | -4,00 | 14,70 | 5,19 | 0,7875 | 0,0717 | |||
| REGN / Regeneron Pharmaceuticals, Inc. | 0,03 | -11,06 | 14,69 | -26,38 | 0,7870 | -0,2351 | |||
| JBL / Jabil Inc. | 0,07 | -35,96 | 14,61 | 2,65 | 0,7827 | 0,0537 | |||
| CDW / CDW Corporation | 0,08 | -7,53 | 14,31 | 3,05 | 0,7664 | 0,0553 | |||
| CPAY / Corpay, Inc. | 0,04 | -6,48 | 14,29 | -11,02 | 0,7655 | -0,0570 | |||
| HRL / Hormel Foods Corporation | 0,47 | -6,67 | 14,23 | -8,75 | 0,7621 | -0,0364 | |||
| NVR / NVR, Inc. | 0,00 | -3,07 | 14,22 | -1,18 | 0,7620 | 0,0248 | |||
| ON / ON Semiconductor Corporation | 0,27 | -29,59 | 14,22 | -9,31 | 0,7620 | -0,0413 | |||
| LKQ / LKQ Corporation | 0,38 | -5,04 | 14,15 | -17,39 | 0,7582 | -0,1193 | |||
| EME / EMCOR Group, Inc. | 0,03 | 14,11 | 0,7559 | 0,7559 | |||||
| ROST / Ross Stores, Inc. | 0,11 | 14,07 | 0,7537 | 0,7537 | |||||
| BLD / TopBuild Corp. | 0,04 | -4,88 | 14,04 | 0,99 | 0,7520 | 0,0400 | |||
| SNA / Snap-on Incorporated | 0,04 | -4,28 | 13,99 | -11,62 | 0,7494 | -0,0613 | |||
| NDSN / Nordson Corporation | 0,07 | -4,43 | 13,97 | 1,54 | 0,7484 | 0,0437 | |||
| UHS / Universal Health Services, Inc. | 0,08 | -5,50 | 13,93 | -8,90 | 0,7461 | -0,0369 | |||
| ALLE / Allegion plc | 0,10 | -10,35 | 13,88 | -0,96 | 0,7433 | 0,0257 | |||
| DOX / Amdocs Limited | 0,15 | -10,27 | 13,67 | -10,56 | 0,7321 | -0,0505 | |||
| EPAM / EPAM Systems, Inc. | 0,08 | -6,94 | 13,57 | -2,54 | 0,7268 | 0,0138 | |||
| GDDY / GoDaddy Inc. | 0,08 | 13,54 | 0,7254 | 0,7254 | |||||
| OMC / Omnicom Group Inc. | 0,18 | -5,33 | 13,19 | -17,89 | 0,7064 | -0,1161 | |||
| NTAP / NetApp, Inc. | 0,12 | -5,98 | 13,15 | 14,05 | 0,7044 | 0,1139 | |||
| AVY / Avery Dennison Corporation | 0,07 | -4,19 | 13,06 | -5,53 | 0,6997 | -0,0085 | |||
| ZM / Zoom Communications Inc. | 0,17 | 13,03 | 0,6978 | 0,6978 | |||||
| GPC / Genuine Parts Company | 0,11 | 12,95 | 0,6939 | 0,6939 | |||||
| DBX / Dropbox, Inc. | 0,45 | -4,70 | 12,80 | 2,04 | 0,6855 | 0,0432 | |||
| AOS / A. O. Smith Corporation | 0,19 | -5,50 | 12,75 | -5,19 | 0,6828 | -0,0058 | |||
| TOL / Toll Brothers, Inc. | 0,11 | -5,01 | 12,71 | 2,68 | 0,6809 | 0,0469 | |||
| IEX / IDEX Corporation | 0,07 | 12,52 | 0,6709 | 0,6709 | |||||
| CCK / Crown Holdings, Inc. | 0,12 | 12,50 | 0,6695 | 0,6695 | |||||
| WSM / Williams-Sonoma, Inc. | 0,08 | -4,29 | 12,47 | -1,10 | 0,6681 | 0,0222 | |||
| DECK / Deckers Outdoor Corporation | 0,12 | -5,92 | 12,22 | -13,27 | 0,6546 | -0,0671 | |||
| CROX / Crocs, Inc. | 0,12 | -5,96 | 12,13 | -10,31 | 0,6500 | -0,0429 | |||
| MAS / Masco Corporation | 0,19 | -5,56 | 12,08 | -12,60 | 0,6471 | -0,0607 | |||
| ALGN / Align Technology, Inc. | 0,06 | -6,26 | 12,06 | 11,72 | 0,6459 | 0,0931 | |||
| PKG / Packaging Corporation of America | 0,06 | -4,64 | 11,76 | -9,28 | 0,6298 | -0,0339 | |||
| OC / Owens Corning | 0,08 | -6,12 | 11,57 | -9,63 | 0,6196 | -0,0359 | |||
| BLDR / Builders FirstSource, Inc. | 0,10 | -4,09 | 11,54 | -10,42 | 0,6180 | -0,0416 | |||
| JAZZ / Jazz Pharmaceuticals plc | 0,11 | -13,46 | 11,44 | -26,04 | 0,6129 | -0,1793 | |||
| FTV / Fortive Corporation | 0,19 | 9,92 | 0,5311 | 0,5311 | |||||
| ICLR / ICON Public Limited Company | 0,07 | -13,58 | 9,48 | -28,17 | 0,5080 | -0,1682 | |||
| RAL / Ralliant Corporation | 0,06 | 3,08 | 0,1649 | 0,1649 | |||||
| OVV / Ovintiv Inc. | 0,00 | -14,29 | 0,00 | 0,0000 | -0,0000 | ||||
| TAP.A / Molson Coors Beverage Company | 0,00 | -93,70 | 0,00 | -100,00 | 0,0000 | -0,0004 | |||
| APA / APA Corporation | 0,00 | 0,00 | 0,00 | 0,0000 | -0,0000 | ||||
| SWKS / Skyworks Solutions, Inc. | 0,00 | -96,61 | 0,00 | -100,00 | 0,0000 | -0,0004 | |||
| MTDR / Matador Resources Company | 0,00 | 0,00 | 0,00 | 0,0000 | -0,0000 | ||||
| BBWI / Bath & Body Works, Inc. | 0,00 | 28,57 | 0,00 | 0,0000 | 0,0000 | ||||
| MOS / The Mosaic Company | 0,00 | 0,00 | 0,00 | 0,0000 | 0,0000 | ||||
| RRC / Range Resources Corporation | 0,00 | 20,00 | 0,00 | 0,0000 | 0,0000 | ||||
| BWA / BorgWarner Inc. | 0,00 | 0,00 | 0,00 | 0,0000 | 0,0000 | ||||
| CIVI / Civitas Resources, Inc. | 0,00 | 33,33 | 0,00 | 0,0000 | 0,0000 | ||||
| WFRD / Weatherford International plc | 0,00 | 0,00 | 0,00 | 0,0000 | -0,0000 | ||||
| DXC / DXC Technology Company | 0,00 | 30,00 | 0,00 | 0,0000 | 0,0000 | ||||
| CHRW / C.H. Robinson Worldwide, Inc. | 0,00 | 0,00 | 0,0000 | 0,0000 | |||||
| MAT / Mattel, Inc. | 0,00 | 0,00 | 0,0000 | 0,0000 | |||||
| ETSY / Etsy, Inc. | 0,00 | -25,00 | 0,00 | 0,0000 | -0,0000 | ||||
| QRVO / Qorvo, Inc. | 0,00 | 0,00 | 0,0000 | 0,0000 | |||||
| EXP / Eagle Materials Inc. | 0,00 | -100,00 | 0,00 | 0,0000 | |||||
| MEDP / Medpace Holdings, Inc. | 0,00 | -100,00 | 0,00 | 0,0000 | |||||
| FERG / Ferguson Enterprises Inc. | 0,00 | -100,00 | 0,00 | 0,0000 | |||||
| FTXP / Foothills Exploration, Inc. | 0,00 | -100,00 | 0,00 | 0,0000 | |||||
| FBIN / Fortune Brands Innovations, Inc. | 0,00 | -100,00 | 0,00 | 0,0000 | |||||
| GMED / Globus Medical, Inc. | 0,00 | -100,00 | 0,00 | 0,0000 | |||||
| WAB / Westinghouse Air Brake Technologies Corporation | 0,00 | -100,00 | 0,00 | 0,0000 | |||||
| PSN / Parsons Corporation | 0,00 | -100,00 | 0,00 | 0,0000 | |||||
| HOLX / Hologic, Inc. | 0,00 | -100,00 | 0,00 | 0,0000 | |||||
| EXEL / Exelixis, Inc. | 0,00 | -100,00 | 0,00 | 0,0000 | |||||
| WMS / Advanced Drainage Systems, Inc. | 0,00 | -100,00 | 0,00 | 0,0000 | |||||
| IPG / The Interpublic Group of Companies, Inc. | 0,00 | -100,00 | 0,00 | 0,0000 | |||||
| AR / Antero Resources Corporation | 0,00 | -100,00 | 0,00 | 0,0000 | |||||
| LEN / Lennar Corporation | 0,00 | -100,00 | 0,00 | 0,0000 | |||||
| CF / CF Industries Holdings, Inc. | 0,00 | -100,00 | 0,00 | 0,0000 | |||||
| DKS / DICK'S Sporting Goods, Inc. | 0,00 | -100,00 | 0,00 | 0,0000 | |||||
| CNXC / Concentrix Corporation | 0,00 | -100,00 | 0,00 | 0,0000 | |||||
| CACI / CACI International Inc | 0,00 | -100,00 | 0,00 | 0,0000 | |||||
| SGI / Somnigroup International Inc. | 0,00 | -100,00 | 0,00 | 0,0000 | |||||
| FDX / FedEx Corporation | 0,00 | -100,00 | 0,00 | -100,00 | -0,9672 | ||||
| ULTA / Ulta Beauty, Inc. | 0,00 | -100,00 | 0,00 | 0,0000 | |||||
| VST / Vistra Corp. | 0,00 | -100,00 | 0,00 | 0,0000 |