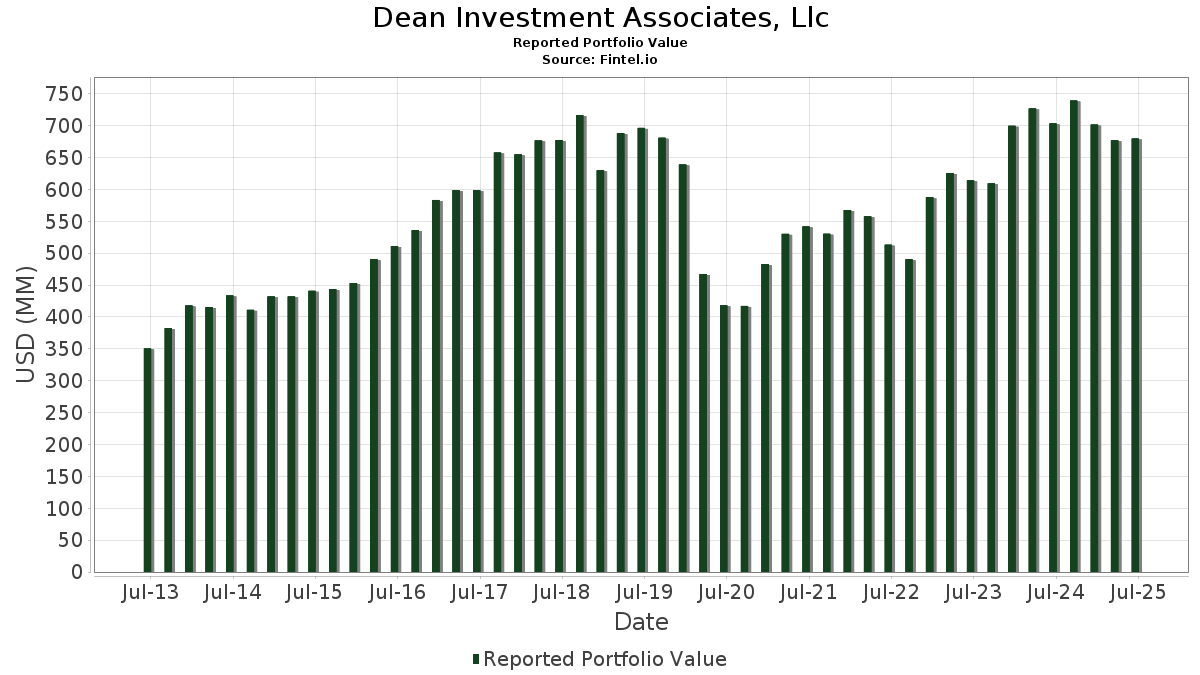
Statistiques de base
| Valeur du portefeuille | $ 679 804 723 |
| Positions actuelles | 204 |
Dernières positions, performances, ASG (à partir des dépôts 13F, 13D)
Dean Investment Associates, Llc a déclaré un total de 204 positions dans ses derniers dépôts auprès de la SEC. La valeur la plus récente du portefeuille est calculée à 679 804 723 USD. Les actifs sous gestion réels (ASG) sont cette valeur plus les liquidités (qui ne sont pas divulguées). Les principales positions de Dean Investment Associates, Llc sont JPMorgan Chase & Co. (US:JPM) , Altria Group, Inc. (US:MO) , Johnson & Johnson (US:JNJ) , SPDR Series Trust - SPDR Bloomberg Investment Grade Floating Rate ETF (US:FLRN) , and Chevron Corporation (US:CVX) . Les nouvelles positions de Dean Investment Associates, Llc incluent YETI Holdings, Inc. (US:YETI) , Atkore Inc. (US:ATKR) , Quaker Chemical Corporation (US:KWR) , .
Meilleures augmentations ce trimestre
Nous utilisons la variation de l'allocation du portefeuille car il s'agit de l'indicateur le plus significatif. Les changements peuvent être dus à des transactions ou à des variations de prix des actions.
| Titre | Actions (en millions) |
Valeur ($ en millions) |
% du portefeuille | ΔPortefeuille % |
|---|---|---|---|---|
| 0,03 | 7,66 | 1,1265 | 0,7031 | |
| 0,09 | 3,89 | 0,5716 | 0,5716 | |
| 0,15 | 3,62 | 0,5319 | 0,5319 | |
| 0,10 | 3,00 | 0,4417 | 0,4417 | |
| 0,04 | 2,95 | 0,4340 | 0,4340 | |
| 0,02 | 2,86 | 0,4201 | 0,4201 | |
| 0,04 | 2,99 | 0,4401 | 0,3879 | |
| 0,08 | 5,56 | 0,8185 | 0,3840 | |
| 0,06 | 5,82 | 0,8556 | 0,3321 | |
| 0,03 | 2,13 | 0,3126 | 0,3126 |
Principales baisses ce trimestre
Nous utilisons la variation de l'allocation du portefeuille car il s'agit de l'indicateur le plus significatif. Les changements peuvent être dus à des transactions ou à des variations de prix des actions.
| Titre | Actions (en millions) |
Valeur ($ en millions) |
% du portefeuille | ΔPortefeuille % |
|---|---|---|---|---|
| 0,00 | 0,22 | 0,0316 | -0,5590 | |
| 0,09 | 5,18 | 0,7625 | -0,5097 | |
| 0,03 | 2,11 | 0,3108 | -0,4405 | |
| 0,07 | 7,51 | 1,1048 | -0,4164 | |
| 0,03 | 4,32 | 0,6361 | -0,4089 | |
| 0,03 | 1,61 | 0,2371 | -0,3951 | |
| 0,02 | 0,55 | 0,0803 | -0,3678 | |
| 0,03 | 1,27 | 0,1872 | -0,3161 | |
| 0,05 | 2,95 | 0,4346 | -0,2867 | |
| 0,02 | 0,46 | 0,0670 | -0,2436 |
Déclarations 13F et dépôts de fonds
Ce formulaire a été déposé le 2025-08-12 pour la période de déclaration 2025-06-30. Cliquez sur l'icône du lien pour voir l'historique complet des transactions.
Mettre à niveau pour débloquer les données premium et exporter vers Excel ![]() .
.
| Titre | Type | Prix moyen de l'action | Actions (en millions) |
ΔActions (%) |
ΔActions (%) |
Valeur ($ en millions) |
Portefeuille (%) |
ΔPortefeuille (%) |
|
|---|---|---|---|---|---|---|---|---|---|
| JPM / JPMorgan Chase & Co. | 0,04 | 1,46 | 10,60 | 19,92 | 1,5588 | 0,2534 | |||
| MO / Altria Group, Inc. | 0,17 | 1,62 | 9,74 | -0,73 | 1,4321 | -0,0166 | |||
| JNJ / Johnson & Johnson | 0,06 | 1,60 | 8,98 | -6,43 | 1,3214 | -0,0965 | |||
| FLRN / SPDR Series Trust - SPDR Bloomberg Investment Grade Floating Rate ETF | 0,29 | 2,00 | 8,90 | 2,03 | 1,3092 | 0,0207 | |||
| CVX / Chevron Corporation | 0,06 | 1,51 | 8,84 | -13,12 | 1,3008 | -0,2026 | |||
| XEL / Xcel Energy Inc. | 0,13 | -1,68 | 8,82 | -5,43 | 1,2976 | -0,0801 | |||
| PEP / PepsiCo, Inc. | 0,06 | 35,70 | 8,41 | 19,51 | 1,2375 | 0,1976 | |||
| LFUS / Littelfuse, Inc. | 0,03 | 131,83 | 7,66 | 167,20 | 1,1265 | 0,7031 | |||
| WEC / WEC Energy Group, Inc. | 0,07 | -23,72 | 7,51 | -27,07 | 1,1048 | -0,4164 | |||
| VZ / Verizon Communications Inc. | 0,17 | 1,41 | 7,45 | -3,27 | 1,0954 | -0,0417 | |||
| BK / The Bank of New York Mellon Corporation | 0,08 | -4,08 | 6,94 | 4,21 | 1,0205 | 0,0371 | |||
| EOG / EOG Resources, Inc. | 0,06 | 2,21 | 6,88 | -4,67 | 1,0123 | -0,0540 | |||
| BLK / BlackRock, Inc. | 0,01 | 1,59 | 6,77 | 12,62 | 0,9953 | 0,1079 | |||
| PNC / The PNC Financial Services Group, Inc. | 0,04 | 1,24 | 6,71 | 7,38 | 0,9869 | 0,0639 | |||
| DUK / Duke Energy Corporation | 0,06 | 0,99 | 6,52 | -2,29 | 0,9597 | -0,0266 | |||
| FAST / Fastenal Company | 0,15 | 104,07 | 6,35 | 10,53 | 0,9344 | 0,0854 | |||
| CSCO / Cisco Systems, Inc. | 0,09 | -12,43 | 6,34 | -1,54 | 0,9322 | -0,0186 | |||
| SCHO / Schwab Strategic Trust - Schwab Short-Term U.S. Treasury ETF | 0,26 | -8,49 | 6,25 | -8,33 | 0,9189 | -0,0878 | |||
| DLR / Digital Realty Trust, Inc. | 0,04 | 1,51 | 6,24 | 23,50 | 0,9175 | 0,1715 | |||
| TXN / Texas Instruments Incorporated | 0,03 | 1,31 | 6,23 | 17,04 | 0,9164 | 0,1302 | |||
| LHX / L3Harris Technologies, Inc. | 0,02 | 6,39 | 6,20 | 27,51 | 0,9124 | 0,1938 | |||
| DOX / Amdocs Limited | 0,06 | 64,60 | 5,82 | 64,15 | 0,8556 | 0,3321 | |||
| DG / Dollar General Corporation | 0,05 | 3,96 | 5,73 | 35,24 | 0,8423 | 0,2169 | |||
| EHC / Encompass Health Corporation | 0,05 | -15,38 | 5,68 | 2,47 | 0,8355 | 0,0166 | |||
| UNP / Union Pacific Corporation | 0,02 | 54,56 | 5,65 | 50,53 | 0,8309 | 0,2766 | |||
| HSY / The Hershey Company | 0,03 | 1,40 | 5,62 | -1,59 | 0,8261 | -0,0170 | |||
| LAMR / Lamar Advertising Company | 0,05 | 2,16 | 5,59 | 8,96 | 0,8230 | 0,0645 | |||
| OMC / Omnicom Group Inc. | 0,08 | 118,03 | 5,56 | 89,19 | 0,8185 | 0,3840 | |||
| AZO / AutoZone, Inc. | 0,00 | -5,42 | 5,44 | -7,91 | 0,8000 | -0,0724 | |||
| VSH / Vishay Intertechnology, Inc. | 0,34 | 34,48 | 5,33 | 34,30 | 0,7845 | 0,1980 | |||
| LNT / Alliant Energy Corporation | 0,09 | -35,95 | 5,18 | -39,82 | 0,7625 | -0,5097 | |||
| PB / Prosperity Bancshares, Inc. | 0,07 | 3,76 | 5,10 | 2,12 | 0,7496 | 0,0125 | |||
| BELFB / Bel Fuse Inc. | 0,05 | 7,48 | 5,09 | 40,26 | 0,7489 | 0,2127 | |||
| ALG / Alamo Group Inc. | 0,02 | -16,18 | 5,04 | 2,73 | 0,7420 | 0,0166 | |||
| AEIS / Advanced Energy Industries, Inc. | 0,04 | -23,85 | 5,04 | 5,86 | 0,7420 | 0,0382 | |||
| KMI / Kinder Morgan, Inc. | 0,17 | 0,88 | 5,01 | 3,96 | 0,7375 | 0,0251 | |||
| AMGN / Amgen Inc. | 0,02 | 30,92 | 4,98 | 17,33 | 0,7319 | 0,1055 | |||
| HD / The Home Depot, Inc. | 0,01 | 2,21 | 4,90 | 2,26 | 0,7202 | 0,0129 | |||
| ESS / Essex Property Trust, Inc. | 0,02 | 3,50 | 4,80 | -4,33 | 0,7061 | -0,0350 | |||
| ESE / ESCO Technologies Inc. | 0,02 | 0,68 | 4,79 | 21,41 | 0,7041 | 0,1217 | |||
| TROW / T. Rowe Price Group, Inc. | 0,05 | 2,12 | 4,76 | 7,26 | 0,6996 | 0,0446 | |||
| AEP / American Electric Power Company, Inc. | 0,04 | 2,11 | 4,53 | -3,04 | 0,6664 | -0,0238 | |||
| ITW / Illinois Tool Works Inc. | 0,02 | 83,66 | 4,50 | 83,08 | 0,6624 | 0,2991 | |||
| PAYX / Paychex, Inc. | 0,03 | 31,89 | 4,50 | 24,36 | 0,6623 | 0,1275 | |||
| PRU / Prudential Financial, Inc. | 0,04 | 2,07 | 4,48 | -1,80 | 0,6596 | -0,0149 | |||
| MCHP / Microchip Technology Incorporated | 0,06 | 22,64 | 4,47 | 78,25 | 0,6572 | 0,2870 | |||
| RRX / Regal Rexnord Corporation | 0,03 | 25,52 | 4,44 | 59,83 | 0,6533 | 0,2428 | |||
| AEE / Ameren Corporation | 0,05 | 5,07 | 4,40 | 0,50 | 0,6480 | 0,0006 | |||
| APD / Air Products and Chemicals, Inc. | 0,02 | 2,16 | 4,38 | -2,30 | 0,6447 | -0,0179 | |||
| WRB / W. R. Berkley Corporation | 0,06 | 5,08 | 4,33 | 8,47 | 0,6371 | 0,0474 | |||
| IFF / International Flavors & Fragrances Inc. | 0,06 | 8,01 | 4,33 | 2,34 | 0,6368 | 0,0121 | |||
| KMB / Kimberly-Clark Corporation | 0,03 | -32,57 | 4,32 | -38,87 | 0,6361 | -0,4089 | |||
| MDLZ / Mondelez International, Inc. | 0,06 | 2,95 | 4,27 | 2,32 | 0,6287 | 0,0117 | |||
| PSA / Public Storage | 0,01 | 0,81 | 4,26 | -1,16 | 0,6268 | -0,0101 | |||
| SSNC / SS&C Technologies Holdings, Inc. | 0,05 | 4,75 | 4,24 | 3,84 | 0,6241 | 0,0205 | |||
| AMT / American Tower Corporation | 0,02 | 1,53 | 4,20 | 3,14 | 0,6178 | 0,0162 | |||
| PFG / Principal Financial Group, Inc. | 0,05 | 1,86 | 4,11 | -4,10 | 0,6051 | -0,0286 | |||
| PPG / PPG Industries, Inc. | 0,04 | 15,72 | 4,07 | 20,39 | 0,5985 | 0,0992 | |||
| KNX / Knight-Swift Transportation Holdings Inc. | 0,09 | 22,36 | 4,05 | 24,46 | 0,5958 | 0,1150 | |||
| ARW / Arrow Electronics, Inc. | 0,03 | 4,55 | 4,04 | 28,29 | 0,5938 | 0,1291 | |||
| HIG / The Hartford Insurance Group, Inc. | 0,03 | 5,07 | 4,02 | 7,74 | 0,5915 | 0,0402 | |||
| JAZZ / Jazz Pharmaceuticals plc | 0,04 | 23,61 | 3,99 | 5,67 | 0,5868 | 0,0291 | |||
| DGX / Quest Diagnostics Incorporated | 0,02 | 5,07 | 3,98 | 11,53 | 0,5861 | 0,0585 | |||
| AMP / Ameriprise Financial, Inc. | 0,01 | 4,59 | 3,95 | 15,31 | 0,5818 | 0,0751 | |||
| AIZ / Assurant, Inc. | 0,02 | 5,07 | 3,94 | -1,08 | 0,5803 | -0,0087 | |||
| RGA / Reinsurance Group of America, Incorporated | 0,02 | 17,23 | 3,93 | 18,10 | 0,5787 | 0,0866 | |||
| SMP / Standard Motor Products, Inc. | 0,13 | -1,20 | 3,93 | 21,75 | 0,5782 | 0,1013 | |||
| WHD / Cactus, Inc. | 0,09 | 3,89 | 0,5716 | 0,5716 | |||||
| MOH / Molina Healthcare, Inc. | 0,01 | -3,39 | 3,85 | -12,62 | 0,5663 | -0,0845 | |||
| LAD / Lithia Motors, Inc. | 0,01 | 16,77 | 3,84 | 34,38 | 0,5647 | 0,1427 | |||
| CMCSA / Comcast Corporation | 0,11 | 2,38 | 3,82 | -0,98 | 0,5621 | -0,0079 | |||
| DOV / Dover Corporation | 0,02 | 5,07 | 3,81 | 9,60 | 0,5608 | 0,0469 | |||
| ATO / Atmos Energy Corporation | 0,02 | 3,96 | 3,80 | 3,66 | 0,5589 | 0,0174 | |||
| GTES / Gates Industrial Corporation plc | 0,16 | 24,85 | 3,77 | 56,21 | 0,5552 | 0,1982 | |||
| SYY / Sysco Corporation | 0,05 | 101,19 | 3,76 | 103,08 | 0,5533 | 0,2797 | |||
| TTWO / Take-Two Interactive Software, Inc. | 0,02 | 5,07 | 3,71 | 23,13 | 0,5459 | 0,1007 | |||
| BWA / BorgWarner Inc. | 0,11 | 5,07 | 3,68 | 22,80 | 0,5413 | 0,0986 | |||
| AVY / Avery Dennison Corporation | 0,02 | 22,05 | 3,65 | 20,32 | 0,5367 | 0,0888 | |||
| SHOO / Steven Madden, Ltd. | 0,15 | 3,62 | 0,5319 | 0,5319 | |||||
| OGE / OGE Energy Corp. | 0,08 | 4,74 | 3,61 | 1,12 | 0,5313 | 0,0038 | |||
| WERN / Werner Enterprises, Inc. | 0,13 | 12,35 | 3,60 | 4,89 | 0,5303 | 0,0227 | |||
| USFD / US Foods Holding Corp. | 0,05 | 4,86 | 3,60 | 23,37 | 0,5289 | 0,0984 | |||
| INDB / Independent Bank Corp. | 0,06 | -5,91 | 3,56 | -5,56 | 0,5243 | -0,0332 | |||
| REG / Regency Centers Corporation | 0,05 | 14,59 | 3,56 | 10,66 | 0,5238 | 0,0485 | |||
| HP / Helmerich & Payne, Inc. | 0,23 | 43,13 | 3,51 | -16,93 | 0,5168 | -0,1079 | |||
| INVX / Innovex International, Inc. | 0,22 | 4,20 | 3,50 | -9,39 | 0,5142 | -0,0556 | |||
| CNP / CenterPoint Energy, Inc. | 0,10 | -20,86 | 3,49 | -19,75 | 0,5135 | -0,1290 | |||
| LMT / Lockheed Martin Corporation | 0,01 | 47,45 | 3,44 | 52,84 | 0,5060 | 0,1736 | |||
| RF / Regions Financial Corporation | 0,14 | 4,88 | 3,41 | 13,52 | 0,5015 | 0,0579 | |||
| AVB / AvalonBay Communities, Inc. | 0,02 | 15,84 | 3,39 | 9,85 | 0,4988 | 0,0428 | |||
| ITT / ITT Inc. | 0,02 | 5,08 | 3,39 | 27,59 | 0,4987 | 0,1062 | |||
| PZZA / Papa John's International, Inc. | 0,07 | -21,53 | 3,39 | -6,51 | 0,4984 | -0,0369 | |||
| PR / Permian Resources Corporation | 0,25 | 17,20 | 3,39 | 15,24 | 0,4984 | 0,0642 | |||
| ASTE / Astec Industries, Inc. | 0,08 | 33,47 | 3,38 | 61,47 | 0,4971 | 0,1880 | |||
| RJF / Raymond James Financial, Inc. | 0,02 | 5,07 | 3,36 | 16,00 | 0,4939 | 0,0664 | |||
| CTRA / Coterra Energy Inc. | 0,13 | 38,47 | 3,34 | 21,60 | 0,4919 | 0,0857 | |||
| BR / Broadridge Financial Solutions, Inc. | 0,01 | 5,07 | 3,28 | 5,30 | 0,4826 | 0,0225 | |||
| SRCE / 1st Source Corporation | 0,05 | -14,51 | 3,26 | -11,28 | 0,4792 | -0,0632 | |||
| AGCO / AGCO Corporation | 0,03 | 5,07 | 3,25 | 17,09 | 0,4788 | 0,0682 | |||
| CBRE / CBRE Group, Inc. | 0,02 | 5,08 | 3,24 | 12,61 | 0,4768 | 0,0515 | |||
| THFF / First Financial Corporation | 0,06 | -2,91 | 3,21 | 7,42 | 0,4728 | 0,0308 | |||
| LKQ / LKQ Corporation | 0,09 | 2,07 | 3,20 | -11,19 | 0,4707 | -0,0616 | |||
| CAG / Conagra Brands, Inc. | 0,15 | 5,07 | 3,16 | -19,35 | 0,4649 | -0,1140 | |||
| STAG / STAG Industrial, Inc. | 0,09 | 4,81 | 3,12 | 5,26 | 0,4589 | 0,0212 | |||
| RUSHA / Rush Enterprises, Inc. | 0,06 | 3,08 | 3,12 | -0,57 | 0,4588 | -0,0046 | |||
| CM / Canadian Imperial Bank of Commerce | 0,04 | 2,45 | 3,11 | 28,89 | 0,4575 | 0,1011 | |||
| RSG / Republic Services, Inc. | 0,01 | -13,12 | 3,09 | -11,52 | 0,4544 | -0,0613 | |||
| BJ / BJ's Wholesale Club Holdings, Inc. | 0,03 | -19,41 | 3,09 | -23,85 | 0,4542 | -0,1447 | |||
| WY / Weyerhaeuser Company | 0,12 | 23,97 | 3,08 | 8,74 | 0,4538 | 0,0348 | |||
| WKC / World Kinect Corporation | 0,11 | -17,21 | 3,05 | -17,24 | 0,4493 | -0,0958 | |||
| YETI / YETI Holdings, Inc. | 0,10 | 3,00 | 0,4417 | 0,4417 | |||||
| NEE / NextEra Energy, Inc. | 0,04 | 764,69 | 2,99 | 747,31 | 0,4401 | 0,3879 | |||
| HAS / Hasbro, Inc. | 0,04 | 5,07 | 2,98 | 26,13 | 0,4381 | 0,0893 | |||
| CSGS / CSG Systems International, Inc. | 0,05 | -43,98 | 2,95 | -39,49 | 0,4346 | -0,2867 | |||
| EMN / Eastman Chemical Company | 0,04 | 2,95 | 0,4340 | 0,4340 | |||||
| CRI / Carter's, Inc. | 0,10 | 25,95 | 2,94 | -7,22 | 0,4329 | -0,0356 | |||
| ZBH / Zimmer Biomet Holdings, Inc. | 0,03 | 4,57 | 2,94 | -15,74 | 0,4323 | -0,0828 | |||
| CATY / Cathay General Bancorp | 0,06 | 9,07 | 2,93 | 15,37 | 0,4307 | 0,0559 | |||
| PFE / Pfizer Inc. | 0,12 | 2,62 | 2,91 | -1,82 | 0,4277 | -0,0098 | |||
| JOUT / Johnson Outdoors Inc. | 0,10 | 6,18 | 2,90 | 29,39 | 0,4262 | 0,0954 | |||
| PLOW / Douglas Dynamics, Inc. | 0,10 | 0,16 | 2,88 | 27,10 | 0,4230 | 0,0887 | |||
| MRK / Merck & Co., Inc. | 0,04 | 1,63 | 2,86 | -10,38 | 0,4207 | -0,0506 | |||
| WCC / WESCO International, Inc. | 0,02 | 2,86 | 0,4201 | 0,4201 | |||||
| PHM / PulteGroup, Inc. | 0,03 | 20,55 | 2,85 | 23,64 | 0,4186 | 0,0787 | |||
| BKR / Baker Hughes Company | 0,07 | 5,08 | 2,81 | -8,34 | 0,4139 | -0,0395 | |||
| PRG / PROG Holdings, Inc. | 0,09 | 60,52 | 2,79 | 77,06 | 0,4101 | 0,1776 | |||
| HCKT / The Hackett Group, Inc. | 0,11 | -22,99 | 2,72 | -33,00 | 0,3996 | -0,1994 | |||
| PRGO / Perrigo Company plc | 0,10 | 33,46 | 2,67 | 27,19 | 0,3922 | 0,0825 | |||
| BNL / Broadstone Net Lease, Inc. | 0,16 | -30,72 | 2,64 | -34,75 | 0,3879 | -0,2090 | |||
| GPN / Global Payments Inc. | 0,03 | 5,06 | 2,62 | -14,11 | 0,3859 | -0,0653 | |||
| QCRH / QCR Holdings, Inc. | 0,04 | -15,12 | 2,62 | -19,20 | 0,3858 | -0,0936 | |||
| CPB / The Campbell's Company | 0,09 | 26,56 | 2,61 | -2,83 | 0,3844 | -0,0129 | |||
| VRRM / Verra Mobility Corporation | 0,10 | 153,79 | 2,60 | 186,45 | 0,3827 | 0,2485 | |||
| KMT / Kennametal Inc. | 0,11 | 107,14 | 2,60 | 123,37 | 0,3826 | 0,2105 | |||
| SON / Sonoco Products Company | 0,06 | 1,95 | 2,53 | -6,01 | 0,3727 | -0,0254 | |||
| SCL / Stepan Company | 0,05 | 116,26 | 2,47 | 114,50 | 0,3635 | 0,1933 | |||
| HTLD / Heartland Express, Inc. | 0,28 | 7,46 | 2,45 | 0,70 | 0,3600 | 0,0010 | |||
| COLM / Columbia Sportswear Company | 0,04 | 11,94 | 2,42 | -9,69 | 0,3566 | -0,0398 | |||
| BMY / Bristol-Myers Squibb Company | 0,05 | 2,06 | 2,39 | -22,52 | 0,3522 | -0,1044 | |||
| SKX / Skechers U.S.A., Inc. | 0,04 | 5,07 | 2,36 | 16,80 | 0,3478 | 0,0487 | |||
| BRK.B / Berkshire Hathaway Inc. | 0,00 | -1,29 | 2,35 | -9,97 | 0,3454 | -0,0398 | |||
| GSBC / Great Southern Bancorp, Inc. | 0,04 | -4,12 | 2,31 | 1,76 | 0,3400 | 0,0046 | |||
| COHU / Cohu, Inc. | 0,11 | 124,64 | 2,15 | 193,98 | 0,3161 | 0,2081 | |||
| ATKR / Atkore Inc. | 0,03 | 2,13 | 0,3126 | 0,3126 | |||||
| MMS / Maximus, Inc. | 0,03 | -59,65 | 2,11 | -58,47 | 0,3108 | -0,4405 | |||
| STBA / S&T Bancorp, Inc. | 0,05 | -13,28 | 2,06 | -11,48 | 0,3030 | -0,0407 | |||
| WGO / Winnebago Industries, Inc. | 0,07 | 226,41 | 2,04 | 174,76 | 0,2996 | 0,1900 | |||
| VIAV / Viavi Solutions Inc. | 0,20 | -6,37 | 2,03 | -15,75 | 0,2984 | -0,0572 | |||
| HLIT / Harmonic Inc. | 0,21 | 3,10 | 2,01 | 1,82 | 0,2958 | 0,0040 | |||
| CAC / Camden National Corporation | 0,05 | -27,69 | 1,93 | -27,50 | 0,2835 | -0,1091 | |||
| HUN / Huntsman Corporation | 0,18 | 247,06 | 1,92 | 129,20 | 0,2830 | 0,1589 | |||
| MBUU / Malibu Boats, Inc. | 0,06 | 61,27 | 1,88 | 64,80 | 0,2769 | 0,1081 | |||
| TGNA / TEGNA Inc. | 0,10 | -18,24 | 1,68 | -24,80 | 0,2472 | -0,0829 | |||
| HCSG / Healthcare Services Group, Inc. | 0,11 | 20,88 | 1,68 | 80,41 | 0,2465 | 0,1092 | |||
| KWR / Quaker Chemical Corporation | 0,01 | 1,65 | 0,2434 | 0,2434 | |||||
| SLGN / Silgan Holdings Inc. | 0,03 | -64,46 | 1,61 | -62,35 | 0,2371 | -0,3951 | |||
| LIN / Linde plc | 0,00 | -1,07 | 1,61 | -0,31 | 0,2371 | -0,0017 | |||
| MUB / iShares Trust - iShares National Muni Bond ETF | 0,02 | 0,00 | 1,59 | -0,94 | 0,2334 | -0,0031 | |||
| PJT / PJT Partners Inc. | 0,01 | -1,03 | 1,53 | 18,48 | 0,2254 | 0,0343 | |||
| MTX / Minerals Technologies Inc. | 0,03 | -20,33 | 1,49 | -30,99 | 0,2199 | -0,1000 | |||
| OEC / Orion S.A. | 0,14 | 118,54 | 1,49 | 77,35 | 0,2190 | 0,0950 | |||
| FHI / Federated Hermes, Inc. | 0,03 | -7,59 | 1,46 | 0,41 | 0,2144 | 0,0001 | |||
| BRC / Brady Corporation | 0,02 | 15,23 | 1,46 | 10,90 | 0,2141 | 0,0202 | |||
| CNMD / CONMED Corporation | 0,03 | -33,08 | 1,45 | -42,31 | 0,2136 | -0,1580 | |||
| MSFT / Microsoft Corporation | 0,00 | -0,63 | 1,40 | 31,77 | 0,2063 | 0,0490 | |||
| CMCO / Columbus McKinnon Corporation | 0,09 | -24,24 | 1,40 | -31,67 | 0,2057 | -0,0966 | |||
| IUSV / iShares Trust - iShares Core S&P U.S. Value ETF | 0,01 | 0,00 | 1,40 | 2,57 | 0,2054 | 0,0042 | |||
| DHIL / Diamond Hill Investment Group, Inc. | 0,01 | -34,18 | 1,40 | -33,05 | 0,2054 | -0,1027 | |||
| DCI / Donaldson Company, Inc. | 0,02 | 11,28 | 1,37 | 15,14 | 0,2014 | 0,0257 | |||
| SAFT / Safety Insurance Group, Inc. | 0,02 | -44,26 | 1,30 | -43,91 | 0,1919 | -0,1516 | |||
| MCK / McKesson Corporation | 0,00 | -15,72 | 1,28 | -8,24 | 0,1884 | -0,0178 | |||
| EIG / Employers Holdings, Inc. | 0,03 | -59,91 | 1,27 | -62,67 | 0,1872 | -0,3161 | |||
| MKSI / MKS Inc. | 0,01 | 1,26 | 0,1859 | 0,1859 | |||||
| FI / Fiserv, Inc. | 0,01 | 8,49 | 1,20 | -15,29 | 0,1769 | -0,0328 | |||
| LEG / Leggett & Platt, Incorporated | 0,13 | -19,51 | 1,16 | -9,23 | 0,1708 | -0,0182 | |||
| JBSS / John B. Sanfilippo & Son, Inc. | 0,02 | -55,12 | 1,06 | -59,96 | 0,1564 | -0,2358 | |||
| HSIC / Henry Schein, Inc. | 0,01 | 20,32 | 1,06 | 28,42 | 0,1562 | 0,0340 | |||
| AVGO / Broadcom Inc. | 0,00 | 0,00 | 0,94 | 64,74 | 0,1383 | 0,0539 | |||
| KEYS / Keysight Technologies, Inc. | 0,01 | 0,94 | 0,1376 | 0,1376 | |||||
| UNH / UnitedHealth Group Incorporated | 0,00 | 0,93 | 0,1370 | 0,1370 | |||||
| SHYD / VanEck ETF Trust - VanEck Short High Yield Muni ETF | 0,04 | 0,00 | 0,93 | 0,43 | 0,1362 | 0,0000 | |||
| AFL / Aflac Incorporated | 0,01 | -0,80 | 0,85 | -6,00 | 0,1246 | -0,0084 | |||
| CUZ / Cousins Properties Incorporated | 0,03 | -49,94 | 0,83 | -49,05 | 0,1224 | -0,1188 | |||
| LOW / Lowe's Companies, Inc. | 0,00 | -0,96 | 0,83 | -5,82 | 0,1216 | -0,0080 | |||
| FULT / Fulton Financial Corporation | 0,05 | -54,33 | 0,82 | -54,45 | 0,1211 | -0,1459 | |||
| UHS / Universal Health Services, Inc. | 0,00 | -0,68 | 0,81 | -4,24 | 0,1198 | -0,0058 | |||
| SUB / iShares Trust - iShares Short-Term National Muni Bond ETF | 0,01 | 0,00 | 0,71 | 0,71 | 0,1040 | 0,0003 | |||
| SWK / Stanley Black & Decker, Inc. | 0,01 | -0,96 | 0,69 | -12,75 | 0,1018 | -0,0153 | |||
| LLY / Eli Lilly and Company | 0,00 | 0,00 | 0,68 | -5,57 | 0,0998 | -0,0064 | |||
| ROST / Ross Stores, Inc. | 0,01 | 24,34 | 0,66 | 24,20 | 0,0967 | 0,0185 | |||
| GTY / Getty Realty Corp. | 0,02 | -79,69 | 0,55 | -82,00 | 0,0803 | -0,3678 | |||
| MHK / Mohawk Industries, Inc. | 0,00 | -2,53 | 0,51 | -10,49 | 0,0754 | -0,0092 | |||
| SPB / Spectrum Brands Holdings, Inc. | 0,01 | -53,67 | 0,50 | -65,70 | 0,0735 | -0,1415 | |||
| PM / Philip Morris International Inc. | 0,00 | 0,00 | 0,47 | 14,74 | 0,0688 | 0,0086 | |||
| SFNC / Simmons First National Corporation | 0,02 | -76,54 | 0,46 | -78,35 | 0,0670 | -0,2436 | |||
| CMI / Cummins Inc. | 0,00 | -0,55 | 0,41 | 4,05 | 0,0605 | 0,0020 | |||
| FC / Franklin Covey Co. | 0,02 | -59,44 | 0,38 | -66,49 | 0,0552 | -0,1102 | |||
| EMR / Emerson Electric Co. | 0,00 | -0,85 | 0,34 | 20,57 | 0,0501 | 0,0084 | |||
| MET / MetLife, Inc. | 0,00 | -0,68 | 0,34 | -0,59 | 0,0500 | -0,0005 | |||
| GOOGL / Alphabet Inc. | 0,00 | 30,51 | 0,30 | 49,02 | 0,0448 | 0,0146 | |||
| ELV / Elevance Health, Inc. | 0,00 | 19,81 | 0,29 | 7,30 | 0,0433 | 0,0027 | |||
| V / Visa Inc. | 0,00 | -1,66 | 0,23 | -0,43 | 0,0341 | -0,0003 | |||
| RPM / RPM International Inc. | 0,00 | 0,23 | 0,0339 | 0,0339 | |||||
| UPS / United Parcel Service, Inc. | 0,00 | -94,14 | 0,22 | -94,62 | 0,0316 | -0,5590 | |||
| BCE / BCE Inc. | 0,00 | -100,00 | 0,00 | 0,0000 | |||||
| SPTN / SpartanNash Company | 0,00 | -100,00 | 0,00 | 0,0000 | |||||
| FDS / FactSet Research Systems Inc. | 0,00 | -100,00 | 0,00 | 0,0000 | |||||
| CHD / Church & Dwight Co., Inc. | 0,00 | -100,00 | 0,00 | 0,0000 | |||||
| FLO / Flowers Foods, Inc. | 0,00 | -100,00 | 0,00 | 0,0000 | |||||
| NWN / Northwest Natural Holding Company | 0,00 | -100,00 | 0,00 | 0,0000 | |||||
| CASY / Casey's General Stores, Inc. | 0,00 | -100,00 | 0,00 | 0,0000 | |||||
| PDCO / Patterson Companies, Inc. | 0,00 | -100,00 | 0,00 | 0,0000 | |||||
| ATSG / Air Transport Services Group, Inc. | 0,00 | -100,00 | 0,00 | 0,0000 | |||||
| NWE / NorthWestern Energy Group, Inc. | 0,00 | -100,00 | 0,00 | 0,0000 | |||||
| POR / Portland General Electric Company | 0,00 | -100,00 | 0,00 | 0,0000 | |||||
| AVA / Avista Corporation | 0,00 | -100,00 | 0,00 | 0,0000 | |||||
| AWR / American States Water Company | 0,00 | -100,00 | 0,00 | 0,0000 | |||||
| FDP / Fresh Del Monte Produce Inc. | 0,00 | -100,00 | 0,00 | 0,0000 | |||||
| OGS / ONE Gas, Inc. | 0,00 | -100,00 | 0,00 | 0,0000 | |||||
| YUMC / Yum China Holdings, Inc. | 0,00 | -100,00 | 0,00 | 0,0000 | |||||
| ETR / Entergy Corporation | 0,00 | -100,00 | 0,00 | 0,0000 | |||||
| SAM / The Boston Beer Company, Inc. | 0,00 | -100,00 | 0,00 | 0,0000 | |||||
| SR / Spire Inc. | 0,00 | -100,00 | 0,00 | 0,0000 |