Statistiques de base
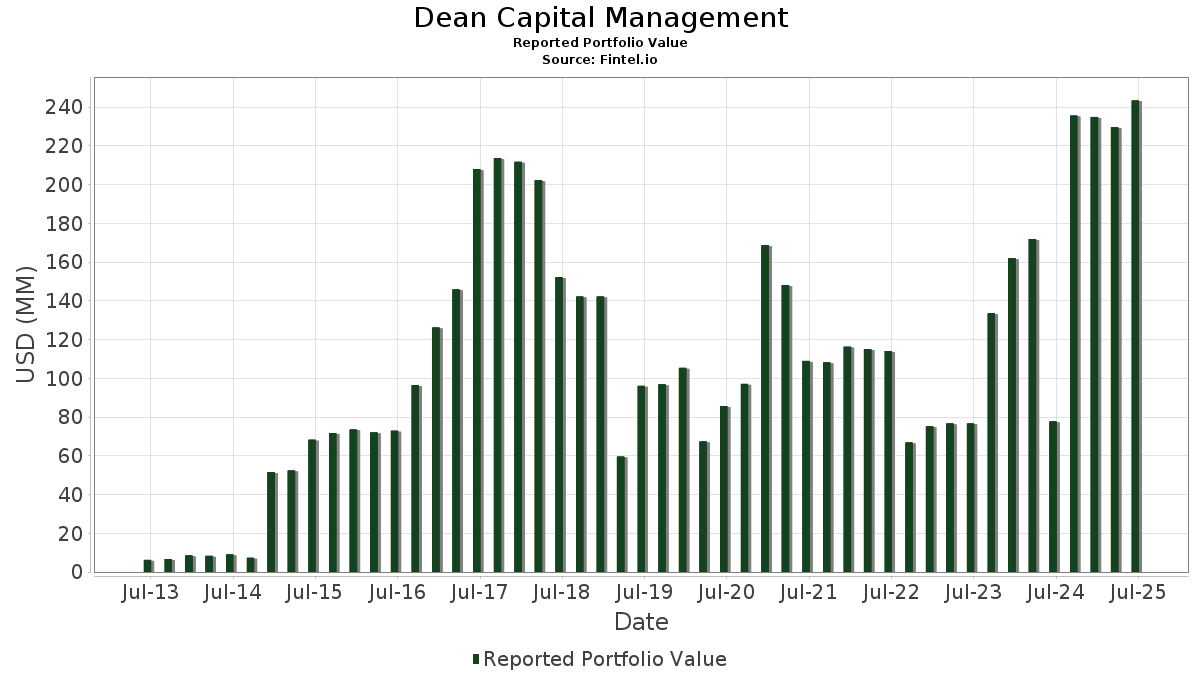
| Valeur du portefeuille | $ 243 325 361 |
| Positions actuelles | 124 |
Dernières positions, performances, ASG (à partir des dépôts 13F, 13D)
Dean Capital Management a déclaré un total de 124 positions dans ses derniers dépôts auprès de la SEC. La valeur la plus récente du portefeuille est calculée à 243 325 361 USD. Les actifs sous gestion réels (ASG) sont cette valeur plus les liquidités (qui ne sont pas divulguées). Les principales positions de Dean Capital Management sont Littelfuse, Inc. (US:LFUS) , Bel Fuse Inc. (US:BELFB) , Alamo Group Inc. (US:ALG) , Advanced Energy Industries, Inc. (US:AEIS) , and ESCO Technologies Inc. (US:ESE) . Les nouvelles positions de Dean Capital Management incluent YETI Holdings, Inc. (US:YETI) , Atkore Inc. (US:ATKR) , Quaker Chemical Corporation (US:KWR) , MKS Inc. (US:MKSI) , and .
Meilleures augmentations ce trimestre
Nous utilisons la variation de l'allocation du portefeuille car il s'agit de l'indicateur le plus significatif. Les changements peuvent être dus à des transactions ou à des variations de prix des actions.
| Titre | Actions (en millions) |
Valeur ($ en millions) |
% du portefeuille | ΔPortefeuille % |
|---|---|---|---|---|
| 0,02 | 5,05 | 2,0517 | 1,3817 | |
| 0,07 | 3,13 | 1,2718 | 1,2718 | |
| 0,12 | 2,91 | 1,1834 | 1,1834 | |
| 0,08 | 2,42 | 0,9941 | 0,9941 | |
| 0,02 | 1,71 | 0,7032 | 0,7032 | |
| 0,02 | 1,61 | 0,6542 | 0,6542 | |
| 0,01 | 1,56 | 0,6333 | 0,6333 | |
| 0,08 | 2,10 | 0,8519 | 0,5730 | |
| 0,01 | 1,33 | 0,5476 | 0,5476 | |
| 0,04 | 4,10 | 1,6661 | 0,5421 |
Principales baisses ce trimestre
Nous utilisons la variation de l'allocation du portefeuille car il s'agit de l'indicateur le plus significatif. Les changements peuvent être dus à des transactions ou à des variations de prix des actions.
| Titre | Actions (en millions) |
Valeur ($ en millions) |
% du portefeuille | ΔPortefeuille % |
|---|---|---|---|---|
| 0,02 | 1,70 | 0,6917 | -0,8821 | |
| 0,02 | 1,30 | 0,5275 | -0,7997 | |
| 0,02 | 1,02 | 0,4165 | -0,6293 | |
| 0,04 | 2,38 | 0,9673 | -0,5299 | |
| 0,02 | 0,37 | 0,1491 | -0,5024 | |
| 0,01 | 0,86 | 0,3480 | -0,4789 | |
| 0,13 | 2,12 | 0,8629 | -0,3771 | |
| 0,07 | 1,68 | 0,6838 | -0,3469 | |
| 0,02 | 1,17 | 0,4754 | -0,2956 | |
| 0,01 | 0,40 | 0,1635 | -0,2869 |
Déclarations 13F et dépôts de fonds
Ce formulaire a été déposé le 2025-08-14 pour la période de déclaration 2025-06-30. Cliquez sur l'icône du lien pour voir l'historique complet des transactions.
Mettre à niveau pour débloquer les données premium et exporter vers Excel ![]() .
.
| Titre | Type | Prix moyen de l'action | Actions (en millions) |
ΔActions (%) |
ΔActions (%) |
Valeur ($ en millions) |
Portefeuille (%) |
ΔPortefeuille (%) |
|
|---|---|---|---|---|---|---|---|---|---|
| LFUS / Littelfuse, Inc. | 0,02 | 184,84 | 5,05 | 228,37 | 2,0517 | 1,3817 | |||
| BELFB / Bel Fuse Inc. | 0,04 | 21,76 | 4,10 | 58,94 | 1,6661 | 0,5421 | |||
| ALG / Alamo Group Inc. | 0,02 | -4,16 | 4,06 | 17,44 | 1,6508 | 0,1441 | |||
| AEIS / Advanced Energy Industries, Inc. | 0,03 | -12,95 | 4,06 | 21,04 | 1,6507 | 0,1886 | |||
| ESE / ESCO Technologies Inc. | 0,02 | 15,81 | 3,88 | 39,66 | 1,5761 | 0,3663 | |||
| VSH / Vishay Intertechnology, Inc. | 0,22 | 68,34 | 3,44 | 68,15 | 1,3974 | 0,5065 | |||
| WHD / Cactus, Inc. | 0,07 | 3,13 | 1,2718 | 1,2718 | |||||
| BK / The Bank of New York Mellon Corporation | 0,03 | 5,66 | 3,11 | 14,79 | 1,2653 | 0,0836 | |||
| SHOO / Steven Madden, Ltd. | 0,12 | 2,91 | 1,1834 | 1,1834 | |||||
| WERN / Werner Enterprises, Inc. | 0,11 | 28,58 | 2,90 | 20,07 | 1,1797 | 0,1265 | |||
| INDB / Independent Bank Corp. | 0,05 | 7,59 | 2,87 | 8,01 | 1,1671 | 0,0087 | |||
| HP / Helmerich & Payne, Inc. | 0,19 | 61,67 | 2,83 | -6,17 | 1,1497 | -0,1637 | |||
| INVX / Innovex International, Inc. | 0,18 | 17,97 | 2,81 | 2,59 | 1,1440 | -0,0511 | |||
| PZZA / Papa John's International, Inc. | 0,06 | -10,27 | 2,73 | 6,89 | 1,1094 | -0,0030 | |||
| ASTE / Astec Industries, Inc. | 0,07 | 51,18 | 2,72 | 82,99 | 1,1064 | 0,4582 | |||
| SRCE / 1st Source Corporation | 0,04 | -2,44 | 2,62 | 1,24 | 1,0661 | -0,0626 | |||
| THFF / First Financial Corporation | 0,05 | 11,00 | 2,59 | 22,83 | 1,0520 | 0,1338 | |||
| DG / Dollar General Corporation | 0,02 | 5,66 | 2,55 | 37,45 | 1,0371 | 0,2283 | |||
| LHX / L3Harris Technologies, Inc. | 0,01 | 5,65 | 2,54 | 26,64 | 1,0336 | 0,1585 | |||
| RUSHA / Rush Enterprises, Inc. | 0,05 | 17,89 | 2,51 | 13,67 | 1,0214 | 0,0585 | |||
| WKC / World Kinect Corporation | 0,09 | -6,25 | 2,46 | -6,29 | 0,9996 | -0,1437 | |||
| MCHP / Microchip Technology Incorporated | 0,03 | 23,32 | 2,44 | 79,25 | 0,9904 | 0,3982 | |||
| YETI / YETI Holdings, Inc. | 0,08 | 2,42 | 0,9941 | 0,9941 | |||||
| AEE / Ameren Corporation | 0,03 | 5,65 | 2,40 | 1,05 | 0,9767 | -0,0592 | |||
| CSGS / CSG Systems International, Inc. | 0,04 | -35,88 | 2,38 | -30,76 | 0,9673 | -0,5299 | |||
| CRI / Carter's, Inc. | 0,08 | 44,08 | 2,37 | 6,14 | 0,9635 | -0,0095 | |||
| WRB / W. R. Berkley Corporation | 0,03 | 5,65 | 2,36 | 9,10 | 0,9603 | 0,0166 | |||
| CATY / Cathay General Bancorp | 0,05 | 24,80 | 2,36 | 32,04 | 0,9583 | 0,1804 | |||
| EHC / Encompass Health Corporation | 0,02 | -15,56 | 2,35 | 2,22 | 0,9546 | -0,0462 | |||
| SMP / Standard Motor Products, Inc. | 0,08 | 13,02 | 2,34 | 39,28 | 0,9531 | 0,2195 | |||
| JOUT / Johnson Outdoors Inc. | 0,08 | 21,44 | 2,33 | 48,03 | 0,9483 | 0,2614 | |||
| PLOW / Douglas Dynamics, Inc. | 0,08 | 14,48 | 2,32 | 45,23 | 0,9410 | 0,2465 | |||
| SSNC / SS&C Technologies Holdings, Inc. | 0,03 | 5,65 | 2,31 | 4,75 | 0,9407 | -0,0221 | |||
| PRG / PROG Holdings, Inc. | 0,08 | 83,54 | 2,24 | 102,53 | 0,9225 | 0,4396 | |||
| PB / Prosperity Bancshares, Inc. | 0,03 | 5,66 | 2,21 | 3,95 | 0,8982 | -0,0277 | |||
| ARW / Arrow Electronics, Inc. | 0,02 | 5,65 | 2,20 | 29,70 | 0,8949 | 0,1551 | |||
| HIG / The Hartford Insurance Group, Inc. | 0,02 | 5,64 | 2,19 | 8,35 | 0,8918 | 0,0093 | |||
| JAZZ / Jazz Pharmaceuticals plc | 0,02 | 24,33 | 2,18 | 6,25 | 0,8844 | -0,0076 | |||
| DGX / Quest Diagnostics Incorporated | 0,01 | 5,66 | 2,17 | 12,13 | 0,8832 | 0,0392 | |||
| AIZ / Assurant, Inc. | 0,01 | 5,66 | 2,15 | -0,51 | 0,8738 | -0,0677 | |||
| PRGO / Perrigo Company plc | 0,08 | 52,57 | 2,15 | 45,39 | 0,8726 | 0,2293 | |||
| RGA / Reinsurance Group of America, Incorporated | 0,01 | 17,94 | 2,15 | 18,84 | 0,8720 | 0,0853 | |||
| BNL / Broadstone Net Lease, Inc. | 0,13 | -20,80 | 2,12 | -25,44 | 0,8629 | -0,3771 | |||
| QCRH / QCR Holdings, Inc. | 0,03 | -2,97 | 2,11 | -7,61 | 0,8583 | -0,1376 | |||
| VRRM / Verra Mobility Corporation | 0,08 | 190,31 | 2,10 | 227,34 | 0,8519 | 0,5730 | |||
| KMT / Kennametal Inc. | 0,09 | 136,76 | 2,09 | 155,37 | 0,8512 | 0,4937 | |||
| DOV / Dover Corporation | 0,01 | 5,66 | 2,08 | 10,19 | 0,8446 | 0,0230 | |||
| ATO / Atmos Energy Corporation | 0,01 | 5,65 | 2,07 | 5,34 | 0,8418 | -0,0149 | |||
| GTES / Gates Industrial Corporation plc | 0,09 | 25,54 | 2,06 | 57,10 | 0,8367 | 0,2656 | |||
| TTWO / Take-Two Interactive Software, Inc. | 0,01 | 5,65 | 2,02 | 23,81 | 0,8227 | 0,1104 | |||
| BWA / BorgWarner Inc. | 0,06 | 5,66 | 2,01 | 23,45 | 0,8156 | 0,1075 | |||
| AVY / Avery Dennison Corporation | 0,01 | 22,65 | 1,99 | 20,97 | 0,8089 | 0,0919 | |||
| SCL / Stepan Company | 0,04 | 147,16 | 1,99 | 145,25 | 0,8087 | 0,4550 | |||
| HTLD / Heartland Express, Inc. | 0,23 | 22,94 | 1,97 | 15,20 | 0,8010 | 0,0557 | |||
| OGE / OGE Energy Corp. | 0,04 | 5,66 | 1,97 | 2,02 | 0,8007 | -0,0406 | |||
| AMP / Ameriprise Financial, Inc. | 0,00 | 5,65 | 1,97 | 16,46 | 0,7997 | 0,0637 | |||
| USFD / US Foods Holding Corp. | 0,03 | 5,65 | 1,96 | 24,29 | 0,7969 | 0,1097 | |||
| COLM / Columbia Sportswear Company | 0,03 | 28,13 | 1,95 | 3,44 | 0,7939 | -0,0291 | |||
| AZO / AutoZone, Inc. | 0,00 | -6,57 | 1,95 | -9,04 | 0,7937 | -0,1416 | |||
| RRX / Regal Rexnord Corporation | 0,01 | 35,99 | 1,95 | 73,16 | 0,7921 | 0,3018 | |||
| REG / Regency Centers Corporation | 0,03 | 15,54 | 1,94 | 11,61 | 0,7894 | 0,0311 | |||
| CNP / CenterPoint Energy, Inc. | 0,05 | -20,39 | 1,90 | -19,25 | 0,7825 | -0,2450 | |||
| GSBC / Great Southern Bancorp, Inc. | 0,03 | 9,68 | 1,86 | 16,45 | 0,7569 | 0,0601 | |||
| IFF / International Flavors & Fragrances Inc. | 0,03 | 5,65 | 1,86 | 0,11 | 0,7564 | -0,0534 | |||
| RF / Regions Financial Corporation | 0,08 | 5,65 | 1,86 | 14,40 | 0,7557 | 0,0474 | |||
| AVB / AvalonBay Communities, Inc. | 0,01 | 17,43 | 1,85 | 11,32 | 0,7518 | 0,0281 | |||
| PR / Permian Resources Corporation | 0,14 | 17,87 | 1,85 | 15,94 | 0,7509 | 0,0565 | |||
| ITT / ITT Inc. | 0,01 | 5,66 | 1,85 | 28,26 | 0,7509 | 0,1235 | |||
| RJF / Raymond James Financial, Inc. | 0,01 | 5,65 | 1,83 | 16,62 | 0,7445 | 0,0604 | |||
| CTRA / Coterra Energy Inc. | 0,07 | 39,28 | 1,82 | 22,33 | 0,7415 | 0,0917 | |||
| BR / Broadridge Financial Solutions, Inc. | 0,01 | 5,66 | 1,79 | 5,93 | 0,7264 | -0,0088 | |||
| LAD / Lithia Motors, Inc. | 0,01 | 21,16 | 1,78 | 39,43 | 0,7219 | 0,1669 | |||
| AGCO / AGCO Corporation | 0,02 | 5,66 | 1,77 | 17,72 | 0,7213 | 0,0647 | |||
| CBRE / CBRE Group, Inc. | 0,01 | 5,65 | 1,77 | 13,20 | 0,7185 | 0,0381 | |||
| XEL / Xcel Energy Inc. | 0,03 | -7,22 | 1,76 | -10,77 | 0,7173 | -0,1441 | |||
| COHU / Cohu, Inc. | 0,09 | 154,53 | 1,73 | 232,88 | 0,7037 | 0,4771 | |||
| KNX / Knight-Swift Transportation Holdings Inc. | 0,04 | 32,14 | 1,72 | 34,48 | 0,7008 | 0,1418 | |||
| CAG / Conagra Brands, Inc. | 0,08 | 5,65 | 1,72 | -18,92 | 0,7005 | -0,2254 | |||
| ATKR / Atkore Inc. | 0,02 | 1,71 | 0,7032 | 0,7032 | |||||
| MMS / Maximus, Inc. | 0,02 | -54,24 | 1,70 | -52,91 | 0,6917 | -0,8821 | |||
| STAG / STAG Industrial, Inc. | 0,05 | 5,65 | 1,70 | 6,11 | 0,6915 | -0,0070 | |||
| RSG / Republic Services, Inc. | 0,01 | -12,53 | 1,69 | -10,94 | 0,6851 | -0,1393 | |||
| BJ / BJ's Wholesale Club Holdings, Inc. | 0,02 | -18,91 | 1,68 | -23,38 | 0,6847 | -0,2731 | |||
| WY / Weyerhaeuser Company | 0,07 | 25,03 | 1,68 | 9,72 | 0,6839 | 0,0156 | |||
| HCKT / The Hackett Group, Inc. | 0,07 | -18,25 | 1,68 | -28,88 | 0,6838 | -0,3469 | |||
| MOH / Molina Healthcare, Inc. | 0,01 | 5,65 | 1,68 | -4,45 | 0,6811 | -0,0829 | |||
| STBA / S&T Bancorp, Inc. | 0,04 | -0,80 | 1,66 | 1,28 | 0,6745 | -0,0395 | |||
| WGO / Winnebago Industries, Inc. | 0,06 | 264,75 | 1,64 | 206,93 | 0,6665 | 0,4337 | |||
| VIAV / Viavi Solutions Inc. | 0,16 | 7,09 | 1,63 | -3,60 | 0,6638 | -0,0745 | |||
| HAS / Hasbro, Inc. | 0,02 | 5,66 | 1,62 | 26,88 | 0,6602 | 0,1023 | |||
| HLIT / Harmonic Inc. | 0,17 | 17,89 | 1,62 | 16,39 | 0,6584 | 0,0522 | |||
| EMN / Eastman Chemical Company | 0,02 | 1,61 | 0,6542 | 0,6542 | |||||
| ZBH / Zimmer Biomet Holdings, Inc. | 0,02 | 5,66 | 1,60 | -14,83 | 0,6513 | -0,1686 | |||
| OMC / Omnicom Group Inc. | 0,02 | 22,84 | 1,58 | 6,55 | 0,6413 | -0,0036 | |||
| WCC / WESCO International, Inc. | 0,01 | 1,56 | 0,6333 | 0,6333 | |||||
| PHM / PulteGroup, Inc. | 0,01 | 21,87 | 1,55 | 25,06 | 0,6310 | 0,0900 | |||
| CAC / Camden National Corporation | 0,04 | -18,04 | 1,55 | -17,85 | 0,6307 | -0,1919 | |||
| HUN / Huntsman Corporation | 0,15 | 296,73 | 1,55 | 161,93 | 0,6295 | 0,3718 | |||
| BKR / Baker Hughes Company | 0,04 | 5,66 | 1,53 | -7,87 | 0,6239 | -0,1017 | |||
| MBUU / Malibu Boats, Inc. | 0,05 | 82,57 | 1,52 | 86,58 | 0,6160 | 0,2620 | |||
| GPN / Global Payments Inc. | 0,02 | 5,66 | 1,43 | -13,65 | 0,5815 | -0,1402 | |||
| CPB / The Campbell's Company | 0,05 | 27,23 | 1,42 | -2,33 | 0,5792 | -0,0564 | |||
| TGNA / TEGNA Inc. | 0,08 | -6,47 | 1,35 | -13,99 | 0,5502 | -0,1353 | |||
| HCSG / Healthcare Services Group, Inc. | 0,09 | 36,92 | 1,35 | 104,24 | 0,5488 | 0,2607 | |||
| KWR / Quaker Chemical Corporation | 0,01 | 1,33 | 0,5476 | 0,5476 | |||||
| SLGN / Silgan Holdings Inc. | 0,02 | -59,80 | 1,30 | -57,42 | 0,5275 | -0,7997 | |||
| SKX / Skechers U.S.A., Inc. | 0,02 | 5,65 | 1,29 | 17,49 | 0,5302 | 0,0515 | |||
| MTX / Minerals Technologies Inc. | 0,02 | -9,76 | 1,20 | -21,88 | 0,4894 | -0,1816 | |||
| OEC / Orion S.A. | 0,11 | 149,78 | 1,20 | 102,71 | 0,4872 | 0,2295 | |||
| FHI / Federated Hermes, Inc. | 0,03 | 5,43 | 1,17 | 14,55 | 0,4771 | 0,0309 | |||
| BRC / Brady Corporation | 0,02 | 31,82 | 1,17 | 26,84 | 0,4766 | 0,0738 | |||
| CNMD / CONMED Corporation | 0,02 | -23,36 | 1,17 | -33,92 | 0,4754 | -0,2956 | |||
| CMCO / Columbus McKinnon Corporation | 0,07 | -13,84 | 1,13 | -22,29 | 0,4579 | -0,1737 | |||
| DHIL / Diamond Hill Investment Group, Inc. | 0,01 | -25,47 | 1,12 | -24,16 | 0,4570 | -0,1891 | |||
| SAFT / Safety Insurance Group, Inc. | 0,01 | -36,26 | 1,05 | -35,86 | 0,4271 | -0,2865 | |||
| EIG / Employers Holdings, Inc. | 0,02 | -54,18 | 1,02 | -57,33 | 0,4165 | -0,6293 | |||
| LEG / Leggett & Platt, Incorporated | 0,10 | -7,93 | 0,94 | 3,89 | 0,3802 | -0,0123 | |||
| JBSS / John B. Sanfilippo & Son, Inc. | 0,01 | -49,45 | 0,86 | -54,90 | 0,3480 | -0,4789 | |||
| MKSI / MKS Inc. | 0,01 | 0,70 | 0,2883 | 0,2883 | |||||
| CUZ / Cousins Properties Incorporated | 0,02 | -43,40 | 0,67 | -42,39 | 0,2724 | -0,2344 | |||
| FULT / Fulton Financial Corporation | 0,04 | -47,92 | 0,66 | -48,12 | 0,2695 | -0,2867 | |||
| SPB / Spectrum Brands Holdings, Inc. | 0,01 | -47,48 | 0,40 | -61,08 | 0,1635 | -0,2869 | |||
| SFNC / Simmons First National Corporation | 0,02 | -73,44 | 0,37 | -75,52 | 0,1491 | -0,5024 | |||
| FC / Franklin Covey Co. | 0,01 | -55,10 | 0,30 | -62,90 | 0,1228 | -0,2321 | |||
| SPTN / SpartanNash Company | 0,00 | -100,00 | 0,00 | 0,0000 | |||||
| AWR / American States Water Company | 0,00 | -100,00 | 0,00 | 0,0000 | |||||
| NWN / Northwest Natural Holding Company | 0,00 | -100,00 | 0,00 | 0,0000 | |||||
| POR / Portland General Electric Company | 0,00 | -100,00 | 0,00 | 0,0000 | |||||
| YUMC / Yum China Holdings, Inc. | 0,00 | -100,00 | 0,00 | 0,0000 | |||||
| ETR / Entergy Corporation | 0,00 | -100,00 | 0,00 | 0,0000 | |||||
| ATSG / Air Transport Services Group, Inc. | 0,00 | -100,00 | 0,00 | 0,0000 | |||||
| AVA / Avista Corporation | 0,00 | -100,00 | 0,00 | 0,0000 | |||||
| NWE / NorthWestern Energy Group, Inc. | 0,00 | -100,00 | 0,00 | 0,0000 | |||||
| GTY / Getty Realty Corp. | 0,00 | -100,00 | 0,00 | 0,0000 | |||||
| FDP / Fresh Del Monte Produce Inc. | 0,00 | -100,00 | 0,00 | 0,0000 | |||||
| SR / Spire Inc. | 0,00 | -100,00 | 0,00 | 0,0000 | |||||
| PDCO / Patterson Companies, Inc. | 0,00 | -100,00 | 0,00 | 0,0000 | |||||
| SAM / The Boston Beer Company, Inc. | 0,00 | -100,00 | 0,00 | 0,0000 | |||||
| OGS / ONE Gas, Inc. | 0,00 | -100,00 | 0,00 | 0,0000 | |||||
| CASY / Casey's General Stores, Inc. | 0,00 | -100,00 | 0,00 | 0,0000 |