Statistiques de base
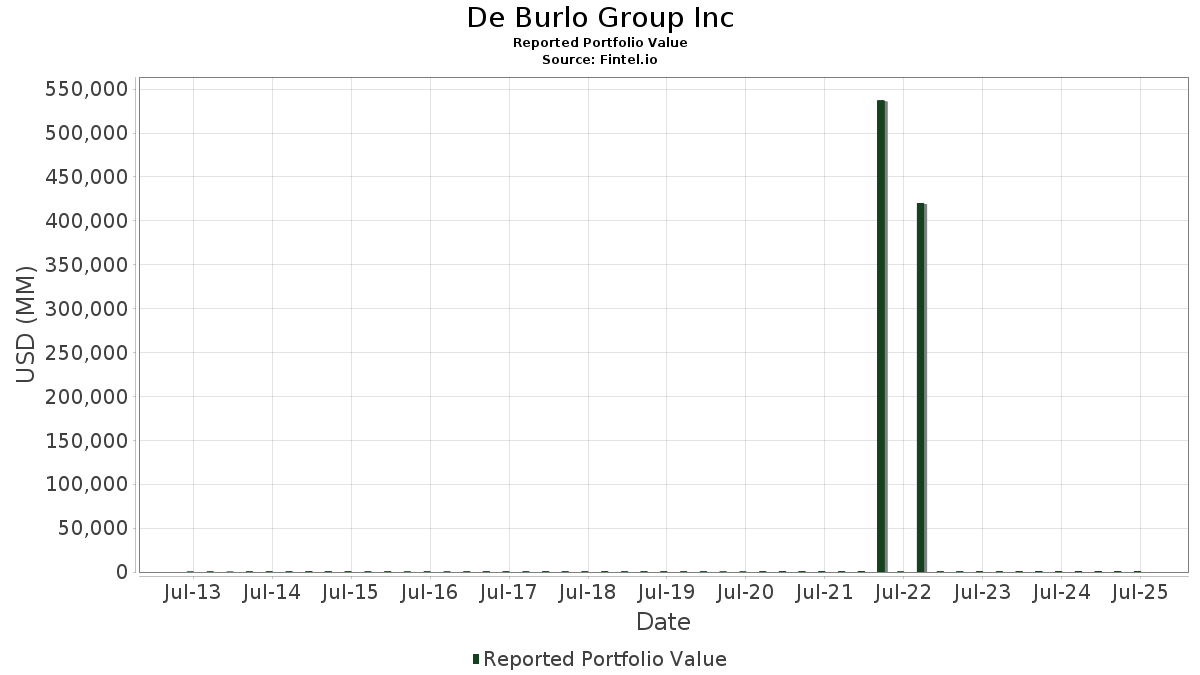
| Valeur du portefeuille | $ 759 083 048 |
| Positions actuelles | 80 |
Dernières positions, performances, ASG (à partir des dépôts 13F, 13D)
De Burlo Group Inc a déclaré un total de 80 positions dans ses derniers dépôts auprès de la SEC. La valeur la plus récente du portefeuille est calculée à 759 083 048 USD. Les actifs sous gestion réels (ASG) sont cette valeur plus les liquidités (qui ne sont pas divulguées). Les principales positions de De Burlo Group Inc sont Microsoft Corporation (US:MSFT) , Meta Platforms, Inc. (US:META) , Netflix, Inc. (US:NFLX) , Amazon.com, Inc. (US:AMZN) , and Broadcom Inc. (US:AVGO) . Les nouvelles positions de De Burlo Group Inc incluent MercadoLibre, Inc. (US:MELI) , iShares Trust - iShares MSCI India ETF (US:INDA) , .
Meilleures augmentations ce trimestre
Nous utilisons la variation de l'allocation du portefeuille car il s'agit de l'indicateur le plus significatif. Les changements peuvent être dus à des transactions ou à des variations de prix des actions.
| Titre | Actions (en millions) |
Valeur ($ en millions) |
% du portefeuille | ΔPortefeuille % |
|---|---|---|---|---|
| 0,21 | 32,61 | 4,2964 | 4,2964 | |
| 0,09 | 42,68 | 5,6222 | 2,3058 | |
| 0,03 | 37,99 | 5,0042 | 1,7204 | |
| 0,08 | 24,15 | 3,1811 | 1,6932 | |
| 0,00 | 12,81 | 1,6871 | 1,6871 | |
| 0,35 | 20,96 | 2,7616 | 1,5106 | |
| 0,01 | 10,83 | 1,4263 | 1,4263 | |
| 0,04 | 10,82 | 1,4249 | 1,4249 | |
| 0,12 | 32,78 | 4,3179 | 1,1945 | |
| 0,07 | 12,16 | 1,6022 | 0,8395 |
Principales baisses ce trimestre
Nous utilisons la variation de l'allocation du portefeuille car il s'agit de l'indicateur le plus significatif. Les changements peuvent être dus à des transactions ou à des variations de prix des actions.
| Titre | Actions (en millions) |
Valeur ($ en millions) |
% du portefeuille | ΔPortefeuille % |
|---|---|---|---|---|
| 0,15 | 18,16 | 2,3923 | -1,7931 | |
| 0,33 | 29,61 | 3,9005 | -1,7848 | |
| 0,03 | 4,91 | 0,6470 | -1,4271 | |
| 0,10 | 6,92 | 0,9122 | -1,3759 | |
| 0,06 | 27,49 | 3,6218 | -1,3633 | |
| 0,03 | 22,24 | 2,9296 | -0,9953 | |
| 0,14 | 28,42 | 3,7433 | -0,9221 | |
| 0,15 | 17,35 | 2,2859 | -0,9158 | |
| 0,17 | 36,56 | 4,8158 | -0,8231 | |
| 0,06 | 9,72 | 1,2799 | -0,7539 |
Déclarations 13F et dépôts de fonds
Ce formulaire a été déposé le 2025-08-13 pour la période de déclaration 2025-06-30. Cliquez sur l'icône du lien pour voir l'historique complet des transactions.
Mettre à niveau pour débloquer les données premium et exporter vers Excel ![]() .
.
| Titre | Type | Prix moyen de l'action | Actions (en millions) |
ΔActions (%) |
ΔActions (%) |
Valeur ($ en millions) |
Portefeuille (%) |
ΔPortefeuille (%) |
|
|---|---|---|---|---|---|---|---|---|---|
| MSFT / Microsoft Corporation | 0,09 | 43,38 | 42,68 | 90,00 | 5,6222 | 2,3058 | |||
| META / Meta Platforms, Inc. | 0,05 | 0,08 | 38,56 | 28,16 | 5,0795 | 0,6377 | |||
| NFLX / Netflix, Inc. | 0,03 | 18,93 | 37,99 | 70,79 | 5,0042 | 1,7204 | |||
| AMZN / Amazon.com, Inc. | 0,17 | -17,00 | 36,56 | -4,29 | 4,8158 | -0,8231 | |||
| AVGO / Broadcom Inc. | 0,12 | -5,90 | 32,78 | 54,93 | 4,3179 | 1,1945 | |||
| NVDA / NVIDIA Corporation | 0,21 | 32,61 | 4,2964 | 4,2964 | |||||
| ASML / ASML Holding N.V. - Depositary Receipt (Common Stock) | 0,04 | 13,65 | 31,75 | 37,46 | 4,1828 | 0,7725 | |||
| ORLY / O'Reilly Automotive, Inc. | 0,33 | 1 122,10 | 29,61 | -23,11 | 3,9005 | -1,7848 | |||
| AAPL / Apple Inc. | 0,14 | -2,65 | 28,42 | -10,08 | 3,7433 | -0,9221 | |||
| BRK.B / Berkshire Hathaway Inc. | 0,06 | -10,73 | 27,49 | -18,58 | 3,6218 | -1,3633 | |||
| ADSK / Autodesk, Inc. | 0,08 | 102,63 | 24,15 | 139,62 | 3,1811 | 1,6932 | |||
| LLY / Eli Lilly and Company | 0,03 | -11,37 | 22,24 | -16,35 | 2,9296 | -0,9953 | |||
| VRTX / Vertex Pharmaceuticals Incorporated | 0,05 | 0,06 | 21,71 | -8,11 | 2,8601 | -0,6283 | |||
| IEMG / iShares, Inc. - iShares Core MSCI Emerging Markets ETF | 0,35 | 122,42 | 20,96 | 147,40 | 2,7616 | 1,5106 | |||
| GS / The Goldman Sachs Group, Inc. | 0,03 | -31,62 | 19,75 | -11,41 | 2,6013 | -0,6894 | |||
| COST / Costco Wholesale Corporation | 0,02 | 0,37 | 19,55 | 5,06 | 2,5754 | -0,1719 | |||
| BKNG / Booking Holdings Inc. | 0,00 | 9,77 | 19,51 | 37,94 | 2,5702 | 0,4821 | |||
| ISRG / Intuitive Surgical, Inc. | 0,04 | 0,00 | 19,51 | 9,72 | 2,5700 | -0,0551 | |||
| KKR / KKR & Co. Inc. | 0,14 | -19,06 | 18,98 | -6,86 | 2,5008 | -0,5084 | |||
| MU / Micron Technology, Inc. | 0,15 | -54,84 | 18,16 | -35,94 | 2,3923 | -1,7931 | |||
| TT / Trane Technologies plc | 0,04 | 0,00 | 17,91 | 29,83 | 2,3597 | 0,3227 | |||
| BABA / Alibaba Group Holding Limited - Depositary Receipt (Common Stock) | 0,15 | -6,71 | 17,35 | -19,99 | 2,2859 | -0,9158 | |||
| MELI / MercadoLibre, Inc. | 0,00 | 12,81 | 1,6871 | 1,6871 | |||||
| GOOGL / Alphabet Inc. | 0,07 | 106,57 | 12,16 | 135,42 | 1,6022 | 0,8395 | |||
| MCK / McKesson Corporation | 0,01 | 10,83 | 1,4263 | 1,4263 | |||||
| RSG / Republic Services, Inc. | 0,04 | 10,82 | 1,4249 | 1,4249 | |||||
| GWW / W.W. Grainger, Inc. | 0,01 | 76,58 | 9,88 | 85,96 | 1,3019 | 0,5172 | |||
| BX / Blackstone Inc. | 0,06 | -34,09 | 9,72 | -29,47 | 1,2799 | -0,7539 | |||
| V / Visa Inc. | 0,02 | -2,08 | 8,28 | -0,79 | 1,0911 | -0,1415 | |||
| MA / Mastercard Incorporated | 0,01 | -2,55 | 7,73 | -0,10 | 1,0180 | -0,1240 | |||
| SWK / Stanley Black & Decker, Inc. | 0,10 | -49,30 | 6,92 | -55,32 | 0,9122 | -1,3759 | |||
| IR / Ingersoll Rand Inc. | 0,08 | -23,32 | 6,75 | -20,31 | 0,8898 | -0,3615 | |||
| ONON / On Holding AG | 0,13 | -36,06 | 6,64 | -24,22 | 0,8743 | -0,4187 | |||
| ABBV / AbbVie Inc. | 0,03 | -2,69 | 4,99 | -13,81 | 0,6572 | -0,1972 | |||
| AMD / Advanced Micro Devices, Inc. | 0,03 | -74,69 | 4,91 | -65,04 | 0,6470 | -1,4271 | |||
| ETN / Eaton Corporation plc | 0,01 | -32,94 | 4,87 | -11,94 | 0,6415 | -0,1748 | |||
| AMP / Ameriprise Financial, Inc. | 0,01 | 0,00 | 4,58 | 10,25 | 0,6040 | -0,0100 | |||
| NOW / ServiceNow, Inc. | 0,00 | -26,27 | 4,47 | -4,79 | 0,5892 | -0,1043 | |||
| DHR / Danaher Corporation | 0,02 | -1,80 | 4,37 | -5,35 | 0,5754 | -0,1061 | |||
| TMO / Thermo Fisher Scientific Inc. | 0,01 | -1,97 | 4,33 | -20,12 | 0,5707 | -0,2300 | |||
| CRM / Salesforce, Inc. | 0,01 | -9,55 | 3,60 | -8,08 | 0,4749 | -0,1041 | |||
| ADBE / Adobe Inc. | 0,01 | -3,94 | 3,49 | -3,11 | 0,4597 | -0,0720 | |||
| INDA / iShares Trust - iShares MSCI India ETF | 0,05 | 3,01 | 0,3961 | 0,3961 | |||||
| JPM / JPMorgan Chase & Co. | 0,01 | -1,35 | 2,76 | 16,58 | 0,3631 | 0,0141 | |||
| CHD / Church & Dwight Co., Inc. | 0,03 | -2,22 | 2,76 | -14,62 | 0,3631 | -0,1136 | |||
| AMT / American Tower Corporation | 0,01 | -3,48 | 2,45 | -1,96 | 0,3232 | -0,0463 | |||
| INTU / Intuit Inc. | 0,00 | -1,94 | 2,39 | 25,80 | 0,3154 | 0,0344 | |||
| PG / The Procter & Gamble Company | 0,01 | -2,80 | 2,36 | -9,14 | 0,3103 | -0,0724 | |||
| PANW / Palo Alto Networks, Inc. | 0,01 | -2,85 | 2,19 | 16,46 | 0,2890 | 0,0110 | |||
| EW / Edwards Lifesciences Corporation | 0,02 | 0,62 | 1,48 | 8,59 | 0,1949 | -0,0063 | |||
| ANET / Arista Networks Inc | 0,01 | -0,72 | 1,41 | 31,05 | 0,1864 | 0,0271 | |||
| MASI / Masimo Corporation | 0,01 | -3,57 | 1,36 | -2,64 | 0,1795 | -0,0271 | |||
| SYK / Stryker Corporation | 0,00 | -6,22 | 1,19 | -0,25 | 0,1573 | -0,0196 | |||
| ABT / Abbott Laboratories | 0,01 | -1,74 | 1,15 | 0,70 | 0,1520 | -0,0171 | |||
| MAS / Masco Corporation | 0,02 | -7,77 | 1,15 | -14,68 | 0,1509 | -0,0472 | |||
| AWK / American Water Works Company, Inc. | 0,01 | 0,00 | 0,99 | -5,73 | 0,1303 | -0,0245 | |||
| ADP / Automatic Data Processing, Inc. | 0,00 | 0,00 | 0,89 | 0,91 | 0,1173 | -0,0129 | |||
| ATO / Atmos Energy Corporation | 0,01 | -18,60 | 0,83 | -18,78 | 0,1088 | -0,0415 | |||
| AZN / AstraZeneca PLC - Depositary Receipt (Common Stock) | 0,01 | -8,04 | 0,81 | -12,59 | 0,1070 | -0,0302 | |||
| STE / STERIS plc | 0,00 | -0,90 | 0,80 | 5,01 | 0,1051 | -0,0070 | |||
| SHW / The Sherwin-Williams Company | 0,00 | 0,00 | 0,75 | -1,71 | 0,0984 | -0,0137 | |||
| RGA / Reinsurance Group of America, Incorporated | 0,00 | 0,00 | 0,68 | 0,74 | 0,0893 | -0,0100 | |||
| GILD / Gilead Sciences, Inc. | 0,01 | -14,10 | 0,67 | -15,04 | 0,0886 | -0,0282 | |||
| GIS / General Mills, Inc. | 0,01 | 0,00 | 0,61 | -13,33 | 0,0805 | -0,0236 | |||
| NBIX / Neurocrine Biosciences, Inc. | 0,00 | -1,06 | 0,59 | 12,48 | 0,0773 | 0,0003 | |||
| CI / The Cigna Group | 0,00 | -8,76 | 0,58 | -8,36 | 0,0766 | -0,0171 | |||
| HD / The Home Depot, Inc. | 0,00 | -16,31 | 0,56 | -16,20 | 0,0743 | -0,0252 | |||
| BLD / TopBuild Corp. | 0,00 | -6,42 | 0,56 | -0,71 | 0,0740 | -0,0095 | |||
| ECL / Ecolab Inc. | 0,00 | -2,50 | 0,53 | 3,55 | 0,0692 | -0,0056 | |||
| VLTO / Veralto Corporation | 0,00 | -3,12 | 0,44 | 0,23 | 0,0582 | -0,0068 | |||
| LIN / Linde plc | 0,00 | 0,00 | 0,38 | 0,79 | 0,0507 | -0,0057 | |||
| LPLA / LPL Financial Holdings Inc. | 0,00 | 0,00 | 0,37 | 14,37 | 0,0494 | 0,0011 | |||
| FSLR / First Solar, Inc. | 0,00 | 0,00 | 0,33 | 31,35 | 0,0436 | 0,0063 | |||
| NEE / NextEra Energy, Inc. | 0,00 | 0,00 | 0,31 | -2,19 | 0,0412 | -0,0059 | |||
| ITW / Illinois Tool Works Inc. | 0,00 | 0,09 | 0,29 | -0,35 | 0,0379 | -0,0047 | |||
| FI / Fiserv, Inc. | 0,00 | 0,00 | 0,27 | -22,03 | 0,0355 | -0,0155 | |||
| UNP / Union Pacific Corporation | 0,00 | 0,00 | 0,22 | -2,64 | 0,0292 | -0,0044 | |||
| JNJ / Johnson & Johnson | 0,00 | 0,00 | 0,20 | -8,14 | 0,0268 | -0,0058 | |||
| BAC / Bank of America Corporation | 0,00 | 0,20 | 0,0265 | 0,0265 | |||||
| IART / Integra LifeSciences Holdings Corporation | 0,01 | 0,00 | 0,18 | -44,34 | 0,0234 | -0,0236 | |||
| UNH / UnitedHealth Group Incorporated | 0,00 | -100,00 | 0,00 | -100,00 | -0,5490 | ||||
| IWM / iShares Trust - iShares Russell 2000 ETF | 0,00 | -100,00 | 0,00 | 0,0000 | |||||
| KRE / SPDR Series Trust - SPDR S&P Regional Banking ETF | 0,00 | -100,00 | 0,00 | 0,0000 |