Statistiques de base
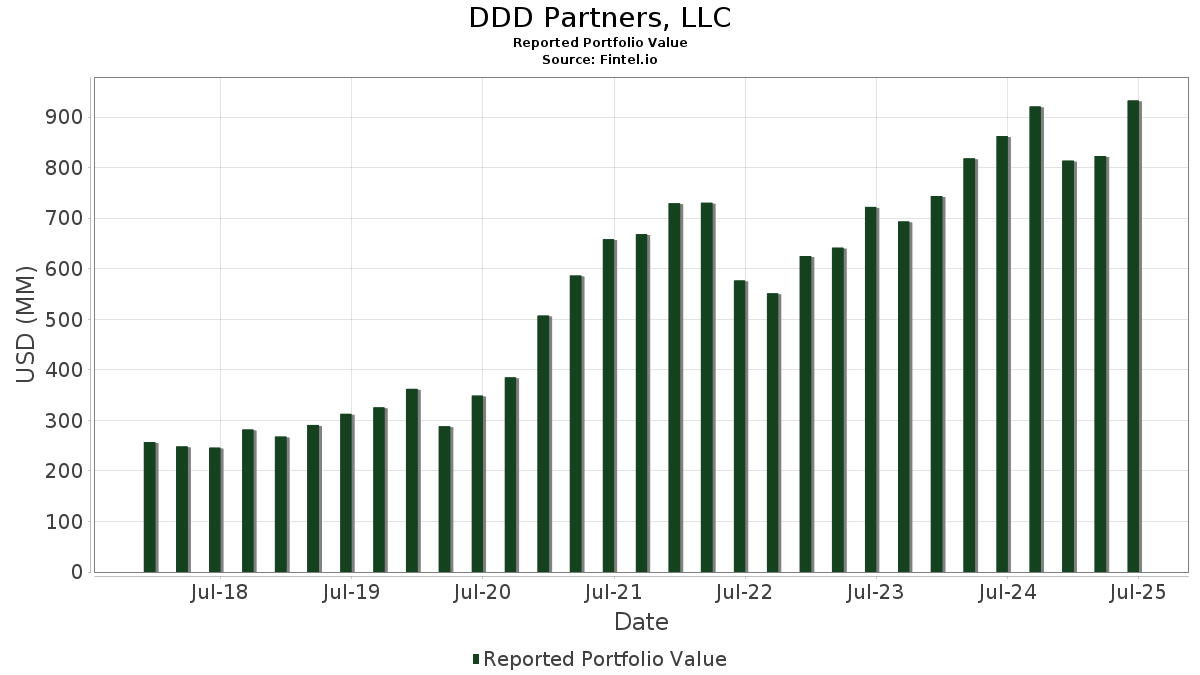
| Valeur du portefeuille | $ 932 736 427 |
| Positions actuelles | 112 |
Dernières positions, performances, ASG (à partir des dépôts 13F, 13D)
DDD Partners, LLC a déclaré un total de 112 positions dans ses derniers dépôts auprès de la SEC. La valeur la plus récente du portefeuille est calculée à 932 736 427 USD. Les actifs sous gestion réels (ASG) sont cette valeur plus les liquidités (qui ne sont pas divulguées). Les principales positions de DDD Partners, LLC sont Microsoft Corporation (US:MSFT) , Berkshire Hathaway Inc. (US:BRK.A) , Amazon.com, Inc. (US:AMZN) , Apple Inc. (US:AAPL) , and Schwab Strategic Trust - Schwab U.S. Dividend Equity ETF (US:SCHD) . Les nouvelles positions de DDD Partners, LLC incluent Abbott Laboratories (US:ABT) , Hubbell Incorporated (US:HUBB) , Regeneron Pharmaceuticals, Inc. (US:REGN) , Thermo Fisher Scientific Inc. (US:TMO) , and UnitedHealth Group Incorporated (US:UNH) . Les principales industries de DDD Partners, LLC sont "Restaurants, Dining, Eating And Drinking Places" (sic 58) , "Transportation Equipment" (sic 37) , and "Security And Commodity Brokers, Dealers, Exchanges, And Services" (sic 62) .
Meilleures augmentations ce trimestre
Nous utilisons la variation de l'allocation du portefeuille car il s'agit de l'indicateur le plus significatif. Les changements peuvent être dus à des transactions ou à des variations de prix des actions.
| Titre | Actions (en millions) |
Valeur ($ en millions) |
% du portefeuille | ΔPortefeuille % |
|---|---|---|---|---|
| 0,18 | 90,49 | 9,7017 | 3,5091 | |
| 1,20 | 31,69 | 3,3980 | 3,2903 | |
| 0,05 | 18,01 | 1,9309 | 1,8950 | |
| 0,13 | 17,12 | 1,8355 | 1,8355 | |
| 0,03 | 13,22 | 1,4175 | 1,4175 | |
| 0,11 | 29,97 | 3,2126 | 1,3111 | |
| 0,06 | 11,97 | 1,2835 | 1,2835 | |
| 0,02 | 10,76 | 1,1536 | 1,1536 | |
| 0,01 | 10,44 | 1,1189 | 1,0717 | |
| 0,02 | 9,64 | 1,0336 | 1,0336 |
Principales baisses ce trimestre
Nous utilisons la variation de l'allocation du portefeuille car il s'agit de l'indicateur le plus significatif. Les changements peuvent être dus à des transactions ou à des variations de prix des actions.
| Titre | Actions (en millions) |
Valeur ($ en millions) |
% du portefeuille | ΔPortefeuille % |
|---|---|---|---|---|
| 0,03 | 0,38 | 0,0409 | -2,0927 | |
| 0,14 | 67,49 | 7,2357 | -1,2347 | |
| 0,13 | 19,92 | 2,1362 | -0,7909 | |
| 0,07 | 20,50 | 2,1976 | -0,7897 | |
| 0,16 | 32,28 | 3,4613 | -0,7445 | |
| 0,11 | 19,80 | 2,1230 | -0,7414 | |
| 0,55 | 21,21 | 2,2740 | -0,6831 | |
| 0,58 | 20,68 | 2,2176 | -0,6572 | |
| 0,22 | 20,18 | 2,1630 | -0,6475 | |
| 0,15 | 22,09 | 2,3682 | -0,4422 |
Déclarations 13D/G
Il s'agit d'une liste des déclarations 13D et 13G déposées au cours de la dernière année (le cas échéant). Cliquez sur l'icône du lien pour voir l'historique complet des transactions. Les lignes vertes indiquent de nouvelles positions. Les lignes rouges indiquent des positions fermées.
| Date de dépôt | Formulaire | Titre | Actions précédentes |
Actions actuelles |
ΔActions % | % de participation |
% ΔParticipation | |
|---|---|---|---|---|---|---|---|---|
| 2025-01-15 | RELL / Richardson Electronics, Ltd. | 686 167 | 1 161 625 | 69,29 | 9,40 | 67,86 |
Déclarations 13F et dépôts de fonds
Ce formulaire a été déposé le 2025-07-31 pour la période de déclaration 2025-06-30. Cliquez sur l'icône du lien pour voir l'historique complet des transactions.
Mettre à niveau pour débloquer les données premium et exporter vers Excel ![]() .
.
| Titre | Type | Prix moyen de l'action | Actions (en millions) |
ΔActions (%) |
ΔActions (%) |
Valeur ($ en millions) |
Portefeuille (%) |
ΔPortefeuille (%) |
|
|---|---|---|---|---|---|---|---|---|---|
| MSFT / Microsoft Corporation | 0,18 | 33,99 | 90,49 | 77,54 | 9,7017 | 3,5091 | |||
| BRK.A / Berkshire Hathaway Inc. | 0,14 | 6,13 | 67,49 | -3,19 | 7,2357 | -1,2347 | |||
| AMZN / Amazon.com, Inc. | 0,17 | 1,45 | 38,19 | 16,98 | 4,0941 | 0,1280 | |||
| AAPL / Apple Inc. | 0,16 | 0,97 | 32,28 | -6,74 | 3,4613 | -0,7445 | |||
| SCHD / Schwab Strategic Trust - Schwab U.S. Dividend Equity ETF | 1,20 | 3 673,01 | 31,69 | 3 477,20 | 3,3980 | 3,2903 | |||
| AVGO / Broadcom Inc. | 0,11 | 16,30 | 29,97 | 91,47 | 3,2126 | 1,3111 | |||
| COST / Costco Wholesale Corporation | 0,03 | 0,11 | 25,58 | 4,79 | 2,7424 | -0,2234 | |||
| CSCO / Cisco Systems, Inc. | 0,36 | 2,72 | 25,02 | 15,49 | 2,6826 | 0,0502 | |||
| QCOM / QUALCOMM Incorporated | 0,15 | 29,50 | 24,60 | 34,26 | 2,6369 | 0,4112 | |||
| ELAN / Elanco Animal Health Incorporated | 1,64 | 10,14 | 23,48 | 49,80 | 2,5176 | 0,6130 | |||
| CMI / Cummins Inc. | 0,07 | 21,02 | 23,47 | 26,45 | 2,5160 | 0,2611 | |||
| CVX / Chevron Corporation | 0,15 | 11,57 | 22,09 | -4,50 | 2,3682 | -0,4422 | |||
| UPS / United Parcel Service, Inc. | 0,22 | 15,99 | 21,78 | 6,45 | 2,3355 | -0,1510 | |||
| ORI / Old Republic International Corporation | 0,55 | -11,08 | 21,21 | -12,85 | 2,2740 | -0,6831 | |||
| LYB / LyondellBasell Industries N.V. | 0,36 | 27,53 | 21,07 | 4,82 | 2,2588 | -0,1834 | |||
| CMCSA / Comcast Corporation | 0,58 | -9,62 | 20,68 | -12,59 | 2,2176 | -0,6572 | |||
| CB / Chubb Limited | 0,07 | -13,10 | 20,50 | -16,63 | 2,1976 | -0,7897 | |||
| SO / The Southern Company | 0,22 | -12,67 | 20,18 | -12,78 | 2,1630 | -0,6475 | |||
| JNJ / Johnson & Johnson | 0,13 | -10,21 | 19,92 | -17,30 | 2,1362 | -0,7909 | |||
| ABBV / AbbVie Inc. | 0,11 | -5,19 | 19,80 | -16,01 | 2,1230 | -0,7414 | |||
| GOOG / Alphabet Inc. | 0,11 | 2,37 | 19,16 | 16,24 | 2,0545 | 0,0514 | |||
| NWPX / NWPX Infrastructure, Inc. | 0,45 | -0,28 | 18,34 | -0,98 | 1,9665 | -0,2841 | |||
| NVDD / Direxion Shares ETF Trust - Direxion Daily NVDA Bear 1X Shares | 0,11 | 9,17 | 18,07 | 59,15 | 1,9373 | 0,5578 | |||
| HD / The Home Depot, Inc. | 0,05 | 6 002,11 | 18,01 | 6 025,85 | 1,9309 | 1,8950 | |||
| ABT / Abbott Laboratories | 0,13 | 17,12 | 1,8355 | 1,8355 | |||||
| DINO / HF Sinclair Corporation | 0,41 | -21,51 | 16,64 | -1,93 | 1,7839 | -0,2775 | |||
| HUBB / Hubbell Incorporated | 0,03 | 13,22 | 1,4175 | 1,4175 | |||||
| CVS / CVS Health Corporation | 0,18 | 2,50 | 12,76 | 4,37 | 1,3679 | -0,1174 | |||
| CTRA / Coterra Energy Inc. | 0,49 | 2,34 | 12,44 | -10,13 | 1,3336 | -0,3480 | |||
| RTX / RTX Corporation | 0,08 | 2,99 | 11,98 | 13,53 | 1,2849 | 0,0024 | |||
| TXN / Texas Instruments Incorporated | 0,06 | 11,97 | 1,2835 | 1,2835 | |||||
| RELL / Richardson Electronics, Ltd. | 1,14 | -0,95 | 11,01 | -14,36 | 1,1801 | -0,3813 | |||
| REGN / Regeneron Pharmaceuticals, Inc. | 0,02 | 10,76 | 1,1536 | 1,1536 | |||||
| HII / Huntington Ingalls Industries, Inc. | 0,04 | 35,44 | 10,69 | 60,28 | 1,1465 | 0,3359 | |||
| NOW / ServiceNow, Inc. | 0,01 | 1 980,12 | 10,44 | 2 589,69 | 1,1189 | 1,0717 | |||
| TMO / Thermo Fisher Scientific Inc. | 0,02 | 9,64 | 1,0336 | 1,0336 | |||||
| CIEN / Ciena Corporation | 0,11 | 2,41 | 9,20 | 37,82 | 0,9865 | 0,1754 | |||
| VGSH / Vanguard Scottsdale Funds - Vanguard Short-Term Treasury ETF | 0,13 | -2,73 | 7,89 | -2,58 | 0,8456 | -0,1381 | |||
| UNH / UnitedHealth Group Incorporated | 0,02 | 7,11 | 0,7621 | 0,7621 | |||||
| VCSH / Vanguard Scottsdale Funds - Vanguard Short-Term Corporate Bond ETF | 0,08 | -2,75 | 6,12 | -2,06 | 0,6567 | -0,1031 | |||
| VSDA / Victory Portfolios II - VictoryShares Dividend Accelerator ETF | 0,10 | 2,73 | 5,22 | 2,96 | 0,5595 | -0,0563 | |||
| UBER / Uber Technologies, Inc. | 0,05 | 128,58 | 4,75 | 192,72 | 0,5088 | 0,3118 | |||
| SPY / SPDR S&P 500 ETF | 0,01 | 1,65 | 4,67 | 12,29 | 0,5006 | -0,0047 | |||
| SYM / Symbotic Inc. | 0,12 | 139,38 | 4,47 | 360,35 | 0,4793 | 0,3613 | |||
| IEF / iShares Trust - iShares 7-10 Year Treasury Bond ETF | 0,04 | -2,65 | 4,12 | -2,25 | 0,4422 | -0,0704 | |||
| SCHV / Schwab Strategic Trust - Schwab U.S. Large-Cap Value ETF | 0,13 | 1,87 | 3,65 | 6,05 | 0,3911 | -0,0268 | |||
| RACE / Ferrari N.V. | 0,01 | 0,00 | 3,18 | 14,69 | 0,3406 | 0,0041 | |||
| EXPD / Expeditors International of Washington, Inc. | 0,02 | 0,10 | 2,74 | -4,92 | 0,2943 | -0,0564 | |||
| META / Meta Platforms, Inc. | 0,00 | -6,32 | 2,51 | 19,94 | 0,2696 | 0,0149 | |||
| TWLO / Twilio Inc. | 0,02 | 2,30 | 0,2465 | 0,2465 | |||||
| OXY / Occidental Petroleum Corporation | 0,05 | 275,02 | 2,30 | 219,19 | 0,2461 | 0,1587 | |||
| XLK / The Select Sector SPDR Trust - The Technology Select Sector SPDR Fund | 0,01 | 1,02 | 2,25 | 23,86 | 0,2416 | 0,0206 | |||
| VFLO / Victory Portfolios II - VictoryShares Free Cash Flow ETF | 0,06 | 1,84 | 2,15 | 5,03 | 0,2307 | -0,0183 | |||
| XLC / The Select Sector SPDR Trust - The Communication Services Select Sector SPDR Fund | 0,02 | 1,88 | 2,13 | 14,66 | 0,2282 | 0,0026 | |||
| ADBE / Adobe Inc. | 0,01 | 1,97 | 0,2112 | 0,2112 | |||||
| TSLA / Tesla, Inc. | 0,01 | 5,67 | 1,72 | 29,55 | 0,1848 | 0,0231 | |||
| SNOW / Snowflake Inc. | 0,01 | -0,38 | 1,63 | 52,63 | 0,1744 | 0,0448 | |||
| IVV / iShares Trust - iShares Core S&P 500 ETF | 0,00 | -0,62 | 1,59 | 9,79 | 0,1707 | -0,0055 | |||
| RBOT / Vicarious Surgical Inc. | 0,21 | -3,12 | 1,55 | 10,77 | 0,1666 | -0,0039 | |||
| V / Visa Inc. | 0,00 | -0,05 | 1,29 | 1,25 | 0,1386 | -0,0165 | |||
| FNDF / Schwab Strategic Trust - Schwab Fundamental International Equity ETF | 0,03 | 1,83 | 1,21 | 12,80 | 0,1294 | -0,0006 | |||
| FNDA / Schwab Strategic Trust - Schwab Fundamental U.S. Small Company ETF | 0,04 | 1,86 | 1,15 | 6,56 | 0,1238 | -0,0079 | |||
| XOM / Exxon Mobil Corporation | 0,01 | 19,88 | 0,88 | 8,64 | 0,0944 | -0,0041 | |||
| ARKG / ARK ETF Trust - ARK Genomic Revolution ETF | 0,04 | 1,12 | 0,88 | 18,76 | 0,0944 | 0,0042 | |||
| RPD / Rapid7, Inc. | 0,04 | 0,85 | 0,0907 | 0,0907 | |||||
| FLME / Flame Acquisition Corp. | 0,04 | 0,80 | 0,0858 | 0,0858 | |||||
| RYAM / Rayonier Advanced Materials Inc. | 0,20 | 0,00 | 0,77 | -33,04 | 0,0826 | -0,0572 | |||
| CNR / Core Natural Resources, Inc. | 0,01 | 0,77 | 0,0823 | 0,0823 | |||||
| BA / The Boeing Company | 0,00 | 0,91 | 0,72 | 23,88 | 0,0768 | 0,0066 | |||
| IBIT / iShares Bitcoin Trust ETF | 0,01 | -5,21 | 0,69 | 24,01 | 0,0742 | 0,0064 | |||
| GOOGL / Alphabet Inc. | 0,00 | 3,15 | 0,67 | 17,37 | 0,0718 | 0,0026 | |||
| MCO / Moody's Corporation | 0,00 | -0,84 | 0,65 | 6,72 | 0,0699 | -0,0043 | |||
| QQQ / Invesco QQQ Trust, Series 1 | 0,00 | 0,00 | 0,62 | 17,78 | 0,0661 | 0,0024 | |||
| GWW / W.W. Grainger, Inc. | 0,00 | 0,00 | 0,61 | 5,36 | 0,0654 | -0,0050 | |||
| VTV / Vanguard Index Funds - Vanguard Value ETF | 0,00 | -1,66 | 0,61 | 0,66 | 0,0650 | -0,0082 | |||
| ETN / Eaton Corporation plc | 0,00 | 0,43 | 0,59 | 32,06 | 0,0632 | 0,0089 | |||
| VTI / Vanguard Index Funds - Vanguard Total Stock Market ETF | 0,00 | 134,20 | 0,57 | 158,82 | 0,0614 | 0,0345 | |||
| CRWD / CrowdStrike Holdings, Inc. | 0,00 | -8,45 | 0,55 | 32,28 | 0,0585 | 0,0084 | |||
| CPRT / Copart, Inc. | 0,01 | 0,88 | 0,53 | -12,46 | 0,0565 | -0,0167 | |||
| SBUX / Starbucks Corporation | 0,01 | 0,59 | 0,52 | -6,02 | 0,0553 | -0,0114 | |||
| ETHA / iShares Ethereum Trust - iShares Ethereum Trust ETF | 0,03 | 117,09 | 0,50 | 200,00 | 0,0538 | 0,0334 | |||
| MP / MP Materials Corp. | 0,01 | 4,10 | 0,48 | 41,84 | 0,0513 | 0,0103 | |||
| VUG / Vanguard Index Funds - Vanguard Growth ETF | 0,00 | 0,00 | 0,46 | 18,18 | 0,0488 | 0,0020 | |||
| SCHX / Schwab Strategic Trust - Schwab U.S. Large-Cap ETF | 0,02 | -3,11 | 0,45 | 7,43 | 0,0481 | -0,0027 | |||
| IJH / iShares Trust - iShares Core S&P Mid-Cap ETF | 0,01 | 0,03 | 0,44 | 6,49 | 0,0475 | -0,0031 | |||
| DFCF / Dimensional ETF Trust - Dimensional Core Fixed Income ETF | 0,01 | 0,44 | 0,0475 | 0,0475 | |||||
| JPM / JPMorgan Chase & Co. | 0,00 | 1,72 | 0,43 | 20,28 | 0,0459 | 0,0026 | |||
| DE / Deere & Company | 0,00 | 0,73 | 0,42 | 9,35 | 0,0451 | -0,0017 | |||
| XLV / The Select Sector SPDR Trust - The Health Care Select Sector SPDR Fund | 0,00 | 0,00 | 0,42 | -7,49 | 0,0450 | -0,0102 | |||
| ENVX / Enovix Corporation | 0,04 | 26,27 | 0,41 | 78,26 | 0,0440 | 0,0160 | |||
| INMD / InMode Ltd. | 0,03 | -97,33 | 0,38 | -97,83 | 0,0409 | -2,0927 | |||
| ISRG / Intuitive Surgical, Inc. | 0,00 | 1,25 | 0,35 | 11,36 | 0,0379 | -0,0008 | |||
| IWY / iShares Trust - iShares Russell Top 200 Growth ETF | 0,00 | 0,00 | 0,35 | 16,84 | 0,0373 | 0,0011 | |||
| LOW / Lowe's Companies, Inc. | 0,00 | 0,26 | 0,34 | -4,53 | 0,0361 | -0,0068 | |||
| IJR / iShares Trust - iShares Core S&P Small-Cap ETF | 0,00 | 0,00 | 0,32 | 4,53 | 0,0347 | -0,0029 | |||
| VOO / Vanguard Index Funds - Vanguard S&P 500 ETF | 0,00 | 40,20 | 0,32 | 55,39 | 0,0340 | 0,0091 | |||
| DVN / Devon Energy Corporation | 0,01 | 6,72 | 0,32 | -9,22 | 0,0338 | -0,0084 | |||
| ACHR / Archer Aviation Inc. | 0,03 | 0,28 | 0,0302 | 0,0302 | |||||
| BAC / Bank of America Corporation | 0,01 | -4,04 | 0,28 | 8,63 | 0,0298 | -0,0012 | |||
| RMD / ResMed Inc. | 0,00 | 0,19 | 0,27 | 15,61 | 0,0294 | 0,0005 | |||
| ABNB / Airbnb, Inc. | 0,00 | 3,87 | 0,27 | 15,38 | 0,0290 | 0,0004 | |||
| IAU / iShares Gold Trust | 0,00 | 0,24 | 0,0256 | 0,0256 | |||||
| ATRO / Astronics Corporation | 0,01 | 0,24 | 0,0255 | 0,0255 | |||||
| DHR / Danaher Corporation | 0,00 | -0,93 | 0,23 | -4,53 | 0,0249 | -0,0047 | |||
| NFLX / Netflix, Inc. | 0,00 | 0,22 | 0,0238 | 0,0238 | |||||
| OEF / iShares Trust - iShares S&P 100 ETF | 0,00 | 0,22 | 0,0233 | 0,0233 | |||||
| MCK / McKesson Corporation | 0,00 | 0,21 | 0,0228 | 0,0228 | |||||
| DIA / SPDR Dow Jones Industrial Average ETF Trust | 0,00 | 0,21 | 0,0227 | 0,0227 | |||||
| EBGEF / Enbridge Inc. - Preferred Stock | 0,00 | 0,21 | 0,0221 | 0,0221 | |||||
| CLIR / ClearSign Technologies Corporation | 0,12 | 0,00 | 0,06 | -29,07 | 0,0066 | -0,0039 | |||
| DSX / Diana Shipping Inc. | 0,03 | 0,00 | 0,05 | -6,25 | 0,0049 | -0,0010 | |||
| MVIS / MicroVision, Inc. | 0,02 | 0,00 | 0,03 | -7,14 | 0,0029 | -0,0007 | |||
| GIS / General Mills, Inc. | 0,00 | -100,00 | 0,00 | 0,0000 | |||||
| GTLS / Chart Industries, Inc. | 0,00 | -100,00 | 0,00 | 0,0000 | |||||
| ARLO / Arlo Technologies, Inc. | 0,00 | -100,00 | 0,00 | 0,0000 | |||||
| PFE / Pfizer Inc. | 0,00 | -100,00 | 0,00 | 0,0000 | |||||
| AGNC / AGNC Investment Corp. | 0,00 | -100,00 | 0,00 | 0,0000 | |||||
| GMAB / Genmab A/S - Depositary Receipt (Common Stock) | 0,00 | -100,00 | 0,00 | 0,0000 | |||||
| ON / ON Semiconductor Corporation | 0,00 | -100,00 | 0,00 | 0,0000 | |||||
| TGT / Target Corporation | 0,00 | -100,00 | 0,00 | 0,0000 | |||||
| ENPH / Enphase Energy, Inc. | 0,00 | -100,00 | 0,00 | 0,0000 | |||||
| MDT / Medtronic plc | 0,00 | -100,00 | 0,00 | 0,0000 |