Statistiques de base
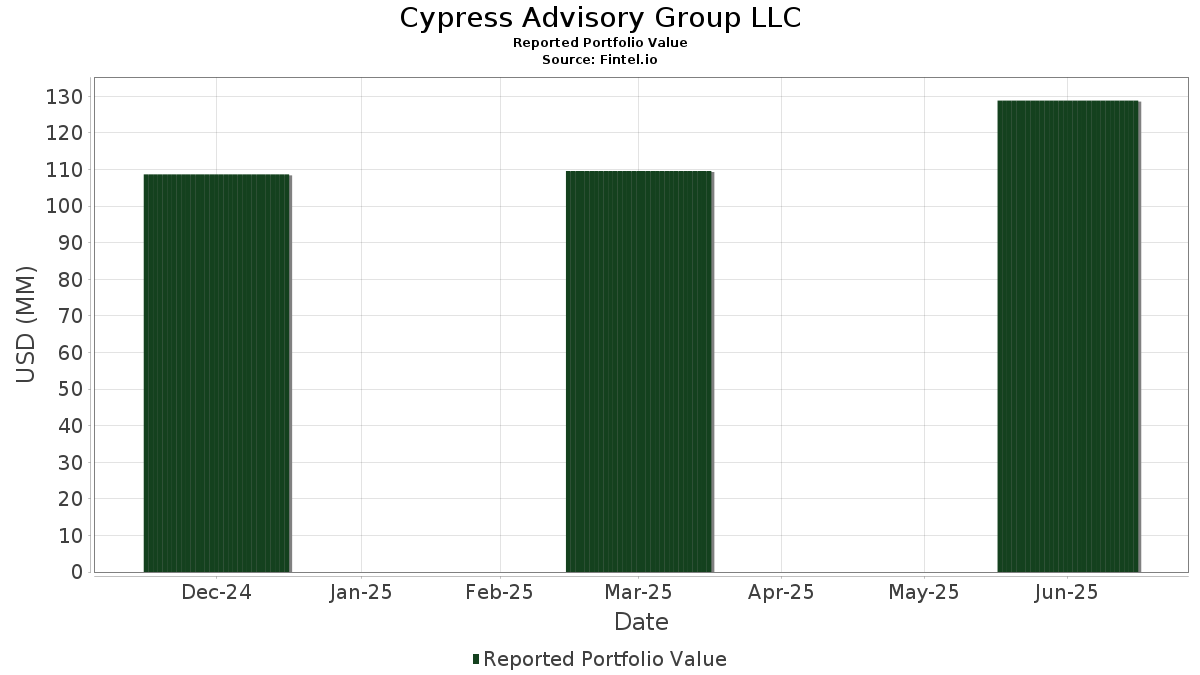
| Valeur du portefeuille | $ 128 853 367 |
| Positions actuelles | 67 |
Dernières positions, performances, ASG (à partir des dépôts 13F, 13D)
Cypress Advisory Group LLC a déclaré un total de 67 positions dans ses derniers dépôts auprès de la SEC. La valeur la plus récente du portefeuille est calculée à 128 853 367 USD. Les actifs sous gestion réels (ASG) sont cette valeur plus les liquidités (qui ne sont pas divulguées). Les principales positions de Cypress Advisory Group LLC sont iShares Trust - iShares Short Treasury Bond ETF (US:SHV) , Microsoft Corporation (US:MSFT) , SPDR Series Trust - SPDR Bloomberg 1-3 Month T-Bill ETF (US:BIL) , Berkshire Hathaway Inc. (US:BRK.A) , and The TJX Companies, Inc. (US:TJX) . Les nouvelles positions de Cypress Advisory Group LLC incluent SPDR Series Trust - SPDR Bloomberg 1-3 Month T-Bill ETF (US:BIL) , Mettler-Toledo International Inc. (US:MTD) , Carlisle Companies Incorporated (US:CSL) , TE Connectivity plc (US:TEL) , and IDEX Corporation (US:IEX) .
Meilleures augmentations ce trimestre
Nous utilisons la variation de l'allocation du portefeuille car il s'agit de l'indicateur le plus significatif. Les changements peuvent être dus à des transactions ou à des variations de prix des actions.
| Titre | Actions (en millions) |
Valeur ($ en millions) |
% du portefeuille | ΔPortefeuille % |
|---|---|---|---|---|
| 0,08 | 7,56 | 5,8699 | 5,8699 | |
| 0,00 | 0,95 | 0,7375 | 0,7375 | |
| 0,02 | 1,71 | 1,3243 | 0,6864 | |
| 0,02 | 7,87 | 6,1062 | 0,6314 | |
| 0,00 | 1,20 | 0,9322 | 0,6234 | |
| 0,00 | 0,76 | 0,5932 | 0,5932 | |
| 0,00 | 0,75 | 0,5819 | 0,5819 | |
| 0,00 | 0,72 | 0,5570 | 0,5570 | |
| 0,01 | 2,14 | 1,6591 | 0,4955 | |
| 0,00 | 0,76 | 0,5860 | 0,3977 |
Principales baisses ce trimestre
Nous utilisons la variation de l'allocation du portefeuille car il s'agit de l'indicateur le plus significatif. Les changements peuvent être dus à des transactions ou à des variations de prix des actions.
| Titre | Actions (en millions) |
Valeur ($ en millions) |
% du portefeuille | ΔPortefeuille % |
|---|---|---|---|---|
| 0,21 | 23,25 | 18,0414 | -4,7709 | |
| 0,01 | 5,64 | 4,3739 | -1,2758 | |
| 0,00 | 0,93 | 0,7200 | -0,8970 | |
| 0,03 | 4,27 | 3,3171 | -0,6209 | |
| 0,01 | 2,85 | 2,2146 | -0,6096 | |
| 0,00 | 1,63 | 1,2665 | -0,4918 | |
| 0,03 | 3,46 | 2,6835 | -0,4806 | |
| 0,01 | 3,10 | 2,4028 | -0,4462 | |
| 0,00 | 0,00 | -0,3831 | ||
| 0,01 | 3,03 | 2,3532 | -0,3824 |
Déclarations 13F et dépôts de fonds
Ce formulaire a été déposé le 2025-08-11 pour la période de déclaration 2025-06-30. Cliquez sur l'icône du lien pour voir l'historique complet des transactions.
Mettre à niveau pour débloquer les données premium et exporter vers Excel ![]() .
.
| Titre | Type | Prix moyen de l'action | Actions (en millions) |
ΔActions (%) |
ΔActions (%) |
Valeur ($ en millions) |
Portefeuille (%) |
ΔPortefeuille (%) |
|
|---|---|---|---|---|---|---|---|---|---|
| SHV / iShares Trust - iShares Short Treasury Bond ETF | 0,21 | -6,99 | 23,25 | -7,03 | 18,0414 | -4,7709 | |||
| MSFT / Microsoft Corporation | 0,02 | -1,04 | 7,87 | 31,13 | 6,1062 | 0,6314 | |||
| BIL / SPDR Series Trust - SPDR Bloomberg 1-3 Month T-Bill ETF | 0,08 | 7,56 | 5,8699 | 5,8699 | |||||
| BRK.A / Berkshire Hathaway Inc. | 0,01 | -0,22 | 5,64 | -9,00 | 4,3739 | -1,2758 | |||
| TJX / The TJX Companies, Inc. | 0,03 | -2,33 | 4,27 | -0,97 | 3,3171 | -0,6209 | |||
| ROST / Ross Stores, Inc. | 0,03 | -0,13 | 3,46 | -0,29 | 2,6835 | -0,4806 | |||
| ALLE / Allegion plc | 0,02 | 22,83 | 3,17 | 35,69 | 2,4581 | 0,3284 | |||
| V / Visa Inc. | 0,01 | -2,13 | 3,10 | -0,83 | 2,4028 | -0,4462 | |||
| LMT / Lockheed Martin Corporation | 0,01 | -2,46 | 3,03 | 1,13 | 2,3532 | -0,3824 | |||
| ACN / Accenture plc | 0,01 | 38,30 | 3,01 | 32,48 | 2,3335 | 0,2627 | |||
| AAPL / Apple Inc. | 0,01 | -0,20 | 2,85 | -7,82 | 2,2146 | -0,6096 | |||
| CMI / Cummins Inc. | 0,01 | -0,80 | 2,85 | 3,68 | 2,2112 | -0,2968 | |||
| HSY / The Hershey Company | 0,02 | 2,26 | 2,51 | -0,75 | 1,9441 | -0,3593 | |||
| XPRO / Expro Group Holdings N.V. | 0,01 | 25,64 | 2,34 | -1,89 | 1,8130 | -0,3599 | |||
| ROK / Rockwell Automation, Inc. | 0,01 | 30,39 | 2,14 | 67,61 | 1,6591 | 0,4955 | |||
| AME / AMETEK, Inc. | 0,01 | 39,82 | 2,06 | 47,00 | 1,5954 | 0,3193 | |||
| SHY / iShares Trust - iShares 1-3 Year Treasury Bond ETF | 0,02 | 0,00 | 1,94 | 0,16 | 1,5035 | -0,2613 | |||
| CSCO / Cisco Systems, Inc. | 0,03 | -1,26 | 1,84 | 11,02 | 1,4312 | -0,0845 | |||
| WRB / W. R. Berkley Corporation | 0,02 | 0,00 | 1,83 | 3,27 | 1,4203 | -0,1969 | |||
| GOOGL / Alphabet Inc. | 0,01 | -0,29 | 1,82 | 13,64 | 1,4101 | -0,0488 | |||
| SAP / SAP SE - Depositary Receipt (Common Stock) | 0,01 | 0,00 | 1,74 | 13,30 | 1,3495 | -0,0510 | |||
| APH / Amphenol Corporation | 0,02 | 62,10 | 1,71 | 144,06 | 1,3243 | 0,6864 | |||
| CI / The Cigna Group | 0,01 | -0,19 | 1,70 | 0,29 | 1,3205 | -0,2275 | |||
| CHKP / Check Point Software Technologies Ltd. | 0,01 | -0,20 | 1,70 | -3,09 | 1,3165 | -0,2810 | |||
| NOC / Northrop Grumman Corporation | 0,00 | -13,28 | 1,63 | -15,36 | 1,2665 | -0,4918 | |||
| MA / Mastercard Incorporated | 0,00 | 27,41 | 1,56 | 30,68 | 1,2102 | 0,1210 | |||
| AMZN / Amazon.com, Inc. | 0,01 | -2,31 | 1,48 | 12,61 | 1,1505 | -0,0502 | |||
| MSI / Motorola Solutions, Inc. | 0,00 | 0,00 | 1,42 | -3,93 | 1,1013 | -0,2468 | |||
| ELV / Elevance Health, Inc. | 0,00 | -0,80 | 1,36 | -11,25 | 1,0532 | -0,3425 | |||
| ADBE / Adobe Inc. | 0,00 | 85,79 | 1,32 | 87,59 | 1,0208 | 0,3805 | |||
| A / Agilent Technologies, Inc. | 0,01 | 63,21 | 1,27 | 64,77 | 0,9873 | 0,2823 | |||
| ULTA / Ulta Beauty, Inc. | 0,00 | -7,75 | 1,23 | 17,79 | 0,9509 | 0,0014 | |||
| NDSN / Nordson Corporation | 0,01 | 89,29 | 1,22 | 101,32 | 0,9470 | 0,3935 | |||
| WST / West Pharmaceutical Services, Inc. | 0,01 | 58,57 | 1,21 | 55,00 | 0,9383 | 0,2265 | |||
| FIX / Comfort Systems USA, Inc. | 0,00 | 113,33 | 1,20 | 255,33 | 0,9322 | 0,6234 | |||
| NKE / NIKE, Inc. | 0,02 | 22,47 | 1,16 | 37,07 | 0,9016 | 0,1282 | |||
| PH / Parker-Hannifin Corporation | 0,00 | 0,00 | 1,12 | 14,93 | 0,8727 | -0,0202 | |||
| DHR / Danaher Corporation | 0,01 | 83,81 | 1,09 | 77,32 | 0,8440 | 0,2838 | |||
| AOS / A. O. Smith Corporation | 0,02 | 53,27 | 1,08 | 53,79 | 0,8346 | 0,1965 | |||
| MTD / Mettler-Toledo International Inc. | 0,00 | 0,95 | 0,7375 | 0,7375 | |||||
| GD / General Dynamics Corporation | 0,00 | -1,41 | 0,94 | 5,53 | 0,7259 | -0,0831 | |||
| UNH / UnitedHealth Group Incorporated | 0,00 | -12,12 | 0,93 | -47,69 | 0,7200 | -0,8970 | |||
| WAT / Waters Corporation | 0,00 | -0,38 | 0,92 | -5,63 | 0,7157 | -0,1761 | |||
| COST / Costco Wholesale Corporation | 0,00 | 0,00 | 0,88 | 4,66 | 0,6799 | -0,0837 | |||
| WMT / Walmart Inc. | 0,01 | -0,56 | 0,88 | 10,76 | 0,6792 | -0,0417 | |||
| TMO / Thermo Fisher Scientific Inc. | 0,00 | 209,26 | 0,80 | 152,53 | 0,6199 | 0,3307 | |||
| JNJ / Johnson & Johnson | 0,01 | -3,54 | 0,78 | -11,09 | 0,6038 | -0,1950 | |||
| CSL / Carlisle Companies Incorporated | 0,00 | 0,76 | 0,5932 | 0,5932 | |||||
| CRM / Salesforce, Inc. | 0,00 | 260,08 | 0,76 | 266,50 | 0,5860 | 0,3977 | |||
| TEL / TE Connectivity plc | 0,00 | 0,75 | 0,5819 | 0,5819 | |||||
| IEX / IDEX Corporation | 0,00 | 0,72 | 0,5570 | 0,5570 | |||||
| ICLR / ICON Public Limited Company | 0,00 | 15,36 | 0,64 | -4,02 | 0,5001 | -0,1130 | |||
| FTV / Fortive Corporation | 0,01 | -0,21 | 0,61 | -28,94 | 0,4772 | -0,3120 | |||
| CPRT / Copart, Inc. | 0,01 | 207,38 | 0,60 | 166,81 | 0,4682 | 0,2617 | |||
| KEYS / Keysight Technologies, Inc. | 0,00 | -0,59 | 0,55 | 8,73 | 0,4260 | -0,0345 | |||
| GOOG / Alphabet Inc. | 0,00 | -5,46 | 0,49 | 7,44 | 0,3813 | -0,0363 | |||
| LFUS / Littelfuse, Inc. | 0,00 | -32,97 | 0,41 | -22,85 | 0,3202 | -0,1671 | |||
| SGOL / abrdn Gold ETF Trust - abrdn Physical Gold Shares ETF | 0,01 | -2,28 | 0,41 | 3,57 | 0,3151 | -0,0433 | |||
| PRU / Prudential Financial, Inc. | 0,00 | 0,00 | 0,32 | -3,88 | 0,2501 | -0,0555 | |||
| VRSN / VeriSign, Inc. | 0,00 | -1,71 | 0,30 | 11,61 | 0,2320 | -0,0119 | |||
| CHRW / C.H. Robinson Worldwide, Inc. | 0,00 | 0,00 | 0,29 | -6,45 | 0,2256 | -0,0575 | |||
| OTIS / Otis Worldwide Corporation | 0,00 | -1,72 | 0,28 | -5,69 | 0,2190 | -0,0540 | |||
| NXPI / NXP Semiconductors N.V. | 0,00 | -61,07 | 0,28 | -55,31 | 0,2162 | -0,3517 | |||
| ADSK / Autodesk, Inc. | 0,00 | 0,00 | 0,24 | 18,32 | 0,1862 | 0,0011 | |||
| GGG / Graco Inc. | 0,00 | 0,23 | 0,1805 | 0,1805 | |||||
| NVO / Novo Nordisk A/S - Depositary Receipt (Common Stock) | 0,00 | 0,00 | 0,23 | -0,87 | 0,1768 | -0,0323 | |||
| RAL / Ralliant Corporation | 0,00 | 0,21 | 0,1615 | 0,1615 | |||||
| FND / Floor & Decor Holdings, Inc. | 0,00 | -100,00 | 0,00 | -100,00 | -0,3831 |