Statistiques de base
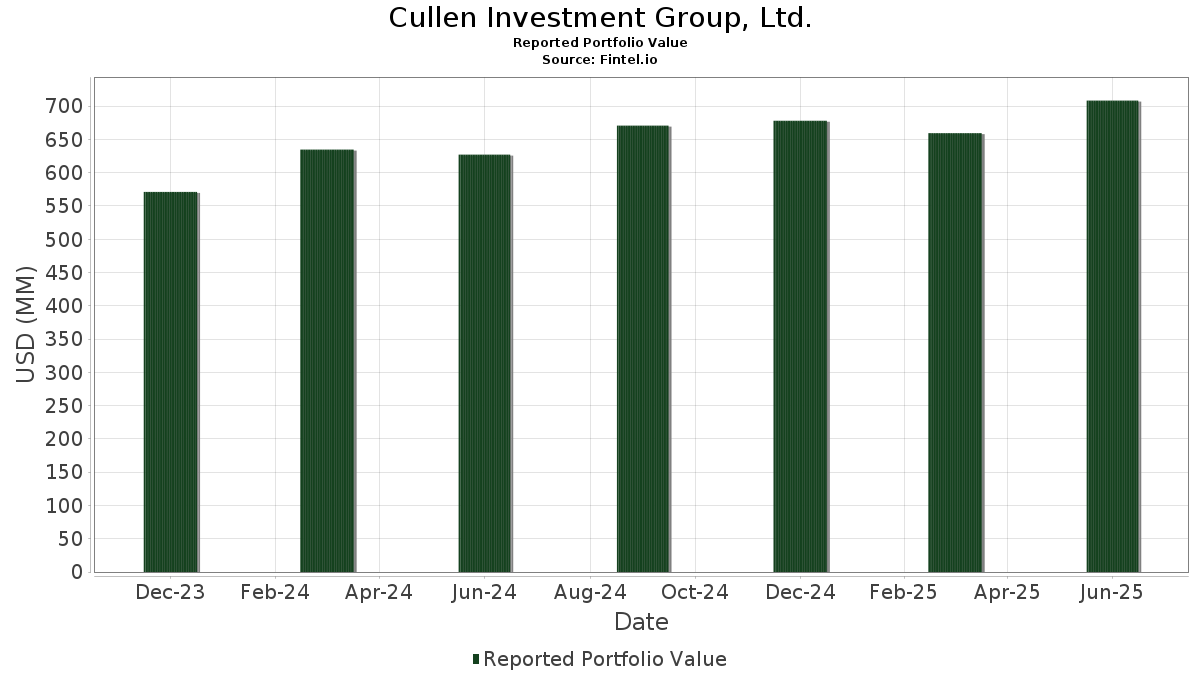
| Valeur du portefeuille | $ 708 315 948 |
| Positions actuelles | 177 |
Dernières positions, performances, ASG (à partir des dépôts 13F, 13D)
Cullen Investment Group, Ltd. a déclaré un total de 177 positions dans ses derniers dépôts auprès de la SEC. La valeur la plus récente du portefeuille est calculée à 708 315 948 USD. Les actifs sous gestion réels (ASG) sont cette valeur plus les liquidités (qui ne sont pas divulguées). Les principales positions de Cullen Investment Group, Ltd. sont Berkshire Hathaway Inc. (US:BRK.B) , Microsoft Corporation (US:MSFT) , Apple Inc. (US:AAPL) , Walmart Inc. (US:WMT) , and JPMorgan Chase & Co. (US:JPM) . Les nouvelles positions de Cullen Investment Group, Ltd. incluent Credo Technology Group Holding Ltd (US:CRDO) , Tractor Supply Company (US:TSCO) , Invesco QQQ Trust, Series 1 (US:QQQ) , Vicor Corporation (US:VICR) , and The Travelers Companies, Inc. (US:TRV) .
Meilleures augmentations ce trimestre
Nous utilisons la variation de l'allocation du portefeuille car il s'agit de l'indicateur le plus significatif. Les changements peuvent être dus à des transactions ou à des variations de prix des actions.
| Titre | Actions (en millions) |
Valeur ($ en millions) |
% du portefeuille | ΔPortefeuille % |
|---|---|---|---|---|
| 0,09 | 44,08 | 6,2227 | 1,2170 | |
| 0,08 | 23,20 | 3,2756 | 1,2095 | |
| 0,07 | 26,15 | 3,6923 | 0,7326 | |
| 0,08 | 10,05 | 1,4186 | 0,6856 | |
| 0,11 | 17,76 | 2,5078 | 0,6647 | |
| 0,10 | 30,00 | 4,2350 | 0,4518 | |
| 0,09 | 9,84 | 1,3889 | 0,3219 | |
| 0,03 | 11,71 | 1,6527 | 0,2694 | |
| 0,33 | 32,02 | 4,5206 | 0,1913 | |
| 0,02 | 3,29 | 0,4646 | 0,1599 |
Principales baisses ce trimestre
Nous utilisons la variation de l'allocation du portefeuille car il s'agit de l'indicateur le plus significatif. Les changements peuvent être dus à des transactions ou à des variations de prix des actions.
| Titre | Actions (en millions) |
Valeur ($ en millions) |
% du portefeuille | ΔPortefeuille % |
|---|---|---|---|---|
| 0,10 | 47,32 | 6,6804 | -1,1900 | |
| 0,21 | 43,41 | 6,1289 | -0,9778 | |
| 0,03 | 4,31 | 0,6088 | -0,2450 | |
| 0,08 | 7,61 | 1,0740 | -0,2409 | |
| 0,01 | 1,76 | 0,2478 | -0,2129 | |
| 0,01 | 9,75 | 1,3759 | -0,2115 | |
| 0,26 | 8,13 | 1,1474 | -0,2105 | |
| 0,00 | 0,49 | 0,0689 | -0,1960 | |
| 0,03 | 10,13 | 1,4308 | -0,1660 | |
| 0,00 | 0,21 | 0,0294 | -0,1623 |
Déclarations 13F et dépôts de fonds
Ce formulaire a été déposé le 2025-07-01 pour la période de déclaration 2025-06-30. Cliquez sur l'icône du lien pour voir l'historique complet des transactions.
Mettre à niveau pour débloquer les données premium et exporter vers Excel ![]() .
.
| Titre | Type | Prix moyen de l'action | Actions (en millions) |
ΔActions (%) |
ΔActions (%) |
Valeur ($ en millions) |
Portefeuille (%) |
ΔPortefeuille (%) |
|
|---|---|---|---|---|---|---|---|---|---|
| BRK.B / Berkshire Hathaway Inc. | 0,10 | -0,03 | 47,32 | -8,82 | 6,6804 | -1,1900 | |||
| MSFT / Microsoft Corporation | 0,09 | 0,78 | 44,08 | 33,54 | 6,2227 | 1,2170 | |||
| AAPL / Apple Inc. | 0,21 | 0,30 | 43,41 | -7,36 | 6,1289 | -0,9778 | |||
| WMT / Walmart Inc. | 0,33 | 0,71 | 32,02 | 12,17 | 4,5206 | 0,1913 | |||
| JPM / JPMorgan Chase & Co. | 0,10 | 1,75 | 30,00 | 20,25 | 4,2350 | 0,4518 | |||
| ETN / Eaton Corporation plc | 0,07 | 2,04 | 26,15 | 34,01 | 3,6923 | 0,7326 | |||
| AVGO / Broadcom Inc. | 0,08 | 3,45 | 23,20 | 70,31 | 3,2756 | 1,2095 | |||
| NVDA / NVIDIA Corporation | 0,11 | 0,27 | 17,76 | 46,17 | 2,5078 | 0,6647 | |||
| GOOG / Alphabet Inc. | 0,09 | -0,98 | 16,69 | 12,43 | 2,3568 | 0,1049 | |||
| AMZN / Amazon.com, Inc. | 0,06 | 1,56 | 12,55 | 17,12 | 1,7717 | 0,1466 | |||
| DE / Deere & Company | 0,02 | -3,96 | 12,28 | 4,04 | 1,7339 | -0,0563 | |||
| UNP / Union Pacific Corporation | 0,05 | 3,87 | 11,90 | 1,16 | 1,6803 | -0,1040 | |||
| TT / Trane Technologies plc | 0,03 | -1,14 | 11,71 | 28,36 | 1,6527 | 0,2694 | |||
| XOM / Exxon Mobil Corporation | 0,10 | 9,29 | 11,29 | -0,94 | 1,5946 | -0,1345 | |||
| MSI / Motorola Solutions, Inc. | 0,03 | 7,94 | 10,65 | 3,66 | 1,5031 | -0,0545 | |||
| V / Visa Inc. | 0,03 | -4,99 | 10,13 | -3,74 | 1,4308 | -0,1660 | |||
| PEP / PepsiCo, Inc. | 0,08 | 136,07 | 10,05 | 107,90 | 1,4186 | 0,6856 | |||
| JCI / Johnson Controls International plc | 0,09 | 6,05 | 9,84 | 39,83 | 1,3889 | 0,3219 | |||
| LLY / Eli Lilly and Company | 0,01 | -1,35 | 9,75 | -6,90 | 1,3759 | -0,2115 | |||
| MRK / Merck & Co., Inc. | 0,12 | 9,29 | 9,53 | -3,62 | 1,3459 | -0,1541 | |||
| CMCSA / Comcast Corporation | 0,26 | 0,49 | 9,12 | -2,80 | 1,2876 | -0,1355 | |||
| CME / CME Group Inc. | 0,03 | 9,08 | 8,26 | 13,33 | 1,1665 | 0,0608 | |||
| EPD / Enterprise Products Partners L.P. - Limited Partnership | 0,26 | -0,07 | 8,13 | -9,23 | 1,1474 | -0,2105 | |||
| VZ / Verizon Communications Inc. | 0,18 | 3,08 | 7,67 | -1,67 | 1,0822 | -0,1001 | |||
| SBUX / Starbucks Corporation | 0,08 | -6,07 | 7,61 | -12,25 | 1,0740 | -0,2409 | |||
| DRI / Darden Restaurants, Inc. | 0,03 | 5,86 | 7,54 | 11,05 | 1,0639 | 0,0349 | |||
| MDT / Medtronic plc | 0,09 | 7,24 | 7,49 | 4,03 | 1,0574 | -0,0345 | |||
| SO / The Southern Company | 0,08 | 16,37 | 7,29 | 16,21 | 1,0293 | 0,0779 | |||
| UPS / United Parcel Service, Inc. | 0,07 | 19,06 | 7,24 | 9,26 | 1,0228 | 0,0172 | |||
| HD / The Home Depot, Inc. | 0,02 | 4,66 | 6,57 | 4,70 | 0,9272 | -0,0241 | |||
| GRMN / Garmin Ltd. | 0,03 | -1,01 | 6,47 | -4,84 | 0,9132 | -0,1177 | |||
| ADI / Analog Devices, Inc. | 0,03 | 8,61 | 6,09 | 28,19 | 0,8604 | 0,1394 | |||
| META / Meta Platforms, Inc. | 0,01 | -0,13 | 6,01 | 27,91 | 0,8484 | 0,1358 | |||
| DIS / The Walt Disney Company | 0,04 | 3,12 | 5,49 | 29,58 | 0,7755 | 0,1326 | |||
| O / Realty Income Corporation | 0,09 | 18,08 | 5,42 | 17,28 | 0,7656 | 0,0643 | |||
| PEG / Public Service Enterprise Group Incorporated | 0,06 | 19,42 | 5,41 | 22,16 | 0,7644 | 0,0921 | |||
| LOW / Lowe's Companies, Inc. | 0,02 | -3,48 | 5,41 | -8,19 | 0,7640 | -0,1299 | |||
| BBY / Best Buy Co., Inc. | 0,08 | 6,93 | 5,19 | -2,48 | 0,7326 | -0,0744 | |||
| CMI / Cummins Inc. | 0,02 | -1,59 | 5,14 | 2,82 | 0,7255 | -0,0324 | |||
| UNH / UnitedHealth Group Incorporated | 0,02 | 45,48 | 4,80 | -13,35 | 0,6772 | -0,1622 | |||
| FIS / Fidelity National Information Services, Inc. | 0,06 | 10,43 | 4,76 | 20,39 | 0,6720 | 0,0723 | |||
| SYK / Stryker Corporation | 0,01 | -1,01 | 4,75 | 5,21 | 0,6699 | -0,0141 | |||
| MKC / McCormick & Company, Incorporated | 0,06 | -5,65 | 4,59 | -13,09 | 0,6480 | -0,1529 | |||
| JNJ / Johnson & Johnson | 0,03 | -16,84 | 4,31 | -23,40 | 0,6088 | -0,2450 | |||
| PG / The Procter & Gamble Company | 0,03 | -5,30 | 4,20 | -11,46 | 0,5931 | -0,1265 | |||
| RJF / Raymond James Financial, Inc. | 0,03 | -0,72 | 4,10 | 9,62 | 0,5793 | 0,0116 | |||
| BLK / BlackRock, Inc. | 0,00 | -2,94 | 3,99 | 7,61 | 0,5634 | 0,0010 | |||
| POOL / Pool Corporation | 0,01 | 7,33 | 3,99 | -1,73 | 0,5628 | -0,0524 | |||
| CRM / Salesforce, Inc. | 0,01 | -3,30 | 3,97 | -1,73 | 0,5604 | -0,0523 | |||
| MA / Mastercard Incorporated | 0,01 | -9,25 | 3,86 | -6,97 | 0,5447 | -0,0842 | |||
| GLW / Corning Incorporated | 0,07 | -2,95 | 3,79 | 11,48 | 0,5348 | 0,0195 | |||
| IQV / IQVIA Holdings Inc. | 0,02 | 21,45 | 3,73 | 8,56 | 0,5262 | 0,0055 | |||
| AXP / American Express Company | 0,01 | -2,68 | 3,60 | 15,37 | 0,5077 | 0,0350 | |||
| CAT / Caterpillar Inc. | 0,01 | 0,23 | 3,38 | 17,97 | 0,4774 | 0,0427 | |||
| CVX / Chevron Corporation | 0,02 | -3,11 | 3,35 | -17,06 | 0,4736 | -0,1399 | |||
| AMD / Advanced Micro Devices, Inc. | 0,02 | 18,59 | 3,29 | 63,81 | 0,4646 | 0,1599 | |||
| ALL / The Allstate Corporation | 0,01 | 0,21 | 2,85 | -2,57 | 0,4019 | -0,0413 | |||
| ENB / Enbridge Inc. | 0,06 | -4,43 | 2,78 | -2,25 | 0,3921 | -0,0388 | |||
| NXPI / NXP Semiconductors N.V. | 0,01 | 13,96 | 2,60 | 30,98 | 0,3672 | 0,0661 | |||
| ABBV / AbbVie Inc. | 0,01 | -1,02 | 2,50 | -12,33 | 0,3535 | -0,0796 | |||
| CP / Canadian Pacific Kansas City Limited | 0,03 | -0,79 | 2,49 | 12,06 | 0,3517 | 0,0144 | |||
| NFG / National Fuel Gas Company | 0,03 | -2,73 | 2,36 | 4,06 | 0,3328 | -0,0108 | |||
| FI / Fiserv, Inc. | 0,01 | 1,25 | 2,29 | -20,96 | 0,3239 | -0,1162 | |||
| AMGN / Amgen Inc. | 0,01 | -1,58 | 2,29 | -11,78 | 0,3227 | -0,0703 | |||
| SCHW / The Charles Schwab Corporation | 0,02 | 4,14 | 2,25 | 21,41 | 0,3172 | 0,0365 | |||
| VEEV / Veeva Systems Inc. | 0,01 | 4,73 | 2,25 | 30,22 | 0,3170 | 0,0555 | |||
| PGR / The Progressive Corporation | 0,01 | -6,35 | 2,18 | -11,69 | 0,3071 | -0,0665 | |||
| HWM / Howmet Aerospace Inc. | 0,01 | -0,26 | 2,16 | 43,12 | 0,3056 | 0,0762 | |||
| LHX / L3Harris Technologies, Inc. | 0,01 | 2,56 | 2,05 | 22,88 | 0,2890 | 0,0364 | |||
| T / AT&T Inc. | 0,06 | -1,97 | 1,86 | 0,32 | 0,2626 | -0,0186 | |||
| BAC / Bank of America Corporation | 0,04 | -0,05 | 1,85 | 13,40 | 0,2616 | 0,0137 | |||
| GOOGL / Alphabet Inc. | 0,01 | -2,13 | 1,81 | 11,55 | 0,2550 | 0,0094 | |||
| FANG / Diamondback Energy, Inc. | 0,01 | 20,75 | 1,78 | 3,79 | 0,2516 | -0,0089 | |||
| MPC / Marathon Petroleum Corporation | 0,01 | -49,32 | 1,76 | -42,21 | 0,2478 | -0,2129 | |||
| QCOM / QUALCOMM Incorporated | 0,01 | 7,38 | 1,75 | 11,32 | 0,2473 | 0,0087 | |||
| EW / Edwards Lifesciences Corporation | 0,02 | 3,96 | 1,70 | 12,20 | 0,2402 | 0,0102 | |||
| CMG / Chipotle Mexican Grill, Inc. | 0,03 | 30,98 | 1,70 | 46,55 | 0,2396 | 0,0639 | |||
| RSG / Republic Services, Inc. | 0,01 | 0,13 | 1,69 | 1,99 | 0,2385 | -0,0127 | |||
| SNPS / Synopsys, Inc. | 0,00 | 92,90 | 1,66 | 130,78 | 0,2340 | 0,1250 | |||
| ECL / Ecolab Inc. | 0,01 | 77,45 | 1,56 | 88,61 | 0,2197 | 0,0946 | |||
| GILD / Gilead Sciences, Inc. | 0,01 | -3,99 | 1,55 | -5,02 | 0,2191 | -0,0286 | |||
| KMI / Kinder Morgan, Inc. | 0,05 | -1,66 | 1,53 | 1,39 | 0,2162 | -0,0130 | |||
| ORLY / O'Reilly Automotive, Inc. | 0,02 | 1 350,80 | 1,40 | -8,70 | 0,1970 | -0,0348 | |||
| RTX / RTX Corporation | 0,01 | -0,96 | 1,37 | 9,17 | 0,1934 | 0,0031 | |||
| GD / General Dynamics Corporation | 0,00 | -8,58 | 1,31 | -2,09 | 0,1848 | -0,0181 | |||
| TROW / T. Rowe Price Group, Inc. | 0,01 | -0,89 | 1,30 | 4,10 | 0,1830 | -0,0058 | |||
| SHEL / Shell plc - Depositary Receipt (Common Stock) | 0,02 | 0,66 | 1,29 | -3,23 | 0,1822 | -0,0201 | |||
| HBCP / Home Bancorp, Inc. | 0,02 | -1,34 | 1,25 | 13,96 | 0,1765 | 0,0102 | |||
| DXCM / DexCom, Inc. | 0,01 | 11,18 | 1,24 | 42,11 | 0,1755 | 0,0428 | |||
| VOO / Vanguard Index Funds - Vanguard S&P 500 ETF | 0,00 | 11,85 | 1,24 | 23,68 | 0,1748 | 0,0229 | |||
| IBM / International Business Machines Corporation | 0,00 | 4,30 | 1,23 | 23,64 | 0,1737 | 0,0228 | |||
| SU / Suncor Energy Inc. | 0,03 | 0,80 | 1,18 | -2,48 | 0,1666 | -0,0170 | |||
| GE / General Electric Company | 0,00 | -0,15 | 1,17 | 28,37 | 0,1656 | 0,0271 | |||
| ET / Energy Transfer LP - Limited Partnership | 0,06 | -0,78 | 1,16 | -3,26 | 0,1636 | -0,0180 | |||
| MDLZ / Mondelez International, Inc. | 0,02 | -1,92 | 1,16 | -2,53 | 0,1634 | -0,0166 | |||
| CSX / CSX Corporation | 0,04 | -0,40 | 1,15 | 10,40 | 0,1619 | 0,0044 | |||
| NATH / Nathan's Famous, Inc. | 0,01 | 0,00 | 1,15 | 14,73 | 0,1618 | 0,0103 | |||
| WY / Weyerhaeuser Company | 0,04 | -3,31 | 1,13 | -15,11 | 0,1594 | -0,0424 | |||
| OKE / ONEOK, Inc. | 0,01 | -0,47 | 1,13 | -18,12 | 0,1588 | -0,0495 | |||
| TSLA / Tesla, Inc. | 0,00 | 0,03 | 1,09 | 22,56 | 0,1543 | 0,0191 | |||
| CNH / CNH Industrial N.V. | 0,08 | 0,36 | 1,07 | 5,92 | 0,1515 | -0,0021 | |||
| COR / Cencora, Inc. | 0,00 | -1,07 | 1,00 | 6,73 | 0,1411 | -0,0010 | |||
| WFC / Wells Fargo & Company | 0,01 | 0,43 | 0,97 | 12,14 | 0,1370 | 0,0057 | |||
| KO / The Coca-Cola Company | 0,01 | -2,48 | 0,95 | -3,67 | 0,1337 | -0,0154 | |||
| IVV / iShares Trust - iShares Core S&P 500 ETF | 0,00 | 30,73 | 0,92 | 44,38 | 0,1306 | 0,0335 | |||
| IRDM / Iridium Communications Inc. | 0,03 | -2,37 | 0,92 | 7,83 | 0,1303 | 0,0005 | |||
| GBX / The Greenbrier Companies, Inc. | 0,02 | -0,88 | 0,89 | -10,92 | 0,1256 | -0,0258 | |||
| BX / Blackstone Inc. | 0,01 | -0,31 | 0,88 | 6,70 | 0,1238 | -0,0008 | |||
| PARA / Paramount Global | 0,07 | 0,17 | 0,86 | 8,07 | 0,1210 | 0,0007 | |||
| IIIV / i3 Verticals, Inc. | 0,03 | -11,35 | 0,85 | -1,27 | 0,1205 | -0,0106 | |||
| CVS / CVS Health Corporation | 0,01 | -28,46 | 0,82 | -27,22 | 0,1156 | -0,0549 | |||
| NSRGY / Nestlé S.A. - Depositary Receipt (Common Stock) | 0,01 | 0,97 | 0,75 | -1,97 | 0,1056 | -0,0102 | |||
| PFE / Pfizer Inc. | 0,03 | -14,50 | 0,74 | -18,21 | 0,1047 | -0,0328 | |||
| ITOT / iShares Trust - iShares Core S&P Total U.S. Stock Market ETF | 0,00 | -3,08 | 0,66 | 7,28 | 0,0937 | -0,0001 | |||
| OXY / Occidental Petroleum Corporation | 0,02 | 3,38 | 0,66 | -11,98 | 0,0934 | -0,0206 | |||
| DVN / Devon Energy Corporation | 0,02 | -24,59 | 0,66 | -35,93 | 0,0930 | -0,0628 | |||
| WBD / Warner Bros. Discovery, Inc. | 0,06 | -11,30 | 0,64 | -5,20 | 0,0901 | -0,0121 | |||
| SJM / The J. M. Smucker Company | 0,01 | -1,80 | 0,64 | -18,52 | 0,0901 | -0,0287 | |||
| PEO / Adams Natural Resources Fund, Inc. | 0,03 | -2,38 | 0,61 | -8,51 | 0,0866 | -0,0151 | |||
| FGBI / First Guaranty Bancshares, Inc. | 0,07 | 0,12 | 0,61 | 6,88 | 0,0857 | -0,0004 | |||
| SMG / The Scotts Miracle-Gro Company | 0,01 | -19,05 | 0,60 | -2,75 | 0,0849 | -0,0089 | |||
| NVS / Novartis AG - Depositary Receipt (Common Stock) | 0,00 | -8,61 | 0,60 | -0,83 | 0,0843 | -0,0070 | |||
| KDP / Keurig Dr Pepper Inc. | 0,02 | -0,03 | 0,59 | -3,42 | 0,0838 | -0,0094 | |||
| QSR / Restaurant Brands International Inc. | 0,01 | 0,11 | 0,59 | -0,34 | 0,0837 | -0,0066 | |||
| KMB / Kimberly-Clark Corporation | 0,00 | -0,37 | 0,58 | -9,74 | 0,0825 | -0,0156 | |||
| MCD / McDonald's Corporation | 0,00 | -14,71 | 0,58 | -20,14 | 0,0823 | -0,0285 | |||
| TGT / Target Corporation | 0,01 | -8,76 | 0,57 | -13,68 | 0,0811 | -0,0199 | |||
| GEV / GE Vernova Inc. | 0,00 | -0,19 | 0,57 | 73,31 | 0,0798 | 0,0302 | |||
| EL / The Estée Lauder Companies Inc. | 0,01 | -29,97 | 0,56 | -14,31 | 0,0787 | -0,0199 | |||
| MCK / McKesson Corporation | 0,00 | -1,92 | 0,53 | 6,71 | 0,0741 | -0,0005 | |||
| ABT / Abbott Laboratories | 0,00 | -7,33 | 0,50 | -4,91 | 0,0712 | -0,0093 | |||
| BA / The Boeing Company | 0,00 | -0,25 | 0,50 | 22,72 | 0,0702 | 0,0087 | |||
| TJX / The TJX Companies, Inc. | 0,00 | -72,44 | 0,49 | -72,11 | 0,0689 | -0,1960 | |||
| WDFC / WD-40 Company | 0,00 | -3,16 | 0,47 | -9,54 | 0,0670 | -0,0125 | |||
| APD / Air Products and Chemicals, Inc. | 0,00 | -51,76 | 0,46 | -53,97 | 0,0656 | -0,0872 | |||
| CLF / Cleveland-Cliffs Inc. | 0,06 | 33,28 | 0,46 | 23,24 | 0,0645 | 0,0083 | |||
| CRDO / Credo Technology Group Holding Ltd | 0,00 | 0,44 | 0,0617 | 0,0617 | |||||
| HON / Honeywell International Inc. | 0,00 | -13,82 | 0,43 | -5,24 | 0,0613 | -0,0082 | |||
| PYPL / PayPal Holdings, Inc. | 0,01 | -16,63 | 0,43 | -5,07 | 0,0609 | -0,0080 | |||
| COP / ConocoPhillips | 0,00 | 0,77 | 0,42 | -13,82 | 0,0599 | -0,0148 | |||
| ICLR / ICON Public Limited Company | 0,00 | -30,24 | 0,42 | -42,05 | 0,0593 | -0,0505 | |||
| LMT / Lockheed Martin Corporation | 0,00 | -3,49 | 0,41 | 0,00 | 0,0579 | -0,0043 | |||
| FHN / First Horizon Corporation | 0,02 | 0,58 | 0,41 | 9,76 | 0,0573 | 0,0012 | |||
| WEN / The Wendy's Company | 0,04 | -6,69 | 0,41 | -27,16 | 0,0573 | -0,0272 | |||
| HAL / Halliburton Company | 0,02 | -28,09 | 0,40 | -42,22 | 0,0567 | -0,0487 | |||
| CNRD / Conrad Industries, Inc. | 0,02 | -11,00 | 0,39 | 33,90 | 0,0553 | 0,0110 | |||
| ITW / Illinois Tool Works Inc. | 0,00 | -1,40 | 0,37 | -1,61 | 0,0517 | -0,0048 | |||
| TSCO / Tractor Supply Company | 0,01 | 0,35 | 0,0497 | 0,0497 | |||||
| SEIC / SEI Investments Company | 0,00 | 0,57 | 0,35 | 16,39 | 0,0493 | 0,0038 | |||
| TRN / Trinity Industries, Inc. | 0,01 | -5,61 | 0,34 | -9,02 | 0,0484 | -0,0088 | |||
| XYL / Xylem Inc. | 0,00 | 0,00 | 0,32 | 8,47 | 0,0452 | 0,0004 | |||
| WWD / Woodward, Inc. | 0,00 | 0,08 | 0,32 | 34,45 | 0,0452 | 0,0091 | |||
| EBAY / eBay Inc. | 0,00 | -5,55 | 0,29 | 3,91 | 0,0413 | -0,0014 | |||
| ORCL / Oracle Corporation | 0,00 | 0,29 | 0,0403 | 0,0403 | |||||
| NSC / Norfolk Southern Corporation | 0,00 | -16,49 | 0,28 | -9,65 | 0,0397 | -0,0076 | |||
| SHW / The Sherwin-Williams Company | 0,00 | -0,37 | 0,27 | -2,14 | 0,0387 | -0,0037 | |||
| YUM / Yum! Brands, Inc. | 0,00 | 0,00 | 0,27 | -5,67 | 0,0376 | -0,0053 | |||
| BATRA / Atlanta Braves Holdings, Inc. | 0,01 | 0,00 | 0,26 | 12,07 | 0,0368 | 0,0016 | |||
| COST / Costco Wholesale Corporation | 0,00 | 0,00 | 0,26 | 4,84 | 0,0368 | -0,0010 | |||
| CNI / Canadian National Railway Company | 0,00 | 0,54 | 0,25 | 7,20 | 0,0358 | -0,0000 | |||
| JOE / The St. Joe Company | 0,01 | 0,18 | 0,25 | 1,66 | 0,0347 | -0,0019 | |||
| BWA / BorgWarner Inc. | 0,01 | 0,25 | 0,24 | 17,16 | 0,0337 | 0,0028 | |||
| VLO / Valero Energy Corporation | 0,00 | 0,00 | 0,24 | 2,15 | 0,0336 | -0,0019 | |||
| THO / THOR Industries, Inc. | 0,00 | -2,18 | 0,23 | 14,43 | 0,0326 | 0,0020 | |||
| ATO / Atmos Energy Corporation | 0,00 | 0,54 | 0,23 | 0,44 | 0,0324 | -0,0023 | |||
| EMR / Emerson Electric Co. | 0,00 | -11,84 | 0,23 | 7,08 | 0,0321 | -0,0001 | |||
| ADP / Automatic Data Processing, Inc. | 0,00 | 0,00 | 0,22 | 0,92 | 0,0310 | -0,0020 | |||
| QQQ / Invesco QQQ Trust, Series 1 | 0,00 | 0,21 | 0,0300 | 0,0300 | |||||
| CARR / Carrier Global Corporation | 0,00 | 0,21 | 0,0300 | 0,0300 | |||||
| APA / APA Corporation | 0,01 | 5,87 | 0,21 | -7,89 | 0,0297 | -0,0049 | |||
| ICE / Intercontinental Exchange, Inc. | 0,00 | -84,53 | 0,21 | -83,61 | 0,0294 | -0,1623 | |||
| BSM / Black Stone Minerals, L.P. - Limited Partnership | 0,02 | 2,71 | 0,20 | -12,07 | 0,0289 | -0,0064 | |||
| WSM / Williams-Sonoma, Inc. | 0,00 | 0,20 | 0,0287 | 0,0287 | |||||
| NEE / NextEra Energy, Inc. | 0,00 | -14,75 | 0,20 | -16,60 | 0,0285 | -0,0082 | |||
| VICR / Vicor Corporation | 0,00 | 0,20 | 0,0285 | 0,0285 | |||||
| TRV / The Travelers Companies, Inc. | 0,00 | 0,20 | 0,0282 | 0,0282 | |||||
| LILAK / Liberty Latin America Ltd. | 0,03 | 87,72 | 0,20 | 87,74 | 0,0282 | 0,0121 | |||
| BP / BP p.l.c. - Depositary Receipt (Common Stock) | 0,00 | -100,00 | 0,00 | 0,0000 | |||||
| INTC / Intel Corporation | 0,00 | -100,00 | 0,00 | 0,0000 | |||||
| CB / Chubb Limited | 0,00 | -100,00 | 0,00 | 0,0000 | |||||
| PSX / Phillips 66 | 0,00 | -100,00 | 0,00 | 0,0000 |