Statistiques de base
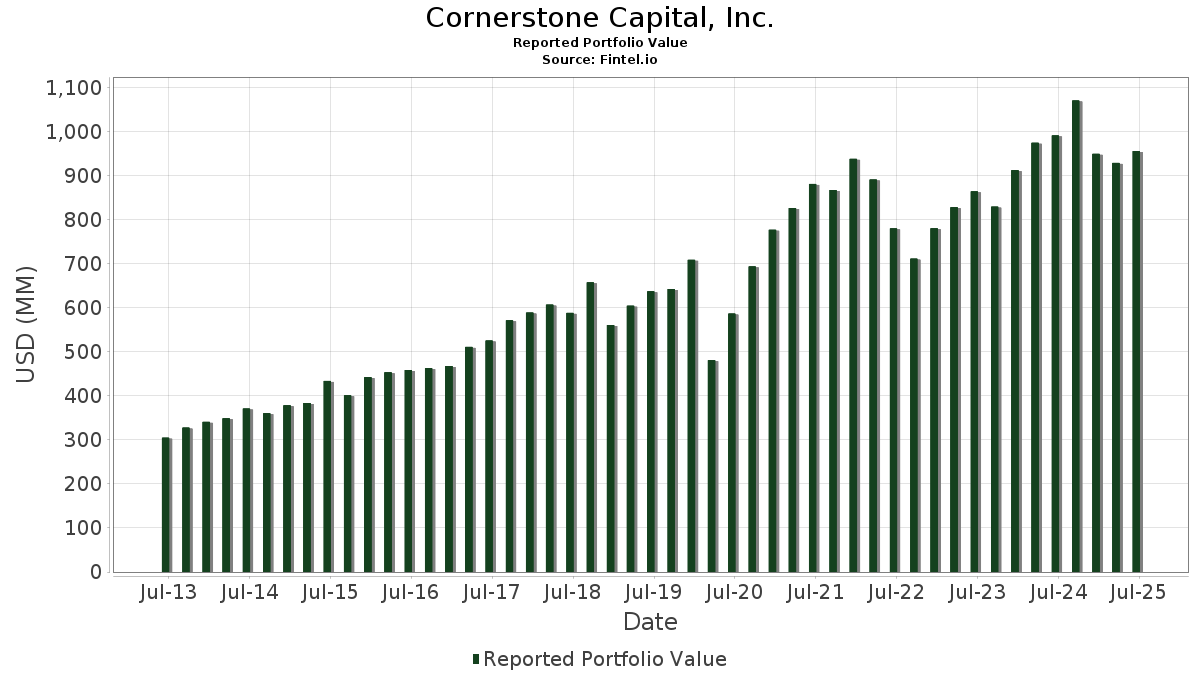
| Valeur du portefeuille | $ 956 152 833 |
| Positions actuelles | 99 |
Dernières positions, performances, ASG (à partir des dépôts 13F, 13D)
Cornerstone Capital, Inc. a déclaré un total de 99 positions dans ses derniers dépôts auprès de la SEC. La valeur la plus récente du portefeuille est calculée à 956 152 833 USD. Les actifs sous gestion réels (ASG) sont cette valeur plus les liquidités (qui ne sont pas divulguées). Les principales positions de Cornerstone Capital, Inc. sont Microsoft Corporation (US:MSFT) , Visa Inc. (US:V) , Corning Incorporated (US:GLW) , Amazon.com, Inc. (US:AMZN) , and Arthur J. Gallagher & Co. (US:AJG) . Les nouvelles positions de Cornerstone Capital, Inc. incluent Oklo Inc. (US:OKLO) , Pure Storage, Inc. (US:PSTG) , .
Meilleures augmentations ce trimestre
Nous utilisons la variation de l'allocation du portefeuille car il s'agit de l'indicateur le plus significatif. Les changements peuvent être dus à des transactions ou à des variations de prix des actions.
| Titre | Actions (en millions) |
Valeur ($ en millions) |
% du portefeuille | ΔPortefeuille % |
|---|---|---|---|---|
| 0,10 | 52,17 | 5,4558 | 1,0107 | |
| 0,25 | 25,10 | 2,6246 | 0,7861 | |
| 0,03 | 20,88 | 2,1838 | 0,6229 | |
| 0,30 | 28,36 | 2,9663 | 0,5503 | |
| 0,08 | 10,31 | 1,0787 | 0,5296 | |
| 0,67 | 35,01 | 3,6614 | 0,4828 | |
| 0,27 | 31,25 | 3,2683 | 0,3876 | |
| 0,02 | 17,61 | 1,8414 | 0,3742 | |
| 0,02 | 17,63 | 1,8436 | 0,3590 | |
| 0,18 | 21,90 | 2,2909 | 0,3386 |
Principales baisses ce trimestre
Nous utilisons la variation de l'allocation du portefeuille car il s'agit de l'indicateur le plus significatif. Les changements peuvent être dus à des transactions ou à des variations de prix des actions.
| Titre | Actions (en millions) |
Valeur ($ en millions) |
% du portefeuille | ΔPortefeuille % |
|---|---|---|---|---|
| 0,16 | 29,26 | 3,0600 | -0,6553 | |
| 0,09 | 15,36 | 1,6062 | -0,6073 | |
| 0,10 | 32,07 | 3,3542 | -0,5521 | |
| 0,09 | 25,67 | 2,6852 | -0,5411 | |
| 0,05 | 20,36 | 2,1290 | -0,4074 | |
| 0,09 | 12,11 | 1,2661 | -0,3828 | |
| 0,24 | 9,85 | 1,0297 | -0,3782 | |
| 0,18 | 32,03 | 3,3504 | -0,3322 | |
| 0,12 | 15,17 | 1,5863 | -0,3091 | |
| 0,13 | 46,06 | 4,8170 | -0,3032 |
Déclarations 13F et dépôts de fonds
Ce formulaire a été déposé le 2025-08-12 pour la période de déclaration 2025-06-30. Cliquez sur l'icône du lien pour voir l'historique complet des transactions.
Mettre à niveau pour débloquer les données premium et exporter vers Excel ![]() .
.
| Titre | Type | Prix moyen de l'action | Actions (en millions) |
ΔActions (%) |
ΔActions (%) |
Valeur ($ en millions) |
Portefeuille (%) |
ΔPortefeuille (%) |
|
|---|---|---|---|---|---|---|---|---|---|
| MSFT / Microsoft Corporation | 0,10 | -4,69 | 52,17 | 26,29 | 5,4558 | 1,0107 | |||
| V / Visa Inc. | 0,13 | -4,45 | 46,06 | -3,20 | 4,8170 | -0,3032 | |||
| GLW / Corning Incorporated | 0,67 | 3,17 | 35,01 | 18,52 | 3,6614 | 0,4828 | |||
| AMZN / Amazon.com, Inc. | 0,16 | -6,64 | 34,65 | 7,65 | 3,6243 | 0,1602 | |||
| AJG / Arthur J. Gallagher & Co. | 0,10 | -4,71 | 32,07 | -11,65 | 3,3542 | -0,5521 | |||
| GOOGL / Alphabet Inc. | 0,18 | -17,85 | 32,03 | -6,39 | 3,3504 | -0,3322 | |||
| SHOP / Shopify Inc. | 0,27 | -3,37 | 31,25 | 16,74 | 3,2683 | 0,3876 | |||
| ABT / Abbott Laboratories | 0,22 | -5,23 | 29,30 | -2,83 | 3,0646 | -0,1805 | |||
| ABBV / AbbVie Inc. | 0,16 | -4,34 | 29,26 | -15,25 | 3,0600 | -0,6553 | |||
| UBER / Uber Technologies, Inc. | 0,30 | -1,34 | 28,36 | 26,33 | 2,9663 | 0,5503 | |||
| AMGN / Amgen Inc. | 0,09 | -4,44 | 25,67 | -14,36 | 2,6852 | -0,5411 | |||
| APH / Amphenol Corporation | 0,25 | -2,43 | 25,10 | 46,89 | 2,6246 | 0,7861 | |||
| WDAY / Workday, Inc. | 0,09 | -4,95 | 22,41 | -2,31 | 2,3441 | -0,1250 | |||
| PG / The Procter & Gamble Company | 0,14 | 8,38 | 22,20 | 1,32 | 2,3214 | -0,0361 | |||
| DIS / The Walt Disney Company | 0,18 | -3,90 | 21,90 | 20,74 | 2,2909 | 0,3386 | |||
| AME / AMETEK, Inc. | 0,12 | 2,18 | 21,03 | 7,41 | 2,1990 | 0,0925 | |||
| GS / The Goldman Sachs Group, Inc. | 0,03 | 11,12 | 20,88 | 43,96 | 2,1838 | 0,6229 | |||
| CSCO / Cisco Systems, Inc. | 0,30 | -7,44 | 20,70 | 4,07 | 2,1652 | 0,0244 | |||
| TMO / Thermo Fisher Scientific Inc. | 0,05 | 6,00 | 20,36 | -13,63 | 2,1290 | -0,4074 | |||
| RS / Reliance, Inc. | 0,06 | -3,36 | 20,06 | 5,06 | 2,0984 | 0,0432 | |||
| SPY / SPDR S&P 500 ETF | 0,03 | 1,34 | 19,08 | 11,93 | 1,9955 | 0,1610 | |||
| META / Meta Platforms, Inc. | 0,02 | -0,22 | 17,63 | 27,78 | 1,8436 | 0,3590 | |||
| NOW / ServiceNow, Inc. | 0,02 | 0,00 | 17,61 | 29,13 | 1,8414 | 0,3742 | |||
| HD / The Home Depot, Inc. | 0,05 | -6,15 | 16,76 | -6,11 | 1,7533 | -0,1681 | |||
| TRMB / Trimble Inc. | 0,22 | -7,48 | 16,37 | 7,08 | 1,7118 | 0,0669 | |||
| SSD / Simpson Manufacturing Co., Inc. | 0,11 | -4,68 | 16,32 | -5,76 | 1,7066 | -0,1567 | |||
| XLU / The Select Sector SPDR Trust - The Utilities Select Sector SPDR Fund | 0,19 | -0,08 | 15,76 | 3,48 | 1,6480 | 0,0094 | |||
| ATR / AptarGroup, Inc. | 0,10 | -4,43 | 15,52 | 0,75 | 1,6236 | -0,0345 | |||
| SHAK / Shake Shack Inc. | 0,11 | -39,86 | 15,39 | -4,10 | 1,6100 | -0,1173 | |||
| FI / Fiserv, Inc. | 0,09 | -4,36 | 15,36 | -25,34 | 1,6062 | -0,6073 | |||
| KMB / Kimberly-Clark Corporation | 0,12 | -5,00 | 15,17 | -13,89 | 1,5863 | -0,3091 | |||
| JNJ / Johnson & Johnson | 0,10 | -5,65 | 14,92 | -13,10 | 1,5601 | -0,2871 | |||
| CHTR / Charter Communications, Inc. | 0,04 | 13,67 | 14,73 | 26,10 | 1,5402 | 0,2834 | |||
| CRM / Salesforce, Inc. | 0,05 | -0,00 | 13,98 | 1,61 | 1,4619 | -0,0185 | |||
| SCHW / The Charles Schwab Corporation | 0,14 | -5,88 | 12,64 | 9,70 | 1,3220 | 0,0820 | |||
| PEP / PepsiCo, Inc. | 0,09 | -10,28 | 12,11 | -21,00 | 1,2661 | -0,3828 | |||
| VZ / Verizon Communications Inc. | 0,28 | -9,08 | 11,93 | -13,27 | 1,2480 | -0,2326 | |||
| VRT / Vertiv Holdings Co | 0,08 | 13,66 | 10,31 | 102,14 | 1,0787 | 0,5296 | |||
| RHI / Robert Half Inc. | 0,24 | 0,00 | 9,85 | -24,75 | 1,0297 | -0,3782 | |||
| BOX / Box, Inc. | 0,29 | -9,84 | 9,79 | -0,17 | 1,0240 | -0,0314 | |||
| AAPL / Apple Inc. | 0,04 | -0,93 | 8,82 | -8,50 | 0,9221 | -0,1148 | |||
| KMI / Kinder Morgan, Inc. | 0,30 | -10,93 | 8,75 | -8,22 | 0,9147 | -0,1108 | |||
| INDA / iShares Trust - iShares MSCI India ETF | 0,16 | 1,28 | 8,64 | 9,54 | 0,9034 | 0,0548 | |||
| ETN / Eaton Corporation plc | 0,02 | -0,30 | 7,77 | 30,94 | 0,8127 | 0,1741 | |||
| ISRG / Intuitive Surgical, Inc. | 0,01 | -3,35 | 6,21 | 6,05 | 0,6494 | 0,0193 | |||
| CCI / Crown Castle Inc. | 0,06 | -3,46 | 5,69 | -4,85 | 0,5950 | -0,0484 | |||
| DOC / Healthpeak Properties, Inc. | 0,32 | -9,16 | 5,56 | -21,33 | 0,5819 | -0,1792 | |||
| SO / The Southern Company | 0,05 | -13,62 | 4,80 | -13,73 | 0,5021 | -0,0968 | |||
| GILD / Gilead Sciences, Inc. | 0,04 | 1,59 | 3,94 | 0,51 | 0,4121 | -0,0098 | |||
| CRWD / CrowdStrike Holdings, Inc. | 0,01 | 1,34 | 3,46 | 46,40 | 0,3614 | 0,1074 | |||
| NVDA / NVIDIA Corporation | 0,02 | -0,57 | 2,66 | 44,96 | 0,2786 | 0,0808 | |||
| DUK / Duke Energy Corporation | 0,02 | -31,79 | 1,80 | -34,01 | 0,1884 | -0,1054 | |||
| VGK / Vanguard International Equity Index Funds - Vanguard FTSE Europe ETF | 0,02 | 0,00 | 1,78 | 10,41 | 0,1864 | 0,0126 | |||
| VTI / Vanguard Index Funds - Vanguard Total Stock Market ETF | 0,01 | 11,23 | 1,75 | 22,96 | 0,1832 | 0,0300 | |||
| BRK.B / Berkshire Hathaway Inc. | 0,00 | -17,05 | 1,67 | -24,34 | 0,1743 | -0,0627 | |||
| EWJ / iShares, Inc. - iShares MSCI Japan ETF | 0,02 | -17,11 | 1,42 | -9,35 | 0,1481 | -0,0200 | |||
| ITW / Illinois Tool Works Inc. | 0,00 | -5,19 | 1,11 | -5,47 | 0,1158 | -0,0103 | |||
| QQQ / Invesco QQQ Trust, Series 1 | 0,00 | -12,21 | 1,07 | 3,28 | 0,1120 | 0,0004 | |||
| AVUS / American Century ETF Trust - Avantis U.S. Equity ETF | 0,01 | 0,00 | 0,95 | 9,12 | 0,0989 | 0,0057 | |||
| TSLA / Tesla, Inc. | 0,00 | -13,00 | 0,91 | 6,53 | 0,0956 | 0,0034 | |||
| LMT / Lockheed Martin Corporation | 0,00 | 0,00 | 0,76 | 3,66 | 0,0800 | 0,0006 | |||
| PFF / iShares Trust - iShares Preferred and Income Securities ETF | 0,02 | 5,71 | 0,70 | 5,46 | 0,0728 | 0,0018 | |||
| XOM / Exxon Mobil Corporation | 0,01 | 6,01 | 0,69 | -4,03 | 0,0724 | -0,0051 | |||
| LGND / Ligand Pharmaceuticals Incorporated | 0,01 | 0,00 | 0,65 | 8,13 | 0,0682 | 0,0033 | |||
| CVX / Chevron Corporation | 0,00 | 11,60 | 0,65 | -4,43 | 0,0677 | -0,0052 | |||
| VKTX / Viking Therapeutics, Inc. | 0,02 | 0,00 | 0,64 | 9,73 | 0,0673 | 0,0042 | |||
| KO / The Coca-Cola Company | 0,01 | 0,00 | 0,61 | -1,13 | 0,0639 | -0,0027 | |||
| ADI / Analog Devices, Inc. | 0,00 | 0,00 | 0,55 | 17,89 | 0,0573 | 0,0073 | |||
| TRGP / Targa Resources Corp. | 0,00 | 0,00 | 0,49 | -13,12 | 0,0513 | -0,0095 | |||
| GLD / SPDR Gold Trust | 0,00 | 0,00 | 0,48 | 5,68 | 0,0507 | 0,0014 | |||
| ED / Consolidated Edison, Inc. | 0,00 | 0,00 | 0,48 | -9,13 | 0,0500 | -0,0067 | |||
| AVAV / AeroVironment, Inc. | 0,00 | 0,46 | 0,0483 | 0,0483 | |||||
| AVDE / American Century ETF Trust - Avantis International Equity ETF | 0,01 | -47,56 | 0,45 | -41,49 | 0,0476 | -0,0360 | |||
| OBK / Origin Bancorp, Inc. | 0,01 | -16,65 | 0,45 | -14,04 | 0,0468 | -0,0092 | |||
| AVGO / Broadcom Inc. | 0,00 | -0,93 | 0,44 | 63,33 | 0,0461 | 0,0170 | |||
| PLTR / Palantir Technologies Inc. | 0,00 | 0,00 | 0,44 | 61,48 | 0,0456 | 0,0166 | |||
| MRK / Merck & Co., Inc. | 0,01 | 0,00 | 0,44 | -11,76 | 0,0455 | -0,0076 | |||
| PFE / Pfizer Inc. | 0,02 | -1,78 | 0,42 | -6,07 | 0,0438 | -0,0042 | |||
| BMY / Bristol-Myers Squibb Company | 0,01 | 0,00 | 0,42 | -24,13 | 0,0435 | -0,0155 | |||
| EMR / Emerson Electric Co. | 0,00 | 0,00 | 0,41 | 21,76 | 0,0433 | 0,0067 | |||
| COST / Costco Wholesale Corporation | 0,00 | -12,99 | 0,40 | -8,94 | 0,0416 | -0,0054 | |||
| DFJ / WisdomTree Trust - WisdomTree Japan SmallCap Dividend Fund | 0,00 | -32,50 | 0,37 | -27,15 | 0,0391 | -0,0160 | |||
| IWV / iShares Trust - iShares Russell 3000 ETF | 0,00 | -19,68 | 0,34 | -11,35 | 0,0352 | -0,0056 | |||
| GE / General Electric Company | 0,00 | 0,00 | 0,30 | 28,88 | 0,0313 | 0,0063 | |||
| XLK / The Select Sector SPDR Trust - The Technology Select Sector SPDR Fund | 0,00 | 0,00 | 0,29 | 22,75 | 0,0299 | 0,0048 | |||
| OABI / OmniAb, Inc. | 0,16 | -4,80 | 0,28 | -31,07 | 0,0298 | -0,0146 | |||
| FSLR / First Solar, Inc. | 0,00 | 0,00 | 0,27 | 31,37 | 0,0280 | 0,0060 | |||
| ADBE / Adobe Inc. | 0,00 | -23,41 | 0,27 | -22,97 | 0,0278 | -0,0092 | |||
| AVEM / American Century ETF Trust - Avantis Emerging Markets Equity ETF | 0,00 | -39,43 | 0,26 | -30,95 | 0,0273 | -0,0134 | |||
| IBKR / Interactive Brokers Group, Inc. | 0,00 | 0,26 | 0,0272 | 0,0272 | |||||
| WMB / The Williams Companies, Inc. | 0,00 | 0,00 | 0,26 | 4,88 | 0,0271 | 0,0006 | |||
| AVUV / American Century ETF Trust - Avantis U.S. Small Cap Value ETF | 0,00 | 0,00 | 0,26 | 4,51 | 0,0267 | 0,0004 | |||
| OKLO / Oklo Inc. | 0,00 | 0,25 | 0,0265 | 0,0265 | |||||
| DOV / Dover Corporation | 0,00 | 0,00 | 0,25 | 4,26 | 0,0257 | 0,0003 | |||
| PSTG / Pure Storage, Inc. | 0,00 | 0,24 | 0,0256 | 0,0256 | |||||
| AEP / American Electric Power Company, Inc. | 0,00 | 0,00 | 0,24 | -5,18 | 0,0250 | -0,0021 | |||
| ABNB / Airbnb, Inc. | 0,00 | 0,22 | 0,0227 | 0,0227 | |||||
| ENVX / Enovix Corporation | 0,02 | 73,16 | 0,18 | 144,59 | 0,0189 | 0,0110 | |||
| STKL / SunOpta Inc. | 0,02 | 0,00 | 0,14 | 19,01 | 0,0151 | 0,0021 | |||
| PAYX / Paychex, Inc. | 0,00 | -100,00 | 0,00 | 0,0000 | |||||
| STZ / Constellation Brands, Inc. | 0,00 | -100,00 | 0,00 | 0,0000 | |||||
| UNH / UnitedHealth Group Incorporated | 0,00 | -100,00 | 0,00 | 0,0000 | |||||
| LLY / Eli Lilly and Company | 0,00 | -100,00 | 0,00 | 0,0000 |