Statistiques de base
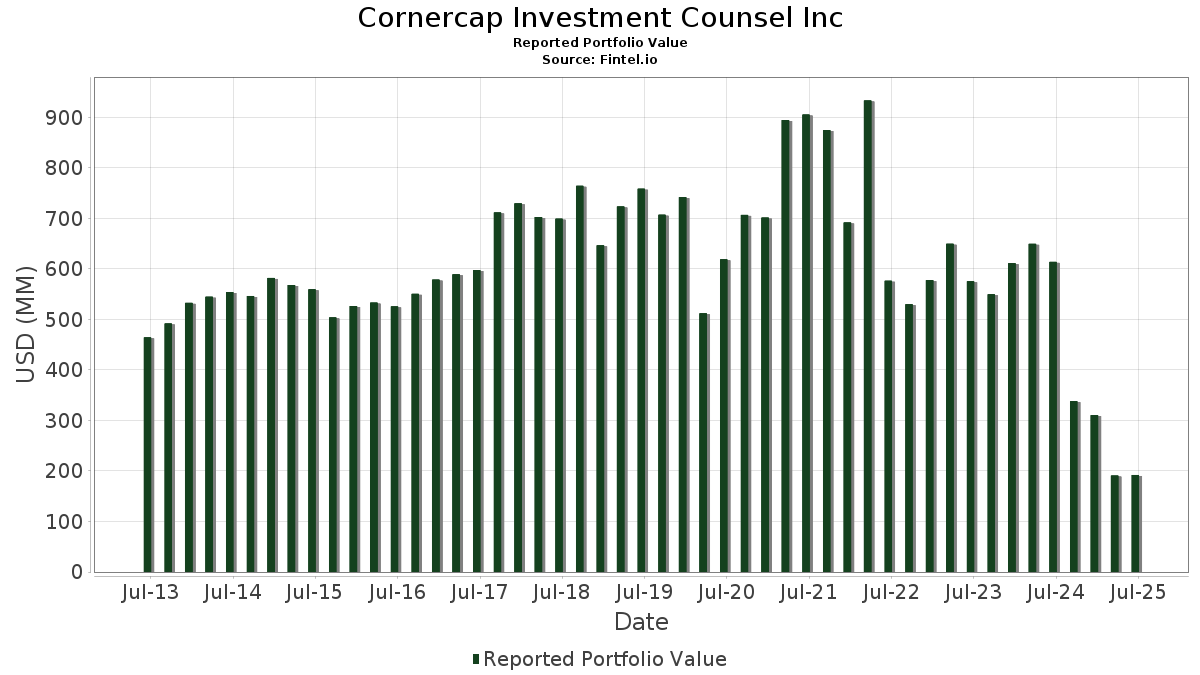
| Valeur du portefeuille | $ 192 019 094 |
| Positions actuelles | 152 |
Dernières positions, performances, ASG (à partir des dépôts 13F, 13D)
Cornercap Investment Counsel Inc a déclaré un total de 152 positions dans ses derniers dépôts auprès de la SEC. La valeur la plus récente du portefeuille est calculée à 192 019 094 USD. Les actifs sous gestion réels (ASG) sont cette valeur plus les liquidités (qui ne sont pas divulguées). Les principales positions de Cornercap Investment Counsel Inc sont Johnson & Johnson (US:JNJ) , Wells Fargo & Company (US:WFC) , Cisco Systems, Inc. (US:CSCO) , The Walt Disney Company (US:DIS) , and JPMorgan Chase & Co. (US:JPM) . Les nouvelles positions de Cornercap Investment Counsel Inc incluent GE HealthCare Technologies Inc. (US:GEHC) , Zebra Technologies Corporation (US:ZBRA) , Ralliant Corporation (US:RAL) , .
Meilleures augmentations ce trimestre
Nous utilisons la variation de l'allocation du portefeuille car il s'agit de l'indicateur le plus significatif. Les changements peuvent être dus à des transactions ou à des variations de prix des actions.
| Titre | Actions (en millions) |
Valeur ($ en millions) |
% du portefeuille | ΔPortefeuille % |
|---|---|---|---|---|
| 0,02 | 1,59 | 0,8259 | 0,8259 | |
| 0,04 | 1,51 | 0,7845 | 0,7845 | |
| 0,01 | 1,49 | 0,7736 | 0,7736 | |
| 0,01 | 1,44 | 0,7517 | 0,7517 | |
| 0,02 | 1,38 | 0,7175 | 0,7175 | |
| 0,00 | 1,00 | 0,5188 | 0,5188 | |
| 0,00 | 0,91 | 0,4752 | 0,4752 | |
| 0,01 | 1,74 | 0,9049 | 0,4447 | |
| 0,01 | 1,47 | 0,7652 | 0,4311 | |
| 0,00 | 0,81 | 0,4193 | 0,4193 |
Principales baisses ce trimestre
Nous utilisons la variation de l'allocation du portefeuille car il s'agit de l'indicateur le plus significatif. Les changements peuvent être dus à des transactions ou à des variations de prix des actions.
| Titre | Actions (en millions) |
Valeur ($ en millions) |
% du portefeuille | ΔPortefeuille % |
|---|---|---|---|---|
| 0,00 | 0,75 | 0,3916 | -0,4285 | |
| 0,04 | 1,78 | 0,9246 | -0,3311 | |
| 0,00 | 2,40 | 1,2481 | -0,3298 | |
| 0,02 | 1,41 | 0,7338 | -0,2979 | |
| 0,03 | 1,33 | 0,6943 | -0,2568 | |
| 0,03 | 2,35 | 1,2216 | -0,2513 | |
| 0,02 | 1,03 | 0,5341 | -0,2387 | |
| 0,02 | 3,73 | 1,9401 | -0,2285 | |
| 0,01 | 1,92 | 1,0016 | -0,2043 | |
| 0,02 | 1,93 | 1,0026 | -0,1691 |
Déclarations 13F et dépôts de fonds
Ce formulaire a été déposé le 2025-08-06 pour la période de déclaration 2025-06-30. Cliquez sur l'icône du lien pour voir l'historique complet des transactions.
Mettre à niveau pour débloquer les données premium et exporter vers Excel ![]() .
.
| Titre | Type | Prix moyen de l'action | Actions (en millions) |
ΔActions (%) |
ΔActions (%) |
Valeur ($ en millions) |
Portefeuille (%) |
ΔPortefeuille (%) |
|
|---|---|---|---|---|---|---|---|---|---|
| JNJ / Johnson & Johnson | 0,02 | -2,22 | 3,73 | -9,94 | 1,9401 | -0,2285 | |||
| WFC / Wells Fargo & Company | 0,04 | -13,85 | 3,50 | -3,85 | 1,8209 | -0,0857 | |||
| CSCO / Cisco Systems, Inc. | 0,05 | -2,26 | 3,45 | 9,87 | 1,7972 | 0,1508 | |||
| DIS / The Walt Disney Company | 0,02 | -2,30 | 2,85 | 22,76 | 1,4858 | 0,2673 | |||
| JPM / JPMorgan Chase & Co. | 0,01 | -20,62 | 2,48 | -6,21 | 1,2894 | -0,0943 | |||
| META / Meta Platforms, Inc. | 0,00 | -37,82 | 2,40 | -20,37 | 1,2481 | -0,3298 | |||
| COP / ConocoPhillips | 0,03 | -2,29 | 2,35 | -16,52 | 1,2216 | -0,2513 | |||
| C / Citigroup Inc. | 0,03 | -13,09 | 2,31 | 4,19 | 1,2045 | 0,0409 | |||
| BKNG / Booking Holdings Inc. | 0,00 | -1,55 | 2,20 | 23,68 | 1,1457 | 0,2134 | |||
| SCHW / The Charles Schwab Corporation | 0,02 | -2,10 | 2,10 | 14,11 | 1,0915 | 0,1285 | |||
| ABBV / AbbVie Inc. | 0,01 | 21,67 | 2,01 | 7,82 | 1,0491 | 0,0693 | |||
| CVS / CVS Health Corporation | 0,03 | -2,00 | 2,01 | -0,25 | 1,0452 | -0,0094 | |||
| VST / Vistra Corp. | 0,01 | -32,81 | 1,97 | 10,87 | 1,0257 | 0,0945 | |||
| MRK / Merck & Co., Inc. | 0,02 | -2,33 | 1,93 | -13,83 | 1,0026 | -0,1691 | |||
| CVX / Chevron Corporation | 0,01 | -2,31 | 1,92 | -16,39 | 1,0016 | -0,2043 | |||
| CMCSA / Comcast Corporation | 0,05 | -2,45 | 1,85 | -5,65 | 0,9653 | -0,0646 | |||
| HCA / HCA Healthcare, Inc. | 0,00 | -2,13 | 1,78 | 8,48 | 0,9269 | 0,0669 | |||
| BMY / Bristol-Myers Squibb Company | 0,04 | -2,33 | 1,78 | -25,89 | 0,9246 | -0,3311 | |||
| AMD / Advanced Micro Devices, Inc. | 0,01 | 43,33 | 1,74 | 98,06 | 0,9049 | 0,4447 | |||
| MA / Mastercard Incorporated | 0,00 | -0,87 | 1,74 | 1,64 | 0,9037 | 0,0086 | |||
| NTRS / Northern Trust Corporation | 0,01 | -17,63 | 1,72 | 5,83 | 0,8983 | 0,0441 | |||
| V / Visa Inc. | 0,00 | -2,12 | 1,72 | -0,86 | 0,8960 | -0,0136 | |||
| NEM / Newmont Corporation | 0,03 | -2,24 | 1,71 | 18,00 | 0,8912 | 0,1307 | |||
| RF / Regions Financial Corporation | 0,07 | -2,27 | 1,70 | 5,78 | 0,8863 | 0,0428 | |||
| TFC / Truist Financial Corporation | 0,04 | -2,25 | 1,67 | 2,08 | 0,8701 | 0,0123 | |||
| HIG / The Hartford Insurance Group, Inc. | 0,01 | -2,14 | 1,67 | 0,36 | 0,8687 | -0,0029 | |||
| MSFT / Microsoft Corporation | 0,00 | -2,37 | 1,66 | 29,34 | 0,8660 | 0,1921 | |||
| LDOS / Leidos Holdings, Inc. | 0,01 | -2,22 | 1,65 | 14,32 | 0,8609 | 0,1028 | |||
| MO / Altria Group, Inc. | 0,03 | -2,18 | 1,62 | -4,42 | 0,8453 | -0,0452 | |||
| GOOGL / Alphabet Inc. | 0,01 | -2,28 | 1,60 | 11,40 | 0,8343 | 0,0801 | |||
| BAC / Bank of America Corporation | 0,03 | -2,39 | 1,60 | 10,71 | 0,8343 | 0,0755 | |||
| SPGI / S&P Global Inc. | 0,00 | -2,23 | 1,60 | 1,46 | 0,8315 | 0,0065 | |||
| ULTA / Ulta Beauty, Inc. | 0,00 | -2,35 | 1,59 | 24,63 | 0,8303 | 0,1596 | |||
| FNF / Fidelity National Financial, Inc. | 0,03 | -2,07 | 1,59 | -15,61 | 0,8276 | -0,1601 | |||
| PM / Philip Morris International Inc. | 0,01 | -24,79 | 1,59 | -13,71 | 0,8261 | -0,1376 | |||
| GEHC / GE HealthCare Technologies Inc. | 0,02 | 1,59 | 0,8259 | 0,8259 | |||||
| LRCX / Lam Research Corporation | 0,02 | -2,54 | 1,58 | 30,50 | 0,8245 | 0,1884 | |||
| TMUS / T-Mobile US, Inc. | 0,01 | -2,09 | 1,58 | -12,54 | 0,8210 | -0,1239 | |||
| EA / Electronic Arts Inc. | 0,01 | -2,25 | 1,57 | 8,04 | 0,8189 | 0,0557 | |||
| GILD / Gilead Sciences, Inc. | 0,01 | -2,19 | 1,57 | -3,21 | 0,8169 | -0,0329 | |||
| MCO / Moody's Corporation | 0,00 | 89,34 | 1,57 | 104,04 | 0,8166 | 0,4135 | |||
| SYY / Sysco Corporation | 0,02 | -2,22 | 1,55 | -1,34 | 0,8065 | -0,0162 | |||
| MMM / 3M Company | 0,01 | -18,16 | 1,54 | -15,19 | 0,8028 | -0,1498 | |||
| SSNC / SS&C Technologies Holdings, Inc. | 0,02 | 71,22 | 1,54 | 69,72 | 0,8003 | 0,3256 | |||
| CAT / Caterpillar Inc. | 0,00 | -2,40 | 1,53 | 14,88 | 0,7966 | 0,0985 | |||
| ELV / Elevance Health, Inc. | 0,00 | -2,10 | 1,53 | -12,45 | 0,7951 | -0,1191 | |||
| TRV / The Travelers Companies, Inc. | 0,01 | -17,90 | 1,52 | -16,94 | 0,7918 | -0,1679 | |||
| RTX / RTX Corporation | 0,01 | -21,08 | 1,51 | -12,98 | 0,7861 | -0,1235 | |||
| PPL / PPL Corporation | 0,04 | 1,51 | 0,7845 | 0,7845 | |||||
| MET / MetLife, Inc. | 0,02 | -2,28 | 1,50 | -2,09 | 0,7813 | -0,0223 | |||
| BR / Broadridge Financial Solutions, Inc. | 0,01 | 85,98 | 1,49 | 86,50 | 0,7772 | 0,3575 | |||
| PEP / PepsiCo, Inc. | 0,01 | 1,49 | 0,7736 | 0,7736 | |||||
| DUK / Duke Energy Corporation | 0,01 | -2,19 | 1,48 | -5,36 | 0,7723 | -0,0494 | |||
| ADBE / Adobe Inc. | 0,00 | -2,23 | 1,48 | -1,40 | 0,7701 | -0,0159 | |||
| WDAY / Workday, Inc. | 0,01 | 124,33 | 1,47 | 130,61 | 0,7652 | 0,4311 | |||
| PFE / Pfizer Inc. | 0,06 | -2,28 | 1,46 | -6,53 | 0,7609 | -0,0586 | |||
| WTW / Willis Towers Watson Public Limited Company | 0,00 | -2,08 | 1,45 | -11,18 | 0,7574 | -0,1012 | |||
| ACN / Accenture plc | 0,00 | -2,24 | 1,45 | -6,40 | 0,7551 | -0,0567 | |||
| LEN / Lennar Corporation | 0,01 | 1,44 | 0,7517 | 0,7517 | |||||
| EXPE / Expedia Group, Inc. | 0,01 | -10,60 | 1,43 | -10,33 | 0,7467 | -0,0913 | |||
| CTRA / Coterra Energy Inc. | 0,06 | -2,22 | 1,43 | -14,15 | 0,7463 | -0,1287 | |||
| SLB / Schlumberger Limited | 0,04 | 10,56 | 1,43 | -10,58 | 0,7438 | -0,0938 | |||
| DVN / Devon Energy Corporation | 0,04 | 44,28 | 1,42 | 22,69 | 0,7409 | 0,1331 | |||
| ZM / Zoom Communications Inc. | 0,02 | -2,36 | 1,42 | 3,27 | 0,7395 | 0,0182 | |||
| USB / U.S. Bancorp | 0,03 | -2,42 | 1,41 | 4,59 | 0,7363 | 0,0275 | |||
| EBAY / eBay Inc. | 0,02 | -34,87 | 1,41 | -28,37 | 0,7338 | -0,2979 | |||
| LMT / Lockheed Martin Corporation | 0,00 | -2,13 | 1,38 | 1,47 | 0,7202 | 0,0057 | |||
| XEL / Xcel Energy Inc. | 0,02 | 1,38 | 0,7175 | 0,7175 | |||||
| TXT / Textron Inc. | 0,02 | -2,49 | 1,37 | 8,37 | 0,7152 | 0,0507 | |||
| MSCI / MSCI Inc. | 0,00 | -2,22 | 1,37 | -0,29 | 0,7133 | -0,0068 | |||
| TEAM / Atlassian Corporation | 0,01 | -2,30 | 1,36 | -6,52 | 0,7097 | -0,0544 | |||
| CSX / CSX Corporation | 0,04 | -2,49 | 1,34 | 8,06 | 0,6982 | 0,0481 | |||
| VZ / Verizon Communications Inc. | 0,03 | -22,96 | 1,33 | -26,52 | 0,6943 | -0,2568 | |||
| CI / The Cigna Group | 0,00 | -2,30 | 1,32 | -1,86 | 0,6880 | -0,0175 | |||
| TROW / T. Rowe Price Group, Inc. | 0,01 | -2,47 | 1,30 | 2,52 | 0,6786 | 0,0118 | |||
| EOG / EOG Resources, Inc. | 0,01 | -2,39 | 1,30 | -8,97 | 0,6769 | -0,0716 | |||
| NTAP / NetApp, Inc. | 0,01 | -2,64 | 1,30 | 18,16 | 0,6746 | 0,0995 | |||
| OXY / Occidental Petroleum Corporation | 0,03 | -2,35 | 1,29 | -16,90 | 0,6735 | -0,1423 | |||
| KHC / The Kraft Heinz Company | 0,05 | -2,22 | 1,29 | -17,05 | 0,6718 | -0,1433 | |||
| QCOM / QUALCOMM Incorporated | 0,01 | -2,50 | 1,27 | 1,12 | 0,6595 | 0,0027 | |||
| GIS / General Mills, Inc. | 0,02 | -2,25 | 1,26 | -15,35 | 0,6551 | -0,1235 | |||
| PFG / Principal Financial Group, Inc. | 0,02 | -2,41 | 1,25 | -8,14 | 0,6528 | -0,0625 | |||
| KMB / Kimberly-Clark Corporation | 0,01 | -2,30 | 1,22 | -11,43 | 0,6341 | -0,0867 | |||
| CRM / Salesforce, Inc. | 0,00 | -2,43 | 1,21 | -0,90 | 0,6327 | -0,0097 | |||
| MAS / Masco Corporation | 0,02 | -2,46 | 1,21 | -9,72 | 0,6286 | -0,0724 | |||
| TMO / Thermo Fisher Scientific Inc. | 0,00 | -2,19 | 1,19 | -20,35 | 0,6223 | -0,1638 | |||
| FDX / FedEx Corporation | 0,01 | -2,49 | 1,15 | -9,11 | 0,5982 | -0,0641 | |||
| AVY / Avery Dennison Corporation | 0,01 | -2,51 | 1,13 | -3,91 | 0,5892 | -0,0279 | |||
| UPS / United Parcel Service, Inc. | 0,01 | -2,60 | 1,03 | -10,69 | 0,5358 | -0,0676 | |||
| FTV / Fortive Corporation | 0,02 | -2,33 | 1,03 | -30,46 | 0,5341 | -0,2387 | |||
| HOLX / Hologic, Inc. | 0,02 | -2,79 | 1,02 | 2,51 | 0,5325 | 0,0097 | |||
| ETR / Entergy Corporation | 0,01 | -1,96 | 1,01 | -4,62 | 0,5267 | -0,0295 | |||
| AMAT / Applied Materials, Inc. | 0,01 | -3,04 | 1,01 | 22,28 | 0,5262 | 0,0931 | |||
| CEG / Constellation Energy Corporation | 0,00 | -2,35 | 1,01 | 56,45 | 0,5239 | 0,1865 | |||
| APTV / Aptiv PLC | 0,01 | -2,15 | 1,00 | 12,09 | 0,5218 | 0,0536 | |||
| COF / Capital One Financial Corporation | 0,00 | 1,00 | 0,5188 | 0,5188 | |||||
| BIIB / Biogen Inc. | 0,01 | -2,68 | 0,99 | -10,64 | 0,5163 | -0,0656 | |||
| VEEV / Veeva Systems Inc. | 0,00 | -2,21 | 0,97 | 21,64 | 0,5039 | 0,0867 | |||
| CTVA / Corteva, Inc. | 0,01 | -2,17 | 0,95 | 15,94 | 0,4965 | 0,0651 | |||
| KR / The Kroger Co. | 0,01 | -2,03 | 0,94 | 3,85 | 0,4919 | 0,0149 | |||
| TGT / Target Corporation | 0,01 | -2,80 | 0,94 | -8,08 | 0,4917 | -0,0470 | |||
| WAB / Westinghouse Air Brake Technologies Corporation | 0,00 | -2,12 | 0,92 | 13,05 | 0,4783 | 0,0522 | |||
| ZBRA / Zebra Technologies Corporation | 0,00 | 0,91 | 0,4752 | 0,4752 | |||||
| MS / Morgan Stanley | 0,01 | -2,27 | 0,90 | 18,05 | 0,4668 | 0,0685 | |||
| TJX / The TJX Companies, Inc. | 0,01 | -2,04 | 0,87 | -0,68 | 0,4539 | -0,0062 | |||
| PNR / Pentair plc | 0,01 | -2,28 | 0,85 | 14,61 | 0,4416 | 0,0539 | |||
| TER / Teradyne, Inc. | 0,01 | 60,85 | 0,82 | 75,21 | 0,4275 | 0,1817 | |||
| NI / NiSource Inc. | 0,02 | -2,18 | 0,81 | -1,58 | 0,4225 | -0,0096 | |||
| NOW / ServiceNow, Inc. | 0,00 | -2,11 | 0,81 | 26,41 | 0,4214 | 0,0858 | |||
| LHX / L3Harris Technologies, Inc. | 0,00 | 0,81 | 0,4193 | 0,4193 | |||||
| TEL / TE Connectivity plc | 0,00 | -2,32 | 0,80 | 16,59 | 0,4172 | 0,0569 | |||
| CRBG / Corebridge Financial, Inc. | 0,02 | -2,36 | 0,80 | 9,92 | 0,4157 | 0,0345 | |||
| HON / Honeywell International Inc. | 0,00 | -2,21 | 0,80 | 7,58 | 0,4142 | 0,0265 | |||
| D / Dominion Energy, Inc. | 0,01 | -2,21 | 0,78 | -1,39 | 0,4068 | -0,0086 | |||
| DD / DuPont de Nemours, Inc. | 0,01 | 27,97 | 0,77 | 17,50 | 0,4024 | 0,0577 | |||
| UNH / UnitedHealth Group Incorporated | 0,00 | 0,77 | 0,3992 | 0,3992 | |||||
| EVRG / Evergy, Inc. | 0,01 | -2,19 | 0,76 | -2,31 | 0,3973 | -0,0117 | |||
| FI / Fiserv, Inc. | 0,00 | 0,76 | 0,3952 | 0,3952 | |||||
| CMI / Cummins Inc. | 0,00 | -2,20 | 0,76 | 2,30 | 0,3943 | 0,0059 | |||
| DOV / Dover Corporation | 0,00 | -53,91 | 0,75 | -51,98 | 0,3916 | -0,4285 | |||
| CTSH / Cognizant Technology Solutions Corporation | 0,01 | -2,29 | 0,74 | -0,27 | 0,3846 | -0,0039 | |||
| APP / AppLovin Corporation | 0,00 | -31,32 | 0,74 | -9,25 | 0,3834 | -0,0420 | |||
| LAMR / Lamar Advertising Company | 0,01 | -2,25 | 0,72 | 4,34 | 0,3757 | 0,0129 | |||
| WPC / W. P. Carey Inc. | 0,01 | -2,25 | 0,72 | -3,38 | 0,3727 | -0,0156 | |||
| AIG / American International Group, Inc. | 0,01 | -2,24 | 0,71 | -3,78 | 0,3716 | -0,0171 | |||
| LYB / LyondellBasell Industries N.V. | 0,01 | -3,09 | 0,71 | -20,41 | 0,3679 | -0,0971 | |||
| FR / First Industrial Realty Trust, Inc. | 0,01 | -2,24 | 0,68 | -12,80 | 0,3549 | -0,0548 | |||
| NNN / NNN REIT, Inc. | 0,02 | -2,32 | 0,68 | -1,02 | 0,3526 | -0,0063 | |||
| TSN / Tyson Foods, Inc. | 0,01 | -2,21 | 0,67 | -14,36 | 0,3514 | -0,0613 | |||
| O / Realty Income Corporation | 0,01 | -2,30 | 0,66 | -3,07 | 0,3451 | -0,0130 | |||
| HD / The Home Depot, Inc. | 0,00 | -2,38 | 0,66 | -2,36 | 0,3450 | -0,0106 | |||
| MAA / Mid-America Apartment Communities, Inc. | 0,00 | -2,20 | 0,65 | -13,65 | 0,3364 | -0,0556 | |||
| MDT / Medtronic plc | 0,01 | -2,38 | 0,63 | -5,40 | 0,3290 | -0,0208 | |||
| ELS / Equity LifeStyle Properties, Inc. | 0,01 | -2,26 | 0,63 | -9,74 | 0,3285 | -0,0375 | |||
| MPC / Marathon Petroleum Corporation | 0,00 | -2,70 | 0,61 | 10,91 | 0,3181 | 0,0294 | |||
| NBIX / Neurocrine Biosciences, Inc. | 0,00 | -2,68 | 0,61 | 10,51 | 0,3181 | 0,0285 | |||
| PINS / Pinterest, Inc. | 0,02 | -2,81 | 0,60 | 12,50 | 0,3144 | 0,0329 | |||
| GLPI / Gaming and Leisure Properties, Inc. | 0,01 | -2,31 | 0,60 | -10,43 | 0,3133 | -0,0388 | |||
| CUBE / CubeSmart | 0,01 | -2,45 | 0,60 | -2,93 | 0,3108 | -0,0115 | |||
| NXPI / NXP Semiconductors N.V. | 0,00 | -2,60 | 0,58 | 11,95 | 0,3028 | 0,0306 | |||
| SBAC / SBA Communications Corporation | 0,00 | -2,42 | 0,58 | 4,15 | 0,3007 | 0,0101 | |||
| HST / Host Hotels & Resorts, Inc. | 0,04 | -2,63 | 0,56 | 5,25 | 0,2922 | 0,0127 | |||
| OC / Owens Corning | 0,00 | -2,56 | 0,52 | -6,27 | 0,2729 | -0,0199 | |||
| BBY / Best Buy Co., Inc. | 0,01 | -2,65 | 0,52 | -11,22 | 0,2719 | -0,0364 | |||
| AKAM / Akamai Technologies, Inc. | 0,01 | -2,79 | 0,46 | -3,77 | 0,2399 | -0,0109 | |||
| CAG / Conagra Brands, Inc. | 0,02 | -2,50 | 0,44 | -25,08 | 0,2302 | -0,0795 | |||
| AMT / American Tower Corporation | 0,00 | 0,38 | 0,1968 | 0,1968 | |||||
| VICI / VICI Properties Inc. | 0,01 | -2,21 | 0,37 | -2,14 | 0,1908 | -0,0057 | |||
| EQIX / Equinix, Inc. | 0,00 | 0,32 | 0,1674 | 0,1674 | |||||
| ADC / Agree Realty Corporation | 0,00 | -2,23 | 0,32 | -7,25 | 0,1667 | -0,0147 | |||
| RAL / Ralliant Corporation | 0,01 | 0,32 | 0,1656 | 0,1656 | |||||
| KIM / Kimco Realty Corporation | 0,01 | -2,39 | 0,31 | -3,38 | 0,1637 | -0,0069 | |||
| EIX / Edison International | 0,00 | -100,00 | 0,00 | 0,0000 | |||||
| UHS / Universal Health Services, Inc. | 0,00 | -100,00 | 0,00 | 0,0000 | |||||
| DAL / Delta Air Lines, Inc. | 0,00 | -100,00 | 0,00 | 0,0000 | |||||
| BAX / Baxter International Inc. | 0,00 | -100,00 | 0,00 | 0,0000 | |||||
| APO / Apollo Global Management, Inc. | 0,00 | -100,00 | 0,00 | 0,0000 | |||||
| DASH / DoorDash, Inc. | 0,00 | -100,00 | 0,00 | 0,0000 | |||||
| EQR / Equity Residential | 0,00 | -100,00 | 0,00 | 0,0000 | |||||
| XYZ / Block, Inc. | 0,00 | -100,00 | 0,00 | 0,0000 | |||||
| NRG / NRG Energy, Inc. | 0,00 | -100,00 | 0,00 | 0,0000 | |||||
| STAG / STAG Industrial, Inc. | 0,00 | -100,00 | 0,00 | 0,0000 | |||||
| DFS / Discover Financial Services | 0,00 | -100,00 | 0,00 | 0,0000 | |||||
| DELL / Dell Technologies Inc. | 0,00 | -100,00 | 0,00 | 0,0000 | |||||
| TEVA / Teva Pharmaceutical Industries Limited - Depositary Receipt (Common Stock) | 0,00 | -100,00 | 0,00 | 0,0000 |