Statistiques de base
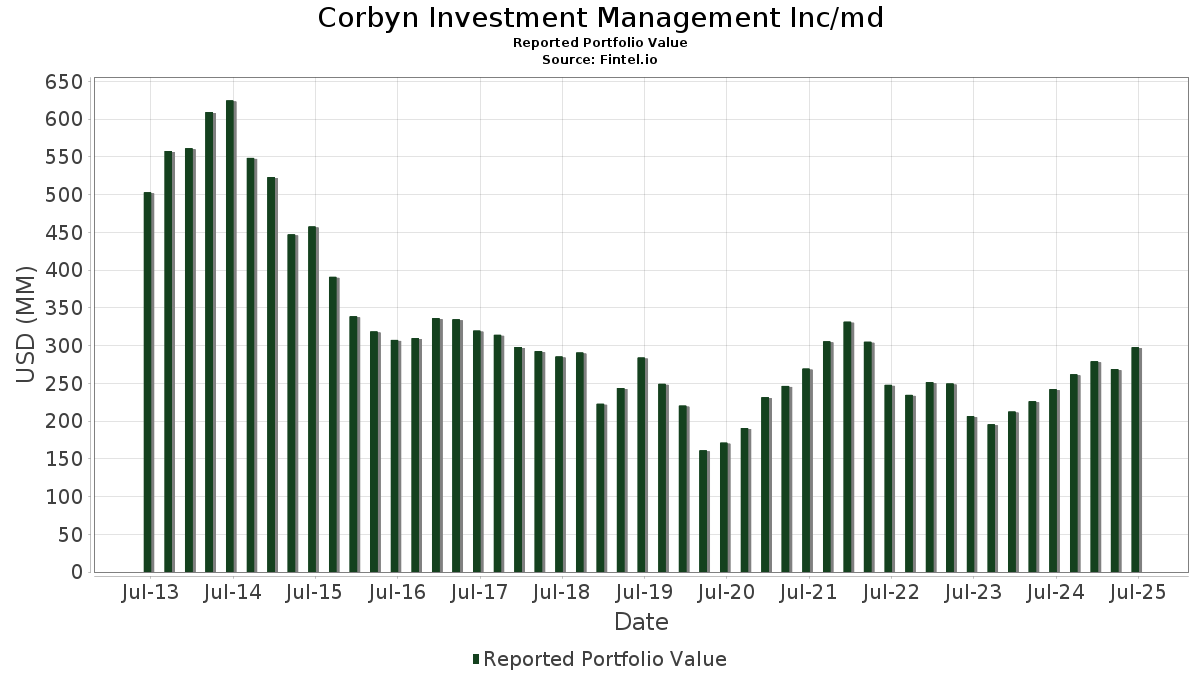
| Valeur du portefeuille | $ 297 682 959 |
| Positions actuelles | 63 |
Dernières positions, performances, ASG (à partir des dépôts 13F, 13D)
Corbyn Investment Management Inc/md a déclaré un total de 63 positions dans ses derniers dépôts auprès de la SEC. La valeur la plus récente du portefeuille est calculée à 297 682 959 USD. Les actifs sous gestion réels (ASG) sont cette valeur plus les liquidités (qui ne sont pas divulguées). Les principales positions de Corbyn Investment Management Inc/md sont Republic Services, Inc. (US:RSG) , EMCOR Group, Inc. (US:EME) , Blackstone Mortgage Trust Inc (US:US09257WAE03) , fuboTV Inc (US:US35953DAB01) , and MYR Group Inc. (US:MYRG) . Les nouvelles positions de Corbyn Investment Management Inc/md incluent Blackstone Mortgage Trust Inc (US:US09257WAE03) , fuboTV Inc (US:US35953DAB01) , Pebblebrook Hotel Trust (US:US70509VAA89) , PENNYMAC CORP (US:US70932AAF03) , and Redfin Corp (US:US75737FAE88) .
Meilleures augmentations ce trimestre
Nous utilisons la variation de l'allocation du portefeuille car il s'agit de l'indicateur le plus significatif. Les changements peuvent être dus à des transactions ou à des variations de prix des actions.
| Titre | Actions (en millions) |
Valeur ($ en millions) |
% du portefeuille | ΔPortefeuille % |
|---|---|---|---|---|
| 10,33 | 3,4707 | 3,3444 | ||
| 9,85 | 3,3099 | 3,3099 | ||
| 15,05 | 5,0547 | 2,3712 | ||
| 0,08 | 14,58 | 4,8985 | 1,4219 | |
| 0,04 | 20,08 | 6,7450 | 1,4062 | |
| 15,24 | 5,1208 | 0,6523 | ||
| 0,10 | 10,16 | 3,4118 | 0,5174 | |
| 0,07 | 3,74 | 1,2551 | 0,3333 | |
| 0,08 | 4,57 | 1,5357 | 0,2094 | |
| 0,00 | 0,57 | 0,1906 | 0,1906 |
Principales baisses ce trimestre
Nous utilisons la variation de l'allocation du portefeuille car il s'agit de l'indicateur le plus significatif. Les changements peuvent être dus à des transactions ou à des variations de prix des actions.
| Titre | Actions (en millions) |
Valeur ($ en millions) |
% du portefeuille | ΔPortefeuille % |
|---|---|---|---|---|
| 5,22 | 1,7522 | -3,6824 | ||
| 0,37 | 10,86 | 3,6488 | -1,2128 | |
| 0,09 | 21,93 | 7,3672 | -1,1684 | |
| 0,29 | 13,70 | 4,6008 | -0,7479 | |
| 0,02 | 4,78 | 1,6072 | -0,7101 | |
| 0,09 | 5,91 | 1,9838 | -0,4196 | |
| 0,01 | 3,94 | 1,3251 | -0,4138 | |
| 0,03 | 3,01 | 1,0126 | -0,3558 | |
| 0,04 | 4,97 | 1,6694 | -0,3294 | |
| 0,02 | 2,08 | 0,6978 | -0,3191 |
Déclarations 13F et dépôts de fonds
Ce formulaire a été déposé le 2025-08-08 pour la période de déclaration 2025-06-30. Cliquez sur l'icône du lien pour voir l'historique complet des transactions.
Mettre à niveau pour débloquer les données premium et exporter vers Excel ![]() .
.
| Titre | Type | Prix moyen de l'action | Actions (en millions) |
ΔActions (%) |
ΔActions (%) |
Valeur ($ en millions) |
Portefeuille (%) |
ΔPortefeuille (%) |
|
|---|---|---|---|---|---|---|---|---|---|
| RSG / Republic Services, Inc. | 0,09 | -6,07 | 21,93 | -4,34 | 7,3672 | -1,1684 | |||
| EME / EMCOR Group, Inc. | 0,04 | -3,24 | 20,08 | 40,02 | 6,7450 | 1,4062 | |||
| US09257WAE03 / Blackstone Mortgage Trust Inc | 15,24 | 27,00 | 5,1208 | 0,6523 | |||||
| US35953DAB01 / fuboTV Inc | 15,05 | 108,78 | 5,0547 | 2,3712 | |||||
| MYRG / MYR Group Inc. | 0,08 | -2,67 | 14,58 | 56,17 | 4,8985 | 1,4219 | |||
| US70509VAA89 / Pebblebrook Hotel Trust | 13,76 | 5,07 | 4,6231 | -0,2537 | |||||
| KBR / KBR, Inc. | 0,29 | -0,95 | 13,70 | -4,67 | 4,6008 | -0,7479 | |||
| PRMB / Primo Brands Corporation | 0,37 | -0,33 | 10,86 | -16,82 | 3,6488 | -1,2128 | |||
| US70932AAF03 / PENNYMAC CORP | 10,33 | 2 947,49 | 3,4707 | 3,3444 | |||||
| JCI / Johnson Controls International plc | 0,10 | -0,91 | 10,16 | 30,64 | 3,4118 | 0,5174 | |||
| US75737FAE88 / Redfin Corp | 9,85 | 3,3099 | 3,3099 | ||||||
| WRB / W. R. Berkley Corporation | 0,13 | -1,12 | 9,54 | 2,10 | 3,2062 | -0,2745 | |||
| GOOG / Alphabet Inc. | 0,05 | -1,89 | 8,52 | 11,42 | 2,8621 | 0,0147 | |||
| US83304AAF30 / CONVERTIBLE ZERO | 6,32 | -0,44 | 2,1217 | -0,2401 | |||||
| DD / DuPont de Nemours, Inc. | 0,09 | -0,40 | 5,91 | -8,52 | 1,9838 | -0,4196 | |||
| US25402DAB82 / CONVERTIBLE ZERO | 5,22 | -64,27 | 1,7522 | -3,6824 | |||||
| ALIT / Alight, Inc. | 0,91 | 7,65 | 5,15 | 2,74 | 1,7290 | -0,1360 | |||
| EOG / EOG Resources, Inc. | 0,04 | -0,75 | 4,97 | -7,43 | 1,6694 | -0,3294 | |||
| TMUS / T-Mobile US, Inc. | 0,02 | -13,95 | 4,78 | -23,12 | 1,6072 | -0,7101 | |||
| V / Visa Inc. | 0,01 | -3,09 | 4,68 | -1,83 | 1,5706 | -0,2024 | |||
| AMZN / Amazon.com, Inc. | 0,02 | -1,61 | 4,64 | 13,45 | 1,5583 | 0,0360 | |||
| NXT / Nextracker Inc. | 0,08 | -0,54 | 4,57 | 28,33 | 1,5357 | 0,2094 | |||
| LEVI / Levi Strauss & Co. | 0,23 | -2,55 | 4,31 | 15,56 | 1,4495 | 0,0595 | |||
| ZD / Ziff Davis, Inc. | 0,14 | 19,00 | 4,09 | -4,15 | 1,3750 | -0,2149 | |||
| CB / Chubb Limited | 0,01 | -11,97 | 3,94 | -15,55 | 1,3251 | -0,4138 | |||
| FLEX / Flex Ltd. | 0,07 | 0,00 | 3,74 | 50,95 | 1,2551 | 0,3333 | |||
| KVUE / Kenvue Inc. | 0,18 | 3,49 | 3,68 | -9,67 | 1,2370 | -0,2808 | |||
| NEE / NextEra Energy, Inc. | 0,05 | -0,31 | 3,63 | -2,39 | 1,2203 | -0,1651 | |||
| AMH / American Homes 4 Rent | 0,10 | -0,83 | 3,60 | -5,38 | 1,2104 | -0,2076 | |||
| EMR / Emerson Electric Co. | 0,03 | 0,18 | 3,59 | 21,81 | 1,2066 | 0,1089 | |||
| DOX / Amdocs Limited | 0,04 | -1,34 | 3,50 | -1,63 | 1,1753 | -0,1487 | |||
| MDT / Medtronic plc | 0,04 | -4,88 | 3,37 | -7,70 | 1,1308 | -0,2274 | |||
| BLKB / Blackbaud, Inc. | 0,05 | 11,41 | 3,18 | 15,28 | 1,0695 | 0,0414 | |||
| FRST / Primis Financial Corp. | 0,29 | -5,19 | 3,16 | 5,30 | 1,0606 | -0,0558 | |||
| ZBH / Zimmer Biomet Holdings, Inc. | 0,03 | 1,77 | 3,01 | -17,99 | 1,0126 | -0,3558 | |||
| SHBI / Shore Bancshares, Inc. | 0,16 | -0,07 | 2,48 | 16,03 | 0,8319 | 0,0372 | |||
| TFX / Teleflex Incorporated | 0,02 | -11,21 | 2,08 | -23,95 | 0,6978 | -0,3191 | |||
| WH / Wyndham Hotels & Resorts, Inc. | 0,02 | 0,27 | 1,99 | -10,02 | 0,6695 | -0,1553 | |||
| USFD / US Foods Holding Corp. | 0,02 | 0,00 | 1,90 | 17,63 | 0,6367 | 0,0369 | |||
| WMS / Advanced Drainage Systems, Inc. | 0,02 | 2,38 | 1,86 | 8,27 | 0,6246 | -0,0150 | |||
| WSFS / WSFS Financial Corporation | 0,03 | -0,21 | 1,85 | 5,83 | 0,6224 | -0,0295 | |||
| MTX / Minerals Technologies Inc. | 0,03 | 0,00 | 1,68 | -13,34 | 0,5631 | -0,1573 | |||
| NVT / nVent Electric plc | 0,02 | 0,00 | 1,67 | 39,78 | 0,5607 | 0,1160 | |||
| SHW / The Sherwin-Williams Company | 0,00 | -0,93 | 1,50 | -2,60 | 0,5045 | -0,0695 | |||
| RUSHA / Rush Enterprises, Inc. | 0,03 | 0,92 | 1,45 | -2,63 | 0,4855 | -0,0673 | |||
| UPS / United Parcel Service, Inc. | 0,01 | -2,49 | 1,42 | -10,55 | 0,4787 | -0,1141 | |||
| ABT / Abbott Laboratories | 0,01 | -8,78 | 1,41 | -6,43 | 0,4740 | -0,0876 | |||
| CDRE / Cadre Holdings, Inc. | 0,04 | 2,19 | 1,35 | 10,01 | 0,4542 | -0,0038 | |||
| AKAM / Akamai Technologies, Inc. | 0,01 | 0,00 | 1,13 | -0,88 | 0,3804 | -0,0451 | |||
| RUSHB / Rush Enterprises, Inc. | 0,02 | 0,00 | 0,91 | -7,15 | 0,3055 | -0,0591 | |||
| PSTG / Pure Storage, Inc. | 0,01 | 7,48 | 0,77 | 39,85 | 0,2570 | 0,0533 | |||
| US405024AB67 / Haemonetics Corp | 0,72 | 3,16 | 0,2415 | -0,0179 | |||||
| CNNE / Cannae Holdings, Inc. | 0,03 | 0,00 | 0,64 | 13,75 | 0,2143 | 0,0055 | |||
| DAR / Darling Ingredients Inc. | 0,02 | -45,11 | 0,62 | -33,33 | 0,2084 | -0,1381 | |||
| ROP / Roper Technologies, Inc. | 0,00 | 0,57 | 0,1906 | 0,1906 | |||||
| OCFC / OceanFirst Financial Corp. | 0,03 | 0,00 | 0,53 | 3,53 | 0,1775 | -0,0125 | |||
| JNJ / Johnson & Johnson | 0,00 | -0,32 | 0,48 | -8,24 | 0,1610 | -0,0333 | |||
| VGT / Vanguard World Fund - Vanguard Information Technology ETF | 0,00 | -2,54 | 0,46 | 18,96 | 0,1542 | 0,0108 | |||
| PSX / Phillips 66 | 0,00 | 0,00 | 0,41 | -3,30 | 0,1379 | -0,0203 | |||
| AVGO / Broadcom Inc. | 0,00 | 0,00 | 0,39 | 64,68 | 0,1303 | 0,0426 | |||
| MSFT / Microsoft Corporation | 0,00 | -0,73 | 0,34 | 31,52 | 0,1136 | 0,0179 | |||
| KO / The Coca-Cola Company | 0,00 | -0,62 | 0,23 | -1,73 | 0,0763 | -0,0098 | |||
| SHLS / Shoals Technologies Group, Inc. | 0,05 | -64,19 | 0,22 | -54,26 | 0,0724 | -0,1027 | |||
| TAN / Invesco Exchange-Traded Fund Trust II - Invesco Solar ETF | 0,00 | -100,00 | 0,00 | 0,0000 | |||||
| DNB / Dun & Bradstreet Holdings, Inc. | 0,00 | -100,00 | 0,00 | 0,0000 |