Statistiques de base
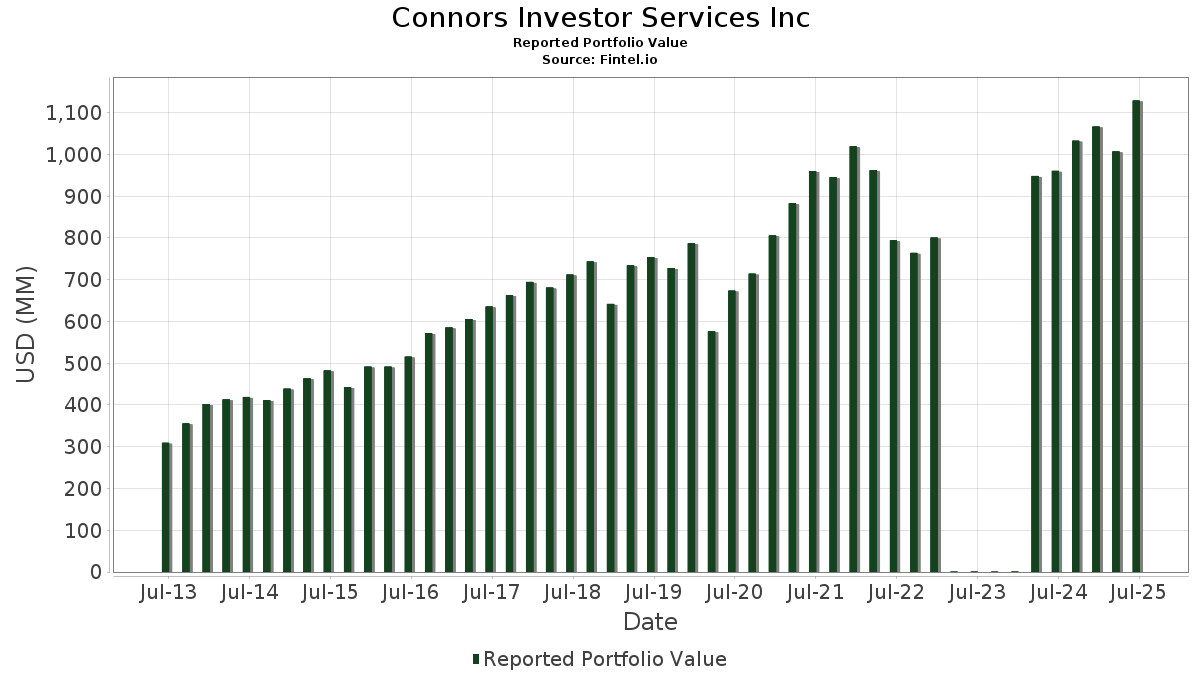
| Valeur du portefeuille | $ 1 129 127 343 |
| Positions actuelles | 156 |
Dernières positions, performances, ASG (à partir des dépôts 13F, 13D)
Connors Investor Services Inc a déclaré un total de 156 positions dans ses derniers dépôts auprès de la SEC. La valeur la plus récente du portefeuille est calculée à 1 129 127 343 USD. Les actifs sous gestion réels (ASG) sont cette valeur plus les liquidités (qui ne sont pas divulguées). Les principales positions de Connors Investor Services Inc sont Palantir Technologies Inc. (US:PLTR) , SPDR S&P 500 ETF (US:SPY) , Apple Inc. (US:AAPL) , NVIDIA Corporation (US:NVDA) , and Microsoft Corporation (US:MSFT) . Les nouvelles positions de Connors Investor Services Inc incluent The Charles Schwab Corporation (US:SCHW) , Tapestry, Inc. (US:TPR) , Phreesia, Inc. (US:PHR) , Frontdoor, Inc. (US:FTDR) , and Vanguard Bond Index Funds - Vanguard Total Bond Market ETF (US:BND) .
Meilleures augmentations ce trimestre
Nous utilisons la variation de l'allocation du portefeuille car il s'agit de l'indicateur le plus significatif. Les changements peuvent être dus à des transactions ou à des variations de prix des actions.
| Titre | Actions (en millions) |
Valeur ($ en millions) |
% du portefeuille | ΔPortefeuille % |
|---|---|---|---|---|
| 0,81 | 110,68 | 9,8021 | 2,7835 | |
| 0,17 | 15,57 | 1,3787 | 1,3787 | |
| 0,12 | 11,51 | 1,0196 | 0,9830 | |
| 0,12 | 10,66 | 0,9443 | 0,9443 | |
| 0,09 | 10,88 | 0,9632 | 0,9249 | |
| 0,22 | 34,68 | 3,0715 | 0,7021 | |
| 0,05 | 19,42 | 1,7201 | 0,3966 | |
| 0,06 | 22,86 | 2,0245 | 0,3915 | |
| 0,05 | 14,32 | 1,2685 | 0,3386 | |
| 0,03 | 8,01 | 0,7093 | 0,3026 |
Principales baisses ce trimestre
Nous utilisons la variation de l'allocation du portefeuille car il s'agit de l'indicateur le plus significatif. Les changements peuvent être dus à des transactions ou à des variations de prix des actions.
| Titre | Actions (en millions) |
Valeur ($ en millions) |
% du portefeuille | ΔPortefeuille % |
|---|---|---|---|---|
| 0,00 | 0,26 | 0,0232 | -1,7445 | |
| 0,17 | 35,72 | 3,1637 | -0,7459 | |
| 0,14 | 17,97 | 1,5912 | -0,4526 | |
| 0,02 | 15,00 | 1,3288 | -0,4452 | |
| 0,09 | 21,56 | 1,9092 | -0,4060 | |
| 0,17 | 24,29 | 2,1512 | -0,3705 | |
| 0,08 | 14,71 | 1,3032 | -0,3607 | |
| 0,07 | 10,55 | 0,9342 | -0,2921 | |
| 0,06 | 18,69 | 1,6551 | -0,2811 | |
| 0,35 | 14,93 | 1,3226 | -0,2629 |
Déclarations 13F et dépôts de fonds
Ce formulaire a été déposé le 2025-07-30 pour la période de déclaration 2025-06-30. Cliquez sur l'icône du lien pour voir l'historique complet des transactions.
Mettre à niveau pour débloquer les données premium et exporter vers Excel ![]() .
.
| Titre | Type | Prix moyen de l'action | Actions (en millions) |
ΔActions (%) |
ΔActions (%) |
Valeur ($ en millions) |
Portefeuille (%) |
ΔPortefeuille (%) |
|
|---|---|---|---|---|---|---|---|---|---|
| PLTR / Palantir Technologies Inc. | 0,81 | -3,07 | 110,68 | 56,56 | 9,8021 | 2,7835 | |||
| SPY / SPDR S&P 500 ETF | 0,08 | -3,44 | 48,62 | 6,66 | 4,3059 | -0,2199 | |||
| AAPL / Apple Inc. | 0,17 | -1,79 | 35,72 | -9,29 | 3,1637 | -0,7459 | |||
| NVDA / NVIDIA Corporation | 0,22 | -0,33 | 34,68 | 45,32 | 3,0715 | 0,7021 | |||
| MSFT / Microsoft Corporation | 0,07 | -18,36 | 32,71 | 8,22 | 2,8971 | -0,1039 | |||
| AMZN / Amazon.com, Inc. | 0,13 | 1,03 | 29,54 | 16,52 | 2,6159 | 0,0991 | |||
| MS / Morgan Stanley | 0,17 | -20,81 | 24,29 | -4,37 | 2,1512 | -0,3705 | |||
| META / Meta Platforms, Inc. | 0,03 | 0,08 | 22,91 | 28,16 | 2,0286 | 0,2542 | |||
| ETN / Eaton Corporation plc | 0,06 | 5,79 | 22,86 | 38,98 | 2,0245 | 0,3915 | |||
| DASH / DoorDash, Inc. | 0,09 | -31,46 | 21,56 | -7,56 | 1,9092 | -0,4060 | |||
| RTX / RTX Corporation | 0,14 | -2,01 | 20,88 | 8,07 | 1,8489 | -0,0690 | |||
| ABT / Abbott Laboratories | 0,15 | -2,57 | 20,62 | -0,10 | 1,8264 | -0,2231 | |||
| PANW / Palo Alto Networks, Inc. | 0,10 | -1,10 | 19,85 | 18,63 | 1,7582 | 0,0967 | |||
| JPM / JPMorgan Chase & Co. | 0,07 | -2,51 | 19,83 | 15,27 | 1,7561 | 0,0483 | |||
| PWR / Quanta Services, Inc. | 0,05 | -2,05 | 19,42 | 45,69 | 1,7201 | 0,3966 | |||
| COST / Costco Wholesale Corporation | 0,02 | 0,45 | 19,25 | 5,19 | 1,7045 | -0,1120 | |||
| CB / Chubb Limited | 0,06 | -0,11 | 18,69 | -4,17 | 1,6551 | -0,2811 | |||
| LIN / Linde plc | 0,04 | 23,59 | 18,31 | 24,53 | 1,6216 | 0,1618 | |||
| CSCO / Cisco Systems, Inc. | 0,26 | 20,08 | 18,30 | 35,09 | 1,6206 | 0,2757 | |||
| PEP / PepsiCo, Inc. | 0,14 | -0,89 | 17,97 | -12,72 | 1,5912 | -0,4526 | |||
| GOOGL / Alphabet Inc. | 0,10 | -1,03 | 17,91 | 12,80 | 1,5865 | 0,0097 | |||
| WFC / Wells Fargo & Company | 0,22 | -1,01 | 17,55 | 10,53 | 1,5541 | -0,0221 | |||
| DD / DuPont de Nemours, Inc. | 0,24 | 23,13 | 16,44 | 13,09 | 1,4564 | 0,0128 | |||
| IWM / iShares Trust - iShares Russell 2000 ETF | 0,08 | -11,75 | 16,35 | -4,54 | 1,4481 | -0,2524 | |||
| LOW / Lowe's Companies, Inc. | 0,07 | -0,13 | 15,94 | -5,00 | 1,4118 | -0,2541 | |||
| ORCL / Oracle Corporation | 0,07 | -23,18 | 15,60 | 20,14 | 1,3816 | 0,0924 | |||
| SCHW / The Charles Schwab Corporation | 0,17 | 15,57 | 1,3787 | 1,3787 | |||||
| V / Visa Inc. | 0,04 | -1,29 | 15,39 | 0,08 | 1,3633 | -0,1638 | |||
| TJX / The TJX Companies, Inc. | 0,12 | -4,65 | 15,26 | -3,33 | 1,3516 | -0,2157 | |||
| CRM / Salesforce, Inc. | 0,06 | 25,93 | 15,26 | 28,00 | 1,3514 | 0,1679 | |||
| WELL / Welltower Inc. | 0,10 | 0,95 | 15,16 | 1,30 | 1,3428 | -0,1433 | |||
| LLY / Eli Lilly and Company | 0,02 | -11,03 | 15,00 | -16,03 | 1,3288 | -0,4452 | |||
| VZ / Verizon Communications Inc. | 0,35 | -1,97 | 14,93 | -6,49 | 1,3226 | -0,2629 | |||
| DOV / Dover Corporation | 0,08 | 25,46 | 14,91 | 30,85 | 1,3203 | 0,1892 | |||
| ABBV / AbbVie Inc. | 0,08 | -0,97 | 14,71 | -12,20 | 1,3032 | -0,3607 | |||
| WMB / The Williams Companies, Inc. | 0,23 | 1,75 | 14,40 | 6,95 | 1,2753 | -0,0615 | |||
| AVGO / Broadcom Inc. | 0,05 | -7,19 | 14,32 | 52,91 | 1,2685 | 0,3386 | |||
| SYK / Stryker Corporation | 0,04 | -1,50 | 14,28 | 4,71 | 1,2645 | -0,0893 | |||
| KO / The Coca-Cola Company | 0,18 | 2,40 | 12,60 | 1,25 | 1,1163 | -0,1198 | |||
| MDT / Medtronic plc | 0,14 | 0,46 | 12,59 | -2,49 | 1,1149 | -0,1669 | |||
| NEE / NextEra Energy, Inc. | 0,18 | -0,69 | 12,28 | -2,66 | 1,0874 | -0,1650 | |||
| WMT / Walmart Inc. | 0,12 | 2 703,33 | 11,51 | 3 028,26 | 1,0196 | 0,9830 | |||
| DUKH / Northern Lights Fund Trust - Ocean Park High Income ETF | 0,09 | 2 808,49 | 10,88 | 2 717,62 | 0,9632 | 0,9249 | |||
| TPR / Tapestry, Inc. | 0,12 | 10,66 | 0,9443 | 0,9443 | |||||
| CVX / Chevron Corporation | 0,07 | -0,30 | 10,55 | -14,60 | 0,9342 | -0,2921 | |||
| GOLDMAN SACHS GQG PARTNERS INTERNATIONAL / (38147N293) | 0,44 | 9,98 | 0,0000 | ||||||
| VERSX / Vanguard Emerging Markets Stock Index Fund | 0,19 | 3,41 | 9,26 | 13,00 | 0,8199 | 0,0066 | |||
| UNH / UnitedHealth Group Incorporated | 0,03 | 227,29 | 8,01 | 95,53 | 0,7093 | 0,3026 | |||
| RBLX / Roblox Corporation | 0,08 | -19,57 | 7,95 | 45,15 | 0,7044 | 0,1604 | |||
| PLD / Prologis, Inc. | 0,07 | -0,26 | 7,15 | -6,20 | 0,6328 | -0,1235 | |||
| EFA / iShares Trust - iShares MSCI EAFE ETF | 0,07 | 7,18 | 6,62 | 17,22 | 0,5865 | 0,0257 | |||
| TYL / Tyler Technologies, Inc. | 0,01 | 2,32 | 5,18 | 4,33 | 0,4585 | -0,0341 | |||
| CALX / Calix, Inc. | 0,09 | -14,21 | 4,68 | 28,76 | 0,4144 | 0,0536 | |||
| GQG PARTNERS EMERGING MARKETS EQUITY / (00771X427) | 0,25 | 4,32 | 0,0000 | ||||||
| TRUP / Trupanion, Inc. | 0,08 | -0,09 | 4,19 | 48,37 | 0,3714 | 0,0908 | |||
| STRL / Sterling Infrastructure, Inc. | 0,02 | -1,23 | 3,98 | 101,37 | 0,3522 | 0,1561 | |||
| AORT / Artivion, Inc. | 0,13 | -0,36 | 3,93 | 26,07 | 0,3482 | 0,0386 | |||
| VRNS / Varonis Systems, Inc. | 0,07 | -0,22 | 3,71 | 25,18 | 0,3290 | 0,0344 | |||
| COP / ConocoPhillips | 0,04 | -6,58 | 3,70 | -20,18 | 0,3276 | -0,1325 | |||
| GDOT / Green Dot Corporation | 0,34 | 23,02 | 3,62 | 57,16 | 0,3207 | 0,0919 | |||
| ZETA / Zeta Global Holdings Corp. | 0,23 | 26,87 | 3,61 | 44,96 | 0,3196 | 0,0724 | |||
| HCSG / Healthcare Services Group, Inc. | 0,23 | -14,44 | 3,46 | 27,55 | 0,3063 | 0,0371 | |||
| GJR / Strats Trust For Procter & Gambel Security - Preferred Security | 0,02 | -5,63 | 3,27 | -11,66 | 0,2900 | -0,0780 | |||
| IMAX / IMAX Corporation | 0,12 | -19,96 | 3,25 | -15,09 | 0,2882 | -0,0922 | |||
| AMRC / Ameresco, Inc. | 0,21 | -5,18 | 3,21 | 19,24 | 0,2844 | 0,0170 | |||
| NVEE / NV5 Global, Inc. | 0,14 | -0,07 | 3,20 | 19,75 | 0,2836 | 0,0181 | |||
| AX / Axos Financial, Inc. | 0,04 | 0,21 | 3,04 | 18,08 | 0,2697 | 0,0137 | |||
| SMTC / Semtech Corporation | 0,06 | 34,86 | 2,91 | 76,91 | 0,2580 | 0,0946 | |||
| CLBT / Cellebrite DI Ltd. | 0,18 | 26,59 | 2,88 | 4,23 | 0,2555 | -0,0193 | |||
| HSTM / HealthStream, Inc. | 0,10 | -0,34 | 2,87 | -14,30 | 0,2542 | -0,0783 | |||
| CYBR / CyberArk Software Ltd. | 0,01 | -21,24 | 2,81 | -5,20 | 0,2489 | -0,0454 | |||
| OMCL / Omnicell, Inc. | 0,09 | 25,56 | 2,76 | 5,62 | 0,2447 | -0,0151 | |||
| AIN / Albany International Corp. | 0,04 | 40,00 | 2,73 | 42,25 | 0,2415 | 0,0511 | |||
| CRDO / Credo Technology Group Holding Ltd | 0,03 | -23,07 | 2,72 | 77,44 | 0,2411 | 0,0887 | |||
| AVAV / AeroVironment, Inc. | 0,01 | -36,33 | 2,71 | 52,22 | 0,2396 | 0,0631 | |||
| GMRE / Global Medical REIT Inc. | 0,38 | 40,75 | 2,67 | 11,45 | 0,2362 | -0,0013 | |||
| UMH / UMH Properties, Inc. | 0,16 | 26,92 | 2,61 | 13,98 | 0,2311 | 0,0038 | |||
| PBH / Prestige Consumer Healthcare Inc. | 0,03 | -0,48 | 2,59 | -7,56 | 0,2297 | -0,0489 | |||
| EEFT / Euronet Worldwide, Inc. | 0,03 | 1 163,75 | 2,56 | 1 102,82 | 0,2269 | 0,2057 | |||
| SFNC / Simmons First National Corporation | 0,13 | 29,49 | 2,53 | 19,61 | 0,2242 | 0,0140 | |||
| FRPT / Freshpet, Inc. | 0,04 | 52,96 | 2,52 | 25,02 | 0,2235 | 0,0230 | |||
| OGS / ONE Gas, Inc. | 0,03 | -15,24 | 2,45 | -19,41 | 0,2166 | -0,0847 | |||
| BV / BrightView Holdings, Inc. | 0,14 | -0,09 | 2,34 | 29,57 | 0,2073 | 0,0279 | |||
| PHR / Phreesia, Inc. | 0,08 | 2,31 | 0,2046 | 0,2046 | |||||
| HRMY / Harmony Biosciences Holdings, Inc. | 0,07 | 0,28 | 2,31 | -4,55 | 0,2043 | -0,0356 | |||
| FTDR / Frontdoor, Inc. | 0,04 | 2,27 | 0,2010 | 0,2010 | |||||
| POR / Portland General Electric Company | 0,06 | 24,05 | 2,25 | 13,02 | 0,1992 | 0,0016 | |||
| IJH / iShares Trust - iShares Core S&P Mid-Cap ETF | 0,03 | 24,02 | 2,08 | 31,88 | 0,1843 | 0,0276 | |||
| SMPL / The Simply Good Foods Company | 0,06 | 0,12 | 1,96 | -8,29 | 0,1734 | -0,0386 | |||
| IOSP / Innospec Inc. | 0,02 | -0,22 | 1,81 | -11,43 | 0,1606 | -0,0427 | |||
| HLMN / Hillman Solutions Corp. | 0,22 | -1,25 | 1,58 | -19,82 | 0,1402 | -0,0557 | |||
| THRM / Gentherm Incorporated | 0,05 | -0,61 | 1,44 | 5,13 | 0,1271 | -0,0084 | |||
| T / AT&T Inc. | 0,05 | 1,73 | 1,40 | 3,93 | 0,1242 | -0,0097 | |||
| SM / SM Energy Company | 0,06 | -0,01 | 1,37 | -17,55 | 0,1216 | -0,0436 | |||
| SLYG / SPDR Series Trust - SPDR S&P 600 Small Cap Growth ETF | 0,01 | -0,44 | 0,91 | 6,56 | 0,0806 | -0,0043 | |||
| YUM / Yum! Brands, Inc. | 0,01 | 0,00 | 0,86 | -5,81 | 0,0761 | -0,0145 | |||
| CFLT / Confluent, Inc. | 0,03 | 0,00 | 0,75 | 6,26 | 0,0662 | -0,0036 | |||
| ADP / Automatic Data Processing, Inc. | 0,00 | -1,67 | 0,63 | -0,78 | 0,0562 | -0,0073 | |||
| XOM / Exxon Mobil Corporation | 0,01 | 0,00 | 0,63 | -9,47 | 0,0560 | -0,0133 | |||
| IJR / iShares Trust - iShares Core S&P Small-Cap ETF | 0,01 | 143,90 | 0,62 | 155,14 | 0,0550 | 0,0308 | |||
| YUMC / Yum China Holdings, Inc. | 0,01 | 0,00 | 0,58 | -14,05 | 0,0515 | -0,0157 | |||
| MCD / McDonald's Corporation | 0,00 | 0,00 | 0,54 | -6,45 | 0,0476 | -0,0095 | |||
| MDY / SPDR S&P MidCap 400 ETF Trust | 0,00 | 0,00 | 0,52 | 6,15 | 0,0459 | -0,0026 | |||
| PNC / The PNC Financial Services Group, Inc. | 0,00 | 0,00 | 0,52 | 5,95 | 0,0458 | -0,0026 | |||
| JNJ / Johnson & Johnson | 0,00 | -7,94 | 0,50 | -16,50 | 0,0444 | -0,0153 | |||
| HD / The Home Depot, Inc. | 0,00 | 0,00 | 0,48 | 0,00 | 0,0424 | -0,0051 | |||
| CMG / Chipotle Mexican Grill, Inc. | 0,01 | 0,00 | 0,45 | 11,97 | 0,0398 | -0,0001 | |||
| CL / Colgate-Palmolive Company | 0,00 | -2,39 | 0,41 | -5,10 | 0,0362 | -0,0067 | |||
| BRK.B / Berkshire Hathaway Inc. | 0,00 | 0,00 | 0,39 | -8,92 | 0,0344 | -0,0079 | |||
| MRK / Merck & Co., Inc. | 0,00 | -2,55 | 0,38 | -14,12 | 0,0335 | -0,0102 | |||
| KMB / Kimberly-Clark Corporation | 0,00 | -3,30 | 0,38 | -12,33 | 0,0335 | -0,0093 | |||
| LAD / Lithia Motors, Inc. | 0,00 | 0,00 | 0,36 | 15,21 | 0,0316 | 0,0008 | |||
| MTB / M&T Bank Corporation | 0,00 | 0,00 | 0,33 | 8,55 | 0,0293 | -0,0010 | |||
| PSA / Public Storage | 0,00 | 0,00 | 0,33 | -1,80 | 0,0290 | -0,0042 | |||
| VOO / Vanguard Index Funds - Vanguard S&P 500 ETF | 0,00 | 0,00 | 0,32 | 10,58 | 0,0288 | -0,0004 | |||
| QCOM / QUALCOMM Incorporated | 0,00 | -2,54 | 0,30 | 3,40 | 0,0270 | -0,0022 | |||
| OPRX / OptimizeRx Corporation | 0,02 | -30,11 | 0,30 | 8,79 | 0,0264 | -0,0008 | |||
| UNP / Union Pacific Corporation | 0,00 | -6,64 | 0,29 | -6,13 | 0,0258 | -0,0051 | |||
| CSX / CSX Corporation | 0,01 | 0,00 | 0,29 | 10,73 | 0,0257 | -0,0003 | |||
| AON / Aon plc | 0,00 | 0,00 | 0,29 | -10,66 | 0,0253 | -0,0064 | |||
| CRS / Carpenter Technology Corporation | 0,00 | -9,12 | 0,28 | 39,00 | 0,0246 | 0,0047 | |||
| BND / Vanguard Bond Index Funds - Vanguard Total Bond Market ETF | 0,00 | 0,27 | 0,0240 | 0,0240 | |||||
| OLO / Olo Inc. | 0,03 | -21,04 | 0,27 | 16,38 | 0,0240 | 0,0009 | |||
| AXP / American Express Company | 0,00 | -98,76 | 0,26 | -98,53 | 0,0232 | -1,7445 | |||
| ATROB / Astronics Corporation | 0,01 | -38,59 | 0,26 | -57,75 | 0,0230 | -0,1259 | |||
| PAHC / Phibro Animal Health Corporation | 0,01 | -0,98 | 0,26 | 18,81 | 0,0229 | 0,0012 | |||
| RMD / ResMed Inc. | 0,00 | 0,00 | 0,26 | 15,70 | 0,0228 | 0,0006 | |||
| IBM / International Business Machines Corporation | 0,00 | -14,41 | 0,26 | 4,94 | 0,0226 | -0,0015 | |||
| KRUS / Kura Sushi USA, Inc. | 0,00 | 0,25 | 0,0223 | 0,0223 | |||||
| APOG / Apogee Enterprises, Inc. | 0,01 | 0,24 | 0,0216 | 0,0216 | |||||
| SLP / Simulations Plus, Inc. | 0,01 | 37,35 | 0,24 | -2,49 | 0,0209 | -0,0031 | |||
| HSY / The Hershey Company | 0,00 | 0,00 | 0,23 | -3,02 | 0,0200 | -0,0031 | |||
| BX / Blackstone Inc. | 0,00 | 0,00 | 0,22 | 7,18 | 0,0199 | -0,0009 | |||
| MDXG / MiMedx Group, Inc. | 0,04 | 45,19 | 0,22 | 16,85 | 0,0191 | 0,0008 | |||
| AFL / Aflac Incorporated | 0,00 | -2,46 | 0,21 | -4,91 | 0,0189 | -0,0034 | |||
| ASPN / Aspen Aerogels, Inc. | 0,04 | 74,38 | 0,21 | 62,50 | 0,0184 | 0,0056 | |||
| EPM / Evolution Petroleum Corporation | 0,04 | 0,00 | 0,21 | -9,21 | 0,0184 | -0,0043 | |||
| IIIN / Insteel Industries, Inc. | 0,01 | 0,21 | 0,0183 | 0,0183 | |||||
| NWPX / NWPX Infrastructure, Inc. | 0,01 | 0,00 | 0,21 | -0,49 | 0,0182 | -0,0023 | |||
| GIS / General Mills, Inc. | 0,00 | 0,00 | 0,20 | -13,56 | 0,0181 | -0,0053 | |||
| AIOT / PowerFleet, Inc. | 0,05 | 42,42 | 0,20 | 11,60 | 0,0179 | -0,0000 | |||
| O / Realty Income Corporation | 0,00 | 0,00 | 0,20 | -0,50 | 0,0178 | -0,0023 | |||
| BTBT / Bit Digital, Inc. | 0,09 | 32,35 | 0,20 | 43,80 | 0,0175 | 0,0038 | |||
| TACT / TransAct Technologies Incorporated | 0,05 | 0,00 | 0,19 | -1,57 | 0,0167 | -0,0024 | |||
| CHCT / Community Healthcare Trust Incorporated | 0,01 | 0,00 | 0,19 | -8,78 | 0,0166 | -0,0037 | |||
| PAYS / Paysign, Inc. | 0,03 | -61,43 | 0,19 | 31,69 | 0,0166 | 0,0024 | |||
| INDI / indie Semiconductor, Inc. | 0,05 | 24,39 | 0,18 | 118,07 | 0,0161 | 0,0078 | |||
| IMXI / International Money Express, Inc. | 0,02 | -90,28 | 0,16 | -92,28 | 0,0146 | -0,1962 | |||
| PONAX / Pimco Funds - PIMCO Income Fund Class A | 0,01 | 0,16 | 0,0141 | 0,0141 | |||||
| BLDE / Strata Critical Medical, Inc. | 0,04 | 0,15 | 0,0132 | 0,0132 | |||||
| GAUZ / Gauzy Ltd. | 0,02 | 45,45 | 0,14 | 53,41 | 0,0120 | 0,0032 | |||
| VMEO / Vimeo, Inc. | 0,03 | 68,39 | 0,13 | 30,10 | 0,0119 | 0,0016 | |||
| VBNK / VersaBank | 0,01 | 0,13 | 0,0111 | 0,0111 | |||||
| OABI / OmniAb, Inc. | 0,06 | 24,97 | 0,11 | -10,08 | 0,0096 | -0,0023 | |||
| QRHC / Quest Resource Holding Corporation | 0,05 | 24,98 | 0,10 | -2,88 | 0,0089 | -0,0014 | |||
| MCHT / Mauch Chunk Trust Financial Corp. | 0,01 | 0,00 | 0,07 | -2,99 | 0,0058 | -0,0009 | |||
| WLDN / Willdan Group, Inc. | 0,00 | -100,00 | 0,00 | -100,00 | -0,0255 | ||||
| CLNE / Clean Energy Fuels Corp. | 0,00 | -100,00 | 0,00 | 0,0000 | |||||
| BLFS / BioLife Solutions, Inc. | 0,00 | -100,00 | 0,00 | 0,0000 | |||||
| DIS / The Walt Disney Company | 0,00 | -100,00 | 0,00 | 0,0000 | |||||
| TBRG / TruBridge, Inc. | 0,00 | -100,00 | 0,00 | 0,0000 | |||||
| DFS / Discover Financial Services | 0,00 | -100,00 | 0,00 | 0,0000 | |||||
| RPAY / Repay Holdings Corporation | 0,00 | -100,00 | 0,00 | 0,0000 | |||||
| TMO / Thermo Fisher Scientific Inc. | 0,00 | -100,00 | 0,00 | 0,0000 | |||||
| SWK / Stanley Black & Decker, Inc. | 0,00 | -100,00 | 0,00 | 0,0000 | |||||
| NTIC / Northern Technologies International Corporation | 0,00 | -100,00 | 0,00 | 0,0000 | |||||
| SCHF / Schwab Strategic Trust - Schwab International Equity ETF | 0,00 | -100,00 | 0,00 | 0,0000 | |||||
| LOVE / The Lovesac Company | 0,00 | -100,00 | 0,00 | 0,0000 | |||||
| TGT / Target Corporation | 0,00 | -100,00 | 0,00 | 0,0000 | |||||
| NVEC / NVE Corporation | 0,00 | -100,00 | 0,00 | 0,0000 | |||||
| QIPT / Quipt Home Medical Corp. | 0,00 | -100,00 | 0,00 | -100,00 | -0,0118 | ||||
| ANIK / Anika Therapeutics, Inc. | 0,00 | -100,00 | 0,00 | 0,0000 |