Statistiques de base
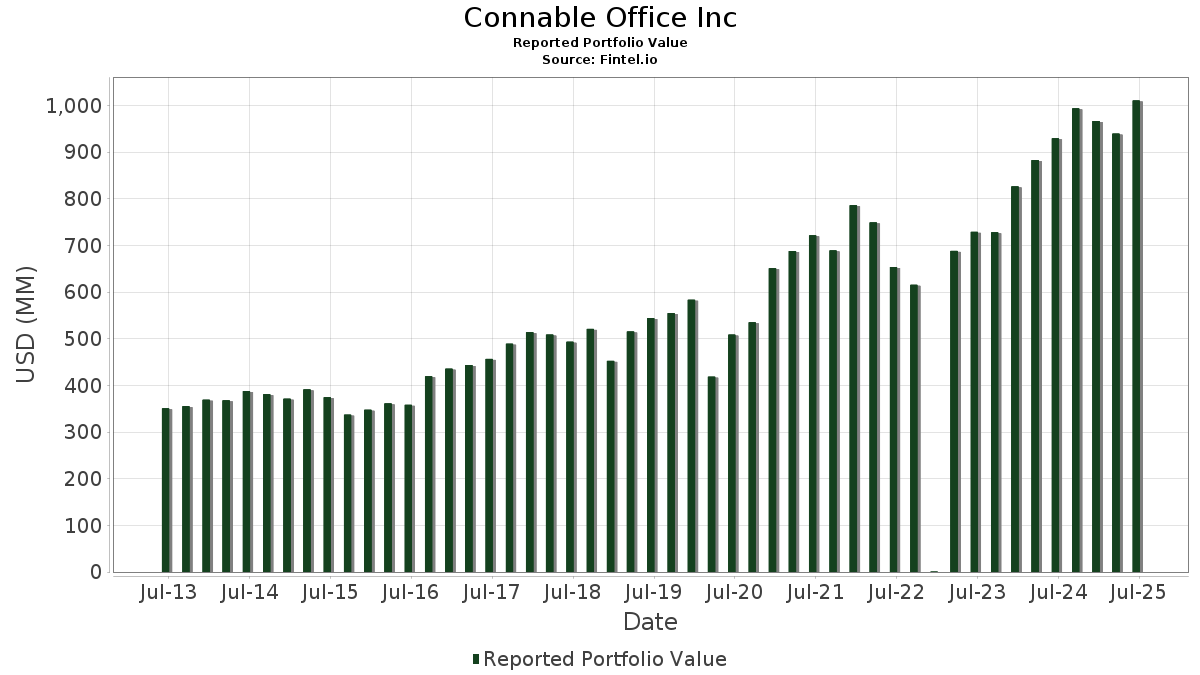
| Valeur du portefeuille | $ 1 010 388 336 |
| Positions actuelles | 224 |
Dernières positions, performances, ASG (à partir des dépôts 13F, 13D)
Connable Office Inc a déclaré un total de 224 positions dans ses derniers dépôts auprès de la SEC. La valeur la plus récente du portefeuille est calculée à 1 010 388 336 USD. Les actifs sous gestion réels (ASG) sont cette valeur plus les liquidités (qui ne sont pas divulguées). Les principales positions de Connable Office Inc sont SPDR S&P 500 ETF (US:SPY) , Vanguard Tax-Managed Funds - Vanguard FTSE Developed Markets ETF (US:VEA) , iShares, Inc. - iShares MSCI Emerging Markets ETF (US:EEM) , iShares Trust - iShares Core U.S. Aggregate Bond ETF (US:AGG) , and iShares, Inc. - iShares Core MSCI Emerging Markets ETF (US:IEMG) . Les nouvelles positions de Connable Office Inc incluent iShares Trust - iShares MSCI USA Quality Factor ETF (US:QUAL) , Philip Morris International Inc. (US:PM) , Parker-Hannifin Corporation (US:PH) , McKesson Corporation (US:MCK) , and International Business Machines Corporation (US:IBM) .
Meilleures augmentations ce trimestre
Nous utilisons la variation de l'allocation du portefeuille car il s'agit de l'indicateur le plus significatif. Les changements peuvent être dus à des transactions ou à des variations de prix des actions.
| Titre | Actions (en millions) |
Valeur ($ en millions) |
% du portefeuille | ΔPortefeuille % |
|---|---|---|---|---|
| 0,10 | 18,10 | 1,7912 | 1,7912 | |
| 0,19 | 11,51 | 1,1389 | 1,1389 | |
| 0,35 | 17,36 | 1,7182 | 1,0581 | |
| 0,40 | 39,79 | 3,9380 | 0,9775 | |
| 0,39 | 243,03 | 24,0534 | 0,6746 | |
| 0,03 | 16,81 | 1,6641 | 0,4420 | |
| 0,09 | 14,55 | 1,4400 | 0,3797 | |
| 0,31 | 26,18 | 2,5912 | 0,2271 | |
| 0,02 | 5,91 | 0,5847 | 0,2247 | |
| 0,01 | 2,12 | 0,2096 | 0,2096 |
Principales baisses ce trimestre
Nous utilisons la variation de l'allocation du portefeuille car il s'agit de l'indicateur le plus significatif. Les changements peuvent être dus à des transactions ou à des variations de prix des actions.
| Titre | Actions (en millions) |
Valeur ($ en millions) |
% du portefeuille | ΔPortefeuille % |
|---|---|---|---|---|
| 0,00 | 18,95 | 1,8754 | -0,3344 | |
| 0,17 | 15,32 | 1,5166 | -0,2649 | |
| 0,94 | 37,59 | 3,7199 | -0,2569 | |
| 0,01 | 2,10 | 0,2081 | -0,2466 | |
| 0,27 | 26,02 | 2,5749 | -0,2306 | |
| 0,01 | 2,68 | 0,2656 | -0,1150 | |
| 0,00 | 0,71 | 0,0707 | -0,0915 | |
| 0,10 | 39,36 | 3,8960 | -0,0812 | |
| 0,00 | 0,90 | 0,0894 | -0,0807 | |
| 0,05 | 10,13 | 1,0024 | -0,0797 |
Déclarations 13F et dépôts de fonds
Ce formulaire a été déposé le 2025-08-05 pour la période de déclaration 2025-06-30. Cliquez sur l'icône du lien pour voir l'historique complet des transactions.
Mettre à niveau pour débloquer les données premium et exporter vers Excel ![]() .
.
| Titre | Type | Prix moyen de l'action | Actions (en millions) |
ΔActions (%) |
ΔActions (%) |
Valeur ($ en millions) |
Portefeuille (%) |
ΔPortefeuille (%) |
|
|---|---|---|---|---|---|---|---|---|---|
| SPY / SPDR S&P 500 ETF | 0,39 | 0,19 | 243,03 | 10,66 | 24,0534 | 0,6746 | |||
| VEA / Vanguard Tax-Managed Funds - Vanguard FTSE Developed Markets ETF | 1,32 | -2,54 | 75,19 | 9,31 | 7,4415 | 0,1191 | |||
| EEM / iShares, Inc. - iShares MSCI Emerging Markets ETF | 1,15 | -1,15 | 55,66 | 9,12 | 5,5092 | 0,0788 | |||
| AGG / iShares Trust - iShares Core U.S. Aggregate Bond ETF | 0,40 | 42,66 | 39,79 | 43,07 | 3,9380 | 0,9775 | |||
| IEMG / iShares, Inc. - iShares Core MSCI Emerging Markets ETF | 0,66 | -1,15 | 39,39 | 9,95 | 3,8983 | 0,0848 | |||
| SYK / Stryker Corporation | 0,10 | -0,87 | 39,36 | 5,36 | 3,8960 | -0,0812 | |||
| GUNR / FlexShares Trust - FlexShares Morningstar Global Upstream Natural Resources Index Fund | 0,94 | -2,65 | 37,59 | 0,61 | 3,7199 | -0,2569 | |||
| MBB / iShares Trust - iShares MBS ETF | 0,32 | 15,46 | 29,91 | 15,60 | 2,9607 | 0,2060 | |||
| DGRW / WisdomTree Trust - WisdomTree U.S. Quality Dividend Growth Fund | 0,31 | 12,43 | 26,18 | 17,89 | 2,5912 | 0,2271 | |||
| IYR / iShares Trust - iShares U.S. Real Estate ETF | 0,27 | -0,26 | 26,02 | -1,28 | 2,5749 | -0,2306 | |||
| BRK.A / Berkshire Hathaway Inc. | 0,00 | 0,00 | 18,95 | -8,72 | 1,8754 | -0,3344 | |||
| QUAL / iShares Trust - iShares MSCI USA Quality Factor ETF | 0,10 | 18,10 | 1,7912 | 1,7912 | |||||
| VTIP / Vanguard Malvern Funds - Vanguard Short-Term Inflation-Protected Securities ETF | 0,35 | 177,91 | 17,36 | 180,00 | 1,7182 | 1,0581 | |||
| MSFT / Microsoft Corporation | 0,03 | 10,53 | 16,81 | 46,45 | 1,6641 | 0,4420 | |||
| EFA / iShares Trust - iShares MSCI EAFE ETF | 0,17 | -16,28 | 15,32 | -8,44 | 1,5166 | -0,2649 | |||
| NVDA / NVIDIA Corporation | 0,09 | 0,21 | 14,55 | 46,07 | 1,4400 | 0,3797 | |||
| VONG / Vanguard Scottsdale Funds - Vanguard Russell 1000 Growth ETF | 0,13 | 0,09 | 14,23 | 17,79 | 1,4085 | 0,1224 | |||
| EZU / iShares, Inc. - iShares MSCI Eurozone ETF | 0,19 | 11,51 | 1,1389 | 1,1389 | |||||
| AAPL / Apple Inc. | 0,05 | 7,87 | 10,13 | -0,36 | 1,0024 | -0,0797 | |||
| VOO / Vanguard Index Funds - Vanguard S&P 500 ETF | 0,01 | -3,62 | 7,35 | 6,54 | 0,7276 | -0,0070 | |||
| AMZN / Amazon.com, Inc. | 0,03 | 1,94 | 6,57 | 17,56 | 0,6500 | 0,0553 | |||
| JPM / JPMorgan Chase & Co. | 0,02 | -3,93 | 6,06 | 13,56 | 0,6000 | 0,0316 | |||
| TIP / iShares Trust - iShares TIPS Bond ETF | 0,06 | 0,56 | 6,05 | -0,39 | 0,5992 | -0,0478 | |||
| MA / Mastercard Incorporated | 0,01 | 0,35 | 5,96 | 2,88 | 0,5898 | -0,0268 | |||
| AVGO / Broadcom Inc. | 0,02 | 6,11 | 5,91 | 74,71 | 0,5847 | 0,2247 | |||
| META / Meta Platforms, Inc. | 0,01 | 9,85 | 5,57 | 40,65 | 0,5517 | 0,1299 | |||
| RTX / RTX Corporation | 0,03 | 37,72 | 5,03 | 51,81 | 0,4980 | 0,1452 | |||
| APH / Amphenol Corporation | 0,05 | 0,34 | 4,50 | 51,09 | 0,4452 | 0,1282 | |||
| LIN / Linde plc | 0,01 | -1,79 | 4,46 | -1,04 | 0,4416 | -0,0384 | |||
| TSLA / Tesla, Inc. | 0,01 | 0,22 | 4,42 | 22,85 | 0,4374 | 0,0544 | |||
| VB / Vanguard Index Funds - Vanguard Small-Cap ETF | 0,02 | 3,95 | 4,29 | 11,07 | 0,4242 | 0,0135 | |||
| GOOGL / Alphabet Inc. | 0,02 | 3,71 | 3,99 | 18,20 | 0,3947 | 0,0355 | |||
| LLY / Eli Lilly and Company | 0,00 | 1,83 | 3,64 | -3,91 | 0,3605 | -0,0429 | |||
| PANW / Palo Alto Networks, Inc. | 0,02 | -0,07 | 3,60 | 19,83 | 0,3566 | 0,0366 | |||
| GOOG / Alphabet Inc. | 0,02 | -10,06 | 3,57 | 2,12 | 0,3531 | -0,0188 | |||
| COP / ConocoPhillips | 0,04 | 5,21 | 3,48 | -10,08 | 0,3444 | -0,0676 | |||
| MCO / Moody's Corporation | 0,01 | -0,09 | 3,37 | 7,63 | 0,3337 | 0,0002 | |||
| AXP / American Express Company | 0,01 | 0,35 | 3,33 | 18,99 | 0,3299 | 0,0316 | |||
| COST / Costco Wholesale Corporation | 0,00 | 0,74 | 3,25 | 5,46 | 0,3213 | -0,0064 | |||
| MAR / Marriott International, Inc. | 0,01 | 0,35 | 3,21 | 15,11 | 0,3182 | 0,0209 | |||
| DIS / The Walt Disney Company | 0,03 | -13,01 | 3,13 | 9,30 | 0,3093 | 0,0049 | |||
| PG / The Procter & Gamble Company | 0,02 | 0,72 | 3,11 | -5,84 | 0,3081 | -0,0438 | |||
| WFC / Wells Fargo & Company | 0,04 | -14,55 | 3,06 | -4,64 | 0,3031 | -0,0387 | |||
| KLAC / KLA Corporation | 0,00 | -0,29 | 3,04 | 31,37 | 0,3009 | 0,0546 | |||
| LOW / Lowe's Companies, Inc. | 0,01 | -0,08 | 3,03 | -4,95 | 0,3002 | -0,0395 | |||
| HON / Honeywell International Inc. | 0,01 | 0,20 | 2,95 | 10,22 | 0,2915 | 0,0070 | |||
| KO / The Coca-Cola Company | 0,04 | -0,18 | 2,93 | -1,38 | 0,2895 | -0,0263 | |||
| ADSK / Autodesk, Inc. | 0,01 | -0,09 | 2,82 | 18,13 | 0,2787 | 0,0250 | |||
| NEE / NextEra Energy, Inc. | 0,04 | 1,92 | 2,73 | -0,22 | 0,2703 | -0,0210 | |||
| TMUS / T-Mobile US, Inc. | 0,01 | -15,97 | 2,68 | -24,93 | 0,2656 | -0,1150 | |||
| C / Citigroup Inc. | 0,03 | -0,32 | 2,67 | 19,54 | 0,2646 | 0,0265 | |||
| DE / Deere & Company | 0,01 | -15,01 | 2,61 | -7,92 | 0,2579 | -0,0434 | |||
| CRM / Salesforce, Inc. | 0,01 | 0,33 | 2,55 | 1,92 | 0,2524 | -0,0139 | |||
| KKR / KKR & Co. Inc. | 0,02 | -0,20 | 2,48 | 14,82 | 0,2454 | 0,0156 | |||
| DHR / Danaher Corporation | 0,01 | 0,34 | 2,43 | -3,30 | 0,2409 | -0,0271 | |||
| TSM / Taiwan Semiconductor Manufacturing Company Limited - Depositary Receipt (Common Stock) | 0,01 | -6,90 | 2,35 | 27,02 | 0,2322 | 0,0356 | |||
| ACGL / Arch Capital Group Ltd. | 0,03 | -3,30 | 2,34 | -8,46 | 0,2314 | -0,0405 | |||
| SE / Sea Limited - Depositary Receipt (Common Stock) | 0,01 | -6,90 | 2,30 | 14,08 | 0,2278 | 0,0131 | |||
| TMO / Thermo Fisher Scientific Inc. | 0,01 | 1,70 | 2,29 | -17,14 | 0,2263 | -0,0674 | |||
| SPOT / Spotify Technology S.A. | 0,00 | -6,28 | 2,22 | 30,74 | 0,2198 | 0,0390 | |||
| UNP / Union Pacific Corporation | 0,01 | -10,94 | 2,20 | -13,27 | 0,2174 | -0,0522 | |||
| PEP / PepsiCo, Inc. | 0,02 | 4,83 | 2,14 | -7,67 | 0,2120 | -0,0350 | |||
| PM / Philip Morris International Inc. | 0,01 | 2,12 | 0,2096 | 0,2096 | |||||
| UNH / UnitedHealth Group Incorporated | 0,01 | -17,37 | 2,10 | -50,78 | 0,2081 | -0,2466 | |||
| ACN / Accenture plc | 0,01 | 0,35 | 2,07 | -3,89 | 0,2052 | -0,0244 | |||
| SHW / The Sherwin-Williams Company | 0,01 | -0,17 | 2,06 | -1,86 | 0,2037 | -0,0195 | |||
| ABT / Abbott Laboratories | 0,01 | 0,98 | 2,03 | 3,51 | 0,2014 | -0,0078 | |||
| PH / Parker-Hannifin Corporation | 0,00 | 2,02 | 0,2002 | 0,2002 | |||||
| ETN / Eaton Corporation plc | 0,01 | -9,39 | 1,95 | 19,01 | 0,1933 | 0,0186 | |||
| MCK / McKesson Corporation | 0,00 | 1,87 | 0,1850 | 0,1850 | |||||
| SAP / SAP SE - Depositary Receipt (Common Stock) | 0,01 | -6,90 | 1,86 | 5,52 | 0,1836 | -0,0036 | |||
| ROK / Rockwell Automation, Inc. | 0,01 | -22,26 | 1,81 | -0,06 | 0,1794 | -0,0137 | |||
| IBM / International Business Machines Corporation | 0,01 | 1,78 | 0,1759 | 0,1759 | |||||
| CMG / Chipotle Mexican Grill, Inc. | 0,03 | 0,34 | 1,77 | 12,22 | 0,1754 | 0,0073 | |||
| EOG / EOG Resources, Inc. | 0,01 | 0,22 | 1,70 | -6,49 | 0,1684 | -0,0254 | |||
| MUB / iShares Trust - iShares National Muni Bond ETF | 0,02 | 208,68 | 1,67 | 206,23 | 0,1655 | 0,1073 | |||
| AMGN / Amgen Inc. | 0,01 | 2,63 | 1,62 | -8,00 | 0,1604 | -0,0272 | |||
| ADBE / Adobe Inc. | 0,00 | 0,16 | 1,42 | 1,06 | 0,1410 | -0,0091 | |||
| GWRE / Guidewire Software, Inc. | 0,01 | -7,68 | 1,36 | 16,00 | 0,1350 | 0,0098 | |||
| H / Hyatt Hotels Corporation | 0,01 | 0,00 | 1,31 | 14,06 | 0,1301 | 0,0074 | |||
| BKR / Baker Hughes Company | 0,03 | 0,35 | 1,30 | -12,44 | 0,1282 | -0,0293 | |||
| CPNG / Coupang, Inc. | 0,04 | -6,90 | 1,26 | 27,22 | 0,1250 | 0,0193 | |||
| CP / Canadian Pacific Kansas City Limited | 0,01 | -6,91 | 1,14 | 5,15 | 0,1132 | -0,0026 | |||
| FDS / FactSet Research Systems Inc. | 0,00 | 0,00 | 1,07 | -1,66 | 0,1058 | -0,0099 | |||
| ASML / ASML Holding N.V. - Depositary Receipt (Common Stock) | 0,00 | -6,93 | 1,05 | 12,61 | 0,1044 | 0,0046 | |||
| MNDY / monday.com Ltd. | 0,00 | -6,88 | 1,05 | 20,37 | 0,1036 | 0,0111 | |||
| MELI / MercadoLibre, Inc. | 0,00 | -6,87 | 1,03 | 24,79 | 0,1017 | 0,0140 | |||
| IBN / ICICI Bank Limited - Depositary Receipt (Common Stock) | 0,03 | -6,90 | 1,01 | -0,69 | 0,1000 | -0,0082 | |||
| HLI / Houlihan Lokey, Inc. | 0,01 | -13,68 | 1,00 | -3,84 | 0,0993 | -0,0117 | |||
| VXF / Vanguard Index Funds - Vanguard Extended Market ETF | 0,01 | -3,56 | 1,00 | 7,90 | 0,0988 | 0,0003 | |||
| IDXX / IDEXX Laboratories, Inc. | 0,00 | 0,00 | 0,97 | 27,81 | 0,0955 | 0,0151 | |||
| IVV / iShares Trust - iShares Core S&P 500 ETF | 0,00 | 29,16 | 0,96 | 42,71 | 0,0950 | 0,0234 | |||
| ITGR / Integer Holdings Corporation | 0,01 | 8,58 | 0,95 | 13,14 | 0,0938 | 0,0046 | |||
| CHH / Choice Hotels International, Inc. | 0,01 | 0,00 | 0,91 | -4,50 | 0,0904 | -0,0114 | |||
| RACE / Ferrari N.V. | 0,00 | -50,72 | 0,90 | -43,52 | 0,0894 | -0,0807 | |||
| PRI / Primerica, Inc. | 0,00 | 0,00 | 0,88 | -3,72 | 0,0870 | -0,0103 | |||
| NU / Nu Holdings Ltd. | 0,06 | -6,90 | 0,87 | 24,82 | 0,0856 | 0,0118 | |||
| UBS / UBS Group AG | 0,03 | -6,90 | 0,86 | 2,87 | 0,0850 | -0,0039 | |||
| IT / Gartner, Inc. | 0,00 | 0,00 | 0,85 | -3,75 | 0,0840 | -0,0098 | |||
| NVO / Novo Nordisk A/S - Depositary Receipt (Common Stock) | 0,01 | -39,37 | 0,84 | -39,77 | 0,0834 | -0,0655 | |||
| AZN / AstraZeneca PLC - Depositary Receipt (Common Stock) | 0,01 | -40,13 | 0,84 | -43,08 | 0,0831 | -0,0739 | |||
| PFE / Pfizer Inc. | 0,03 | 14,37 | 0,83 | 9,45 | 0,0826 | 0,0014 | |||
| IWB / iShares Trust - iShares Russell 1000 ETF | 0,00 | -26,42 | 0,79 | -18,54 | 0,0783 | -0,0251 | |||
| GE / General Electric Company | 0,00 | 0,78 | 0,0770 | 0,0770 | |||||
| KEY / KeyCorp | 0,04 | 7,27 | 0,73 | 16,85 | 0,0721 | 0,0057 | |||
| FLS / Flowserve Corporation | 0,01 | 0,00 | 0,72 | 7,26 | 0,0717 | -0,0002 | |||
| CSGP / CoStar Group, Inc. | 0,01 | 0,00 | 0,72 | 1,40 | 0,0716 | -0,0043 | |||
| BRK.B / Berkshire Hathaway Inc. | 0,00 | -48,58 | 0,71 | -53,12 | 0,0707 | -0,0915 | |||
| CAKE / The Cheesecake Factory Incorporated | 0,01 | -12,54 | 0,71 | 12,72 | 0,0702 | 0,0032 | |||
| CARR / Carrier Global Corporation | 0,01 | 0,71 | 0,0702 | 0,0702 | |||||
| SPXC / SPX Technologies, Inc. | 0,00 | -14,18 | 0,71 | 11,89 | 0,0699 | 0,0026 | |||
| CWST / Casella Waste Systems, Inc. | 0,01 | -23,32 | 0,69 | -20,67 | 0,0681 | -0,0242 | |||
| CBT / Cabot Corporation | 0,01 | 13,95 | 0,69 | 2,85 | 0,0678 | -0,0031 | |||
| WCN / Waste Connections, Inc. | 0,00 | -6,89 | 0,68 | -10,99 | 0,0674 | -0,0140 | |||
| PSN / Parsons Corporation | 0,01 | 0,00 | 0,68 | 21,15 | 0,0669 | 0,0075 | |||
| AON / Aon plc | 0,00 | -6,93 | 0,64 | -16,84 | 0,0636 | -0,0186 | |||
| CNQ / Canadian Natural Resources Limited | 0,02 | -6,90 | 0,64 | -5,04 | 0,0635 | -0,0085 | |||
| SMG / The Scotts Miracle-Gro Company | 0,01 | 14,32 | 0,63 | 37,64 | 0,0623 | 0,0135 | |||
| FCFS / FirstCash Holdings, Inc. | 0,00 | 0,00 | 0,63 | 12,37 | 0,0621 | 0,0026 | |||
| GATX / GATX Corporation | 0,00 | 0,00 | 0,63 | -1,11 | 0,0619 | -0,0054 | |||
| RRR / Red Rock Resorts, Inc. | 0,01 | 0,00 | 0,62 | 19,96 | 0,0613 | 0,0063 | |||
| AEIS / Advanced Energy Industries, Inc. | 0,00 | 0,00 | 0,62 | 38,83 | 0,0610 | 0,0138 | |||
| JEF / Jefferies Financial Group Inc. | 0,01 | 0,00 | 0,61 | 2,17 | 0,0606 | -0,0032 | |||
| SSB / SouthState Corporation | 0,01 | 0,00 | 0,60 | -0,82 | 0,0599 | -0,0051 | |||
| INSP / Inspire Medical Systems, Inc. | 0,00 | 0,00 | 0,60 | -18,45 | 0,0595 | -0,0190 | |||
| UBSI / United Bankshares, Inc. | 0,02 | 9,25 | 0,60 | 14,78 | 0,0593 | 0,0037 | |||
| TEAM / Atlassian Corporation | 0,00 | -6,89 | 0,60 | -10,88 | 0,0593 | -0,0123 | |||
| NFLX / Netflix, Inc. | 0,00 | 0,59 | 0,0588 | 0,0588 | |||||
| CFG / Citizens Financial Group, Inc. | 0,01 | 1,35 | 0,59 | 10,65 | 0,0586 | 0,0017 | |||
| MOGA / Moog, Inc. - Class A | 0,00 | -13,31 | 0,58 | -9,58 | 0,0571 | -0,0108 | |||
| SF / Stifel Financial Corp. | 0,01 | 0,00 | 0,56 | 10,02 | 0,0555 | 0,0013 | |||
| DAR / Darling Ingredients Inc. | 0,01 | 19,17 | 0,56 | 44,70 | 0,0555 | 0,0142 | |||
| ACWX / iShares Trust - iShares MSCI ACWI ex U.S. ETF | 0,01 | -26,79 | 0,55 | -19,51 | 0,0548 | -0,0184 | |||
| RGA / Reinsurance Group of America, Incorporated | 0,00 | -18,25 | 0,55 | -17,73 | 0,0547 | -0,0167 | |||
| UCB / United Community Banks, Inc. | 0,02 | 10,50 | 0,55 | 17,09 | 0,0542 | 0,0044 | |||
| FORM / FormFactor, Inc. | 0,02 | 0,00 | 0,54 | 21,72 | 0,0533 | 0,0062 | |||
| BOX / Box, Inc. | 0,02 | 0,00 | 0,54 | 10,74 | 0,0531 | 0,0015 | |||
| VRSK / Verisk Analytics, Inc. | 0,00 | 0,00 | 0,53 | 4,75 | 0,0524 | -0,0014 | |||
| AIR / AAR Corp. | 0,01 | 0,00 | 0,51 | 22,84 | 0,0506 | 0,0063 | |||
| UMBF / UMB Financial Corporation | 0,00 | 0,00 | 0,51 | 4,08 | 0,0505 | -0,0017 | |||
| TRMK / Trustmark Corporation | 0,01 | -10,90 | 0,51 | -5,78 | 0,0500 | -0,0071 | |||
| R / Ryder System, Inc. | 0,00 | 0,00 | 0,50 | 10,53 | 0,0500 | 0,0014 | |||
| DOC / Healthpeak Properties, Inc. | 0,03 | 25,48 | 0,50 | 8,68 | 0,0496 | 0,0005 | |||
| FELE / Franklin Electric Co., Inc. | 0,01 | -11,48 | 0,50 | -15,37 | 0,0496 | -0,0134 | |||
| MTN / Vail Resorts, Inc. | 0,00 | 0,00 | 0,49 | -1,98 | 0,0490 | -0,0047 | |||
| PLXS / Plexus Corp. | 0,00 | 0,00 | 0,49 | 5,57 | 0,0489 | -0,0009 | |||
| HXL / Hexcel Corporation | 0,01 | 0,00 | 0,49 | 3,15 | 0,0487 | -0,0021 | |||
| GLD / SPDR Gold Trust | 0,00 | 0,00 | 0,49 | 5,82 | 0,0486 | -0,0008 | |||
| TKR / The Timken Company | 0,01 | 12,71 | 0,49 | 13,75 | 0,0483 | 0,0026 | |||
| OTIS / Otis Worldwide Corporation | 0,00 | 0,48 | 0,0475 | 0,0475 | |||||
| STAG / STAG Industrial, Inc. | 0,01 | 0,00 | 0,47 | 0,43 | 0,0468 | -0,0033 | |||
| MORN / Morningstar, Inc. | 0,00 | 0,00 | 0,46 | 4,77 | 0,0457 | -0,0013 | |||
| FRME / First Merchants Corporation | 0,01 | 0,00 | 0,46 | -5,35 | 0,0456 | -0,0062 | |||
| ONB / Old National Bancorp | 0,02 | -5,15 | 0,46 | -4,37 | 0,0455 | -0,0057 | |||
| OGS / ONE Gas, Inc. | 0,01 | 0,00 | 0,46 | -4,99 | 0,0453 | -0,0060 | |||
| JNJ / Johnson & Johnson | 0,00 | 0,46 | 0,0451 | 0,0451 | |||||
| SABR / Sabre Corporation | 0,14 | 0,00 | 0,45 | 12,25 | 0,0445 | 0,0019 | |||
| MTH / Meritage Homes Corporation | 0,01 | 13,37 | 0,45 | 7,16 | 0,0445 | -0,0002 | |||
| STE / STERIS plc | 0,00 | -57,81 | 0,45 | -55,37 | 0,0441 | -0,0620 | |||
| AMKR / Amkor Technology, Inc. | 0,02 | 77,51 | 0,44 | 106,13 | 0,0433 | 0,0207 | |||
| GPK / Graphic Packaging Holding Company | 0,02 | 41,12 | 0,44 | 14,44 | 0,0432 | 0,0026 | |||
| EFSC / Enterprise Financial Services Corp | 0,01 | -17,00 | 0,44 | -14,87 | 0,0431 | -0,0114 | |||
| OII / Oceaneering International, Inc. | 0,02 | 0,00 | 0,43 | -4,91 | 0,0422 | -0,0056 | |||
| DVY / iShares Trust - iShares Select Dividend ETF | 0,00 | 0,42 | 0,0414 | 0,0414 | |||||
| ENS / EnerSys | 0,00 | 0,00 | 0,41 | -6,39 | 0,0406 | -0,0060 | |||
| LFUS / Littelfuse, Inc. | 0,00 | 0,00 | 0,41 | 15,01 | 0,0403 | 0,0027 | |||
| AMCR / Amcor plc | 0,04 | 0,41 | 0,0402 | 0,0402 | |||||
| AUB / Atlantic Union Bankshares Corporation | 0,01 | 0,41 | 0,0402 | 0,0402 | |||||
| WST / West Pharmaceutical Services, Inc. | 0,00 | 0,00 | 0,40 | -2,42 | 0,0400 | -0,0040 | |||
| CTS / CTS Corporation | 0,01 | 16,08 | 0,40 | 19,05 | 0,0396 | 0,0038 | |||
| GEV / GE Vernova Inc. | 0,00 | 0,40 | 0,0396 | 0,0396 | |||||
| FNB / F.N.B. Corporation | 0,03 | -3,42 | 0,38 | 4,74 | 0,0372 | -0,0010 | |||
| HMN / Horace Mann Educators Corporation | 0,01 | 0,00 | 0,38 | 0,54 | 0,0372 | -0,0026 | |||
| FCPT / Four Corners Property Trust, Inc. | 0,01 | 0,00 | 0,37 | -6,11 | 0,0365 | -0,0054 | |||
| CNMD / CONMED Corporation | 0,01 | 13,92 | 0,36 | -1,63 | 0,0358 | -0,0034 | |||
| AGCO / AGCO Corporation | 0,00 | -0,63 | 0,36 | 10,77 | 0,0357 | 0,0010 | |||
| CBRL / Cracker Barrel Old Country Store, Inc. | 0,01 | 0,36 | 0,0354 | 0,0354 | |||||
| CNS / Cohen & Steers, Inc. | 0,00 | 0,00 | 0,35 | -6,15 | 0,0348 | -0,0051 | |||
| AIN / Albany International Corp. | 0,00 | 0,00 | 0,34 | 1,51 | 0,0333 | -0,0020 | |||
| KNSL / Kinsale Capital Group, Inc. | 0,00 | 0,00 | 0,34 | -0,59 | 0,0333 | -0,0027 | |||
| ECG / Everus Construction Group, Inc. | 0,01 | 0,33 | 0,0330 | 0,0330 | |||||
| GLPI / Gaming and Leisure Properties, Inc. | 0,01 | 0,00 | 0,33 | -8,33 | 0,0327 | -0,0057 | |||
| DUK / Duke Energy Corporation | 0,00 | 0,33 | 0,0323 | 0,0323 | |||||
| UGI / UGI Corporation | 0,01 | -3,82 | 0,31 | 6,14 | 0,0308 | -0,0005 | |||
| AROC / Archrock, Inc. | 0,01 | 0,00 | 0,30 | -5,38 | 0,0296 | -0,0041 | |||
| KMPR / Kemper Corporation | 0,00 | -3,52 | 0,30 | -6,87 | 0,0295 | -0,0046 | |||
| FIGS / FIGS, Inc. | 0,05 | 0,00 | 0,30 | 22,82 | 0,0293 | 0,0037 | |||
| XPRO / Expro Group Holdings N.V. | 0,03 | 0,00 | 0,30 | -13,74 | 0,0293 | -0,0072 | |||
| DIOD / Diodes Incorporated | 0,01 | 0,00 | 0,29 | 22,59 | 0,0291 | 0,0036 | |||
| WWW / Wolverine World Wide, Inc. | 0,02 | 0,00 | 0,29 | 29,73 | 0,0286 | 0,0049 | |||
| DVN / Devon Energy Corporation | 0,01 | -7,97 | 0,29 | -21,80 | 0,0285 | -0,0107 | |||
| XOM / Exxon Mobil Corporation | 0,00 | 0,29 | 0,0283 | 0,0283 | |||||
| CWAN / Clearwater Analytics Holdings, Inc. | 0,01 | 61,80 | 0,28 | 32,55 | 0,0279 | 0,0052 | |||
| MCD / McDonald's Corporation | 0,00 | 0,27 | 0,0268 | 0,0268 | |||||
| POR / Portland General Electric Company | 0,01 | 5,09 | 0,27 | -4,32 | 0,0264 | -0,0033 | |||
| ST / Sensata Technologies Holding plc | 0,01 | 0,26 | 0,0259 | 0,0259 | |||||
| KMB / Kimberly-Clark Corporation | 0,00 | 0,26 | 0,0255 | 0,0255 | |||||
| CDP / COPT Defense Properties | 0,01 | 0,00 | 0,25 | 1,20 | 0,0252 | -0,0016 | |||
| BFAM / Bright Horizons Family Solutions Inc. | 0,00 | 0,00 | 0,25 | -2,70 | 0,0250 | -0,0026 | |||
| ZTS / Zoetis Inc. | 0,00 | 0,00 | 0,25 | -5,36 | 0,0245 | -0,0033 | |||
| ENSG / The Ensign Group, Inc. | 0,00 | -9,32 | 0,25 | 8,37 | 0,0244 | 0,0001 | |||
| TNET / TriNet Group, Inc. | 0,00 | 0,00 | 0,23 | -7,87 | 0,0232 | -0,0038 | |||
| BIRK / Birkenstock Holding plc | 0,00 | 7,78 | 0,23 | 15,84 | 0,0232 | 0,0016 | |||
| GVA / Granite Construction Incorporated | 0,00 | -14,31 | 0,23 | 5,96 | 0,0229 | -0,0003 | |||
| WTM / White Mountains Insurance Group, Ltd. | 0,00 | -14,00 | 0,23 | -19,79 | 0,0229 | -0,0078 | |||
| ICUI / ICU Medical, Inc. | 0,00 | -5,99 | 0,23 | -10,51 | 0,0228 | -0,0046 | |||
| PEB / Pebblebrook Hotel Trust | 0,02 | 0,00 | 0,23 | -1,30 | 0,0225 | -0,0020 | |||
| REZI / Resideo Technologies, Inc. | 0,01 | 0,81 | 0,23 | 25,70 | 0,0223 | 0,0032 | |||
| XRAY / DENTSPLY SIRONA Inc. | 0,01 | -6,55 | 0,22 | -0,45 | 0,0220 | -0,0018 | |||
| KRG / Kite Realty Group Trust | 0,01 | 0,22 | 0,0219 | 0,0219 | |||||
| TTAN / ServiceTitan, Inc. | 0,00 | 0,22 | 0,0217 | 0,0217 | |||||
| CNO / CNO Financial Group, Inc. | 0,01 | 0,00 | 0,22 | -7,30 | 0,0214 | -0,0035 | |||
| CE / Celanese Corporation | 0,00 | -7,19 | 0,21 | -9,79 | 0,0211 | -0,0040 | |||
| LKQ / LKQ Corporation | 0,01 | -3,08 | 0,20 | -15,77 | 0,0202 | -0,0056 | |||
| IRDM / Iridium Communications Inc. | 0,01 | 0,20 | 0,0199 | 0,0199 | |||||
| COLD / Americold Realty Trust, Inc. | 0,01 | 0,19 | 0,0188 | 0,0188 | |||||
| CLB / Core Laboratories Inc. | 0,02 | 0,00 | 0,19 | -23,17 | 0,0187 | -0,0075 | |||
| FLO / Flowers Foods, Inc. | 0,01 | 0,18 | 0,0181 | 0,0181 | |||||
| HP / Helmerich & Payne, Inc. | 0,01 | 0,00 | 0,16 | -42,24 | 0,0159 | -0,0136 | |||
| SOUN / SoundHound AI, Inc. | 0,01 | 0,00 | 0,15 | 31,86 | 0,0148 | 0,0028 | |||
| PTEN / Patterson-UTI Energy, Inc. | 0,02 | -5,20 | 0,13 | -31,63 | 0,0133 | -0,0076 | |||
| HBI / Hanesbrands Inc. | 0,02 | 38,36 | 0,10 | 10,75 | 0,0102 | 0,0002 | |||
| VLY / Valley National Bancorp | 0,01 | 0,00 | 0,10 | 0,00 | 0,0097 | -0,0007 | |||
| TTI / TETRA Technologies, Inc. | 0,01 | 0,00 | 0,04 | 0,00 | 0,0037 | -0,0003 | |||
| DNB / Dun & Bradstreet Holdings, Inc. | 0,00 | -100,00 | 0,00 | 0,0000 | |||||
| NEOG / Neogen Corporation | 0,00 | -100,00 | 0,00 | 0,0000 | |||||
| DEI / Douglas Emmett, Inc. | 0,00 | -100,00 | 0,00 | 0,0000 | |||||
| XOP / SPDR Series Trust - SPDR S&P Oil & Gas Exploration & Production ETF | 0,00 | -100,00 | 0,00 | 0,0000 | |||||
| RSP / Invesco Exchange-Traded Fund Trust - Invesco S&P 500 Equal Weight ETF | 0,00 | -100,00 | 0,00 | 0,0000 | |||||
| BCO / The Brink's Company | 0,00 | -100,00 | 0,00 | 0,0000 | |||||
| VO / Vanguard Index Funds - Vanguard Mid-Cap ETF | 0,00 | -100,00 | 0,00 | 0,0000 | |||||
| ANSS / ANSYS, Inc. | 0,00 | -100,00 | 0,00 | 0,0000 | |||||
| BERY / Berry Global Group, Inc. | 0,00 | -100,00 | 0,00 | 0,0000 | |||||
| TREX / Trex Company, Inc. | 0,00 | -100,00 | 0,00 | 0,0000 | |||||
| AXS / AXIS Capital Holdings Limited | 0,00 | -100,00 | 0,00 | 0,0000 | |||||
| MANU / Manchester United plc | 0,00 | -100,00 | 0,00 | 0,0000 | |||||
| TXNM / TXNM Energy, Inc. | 0,00 | -100,00 | 0,00 | 0,0000 | |||||
| ENTG / Entegris, Inc. | 0,00 | -100,00 | 0,00 | 0,0000 | |||||
| JAAA / Janus Detroit Street Trust - Janus Henderson AAA CLO ETF | 0,00 | -100,00 | 0,00 | 0,0000 | |||||
| SAIC / Science Applications International Corporation | 0,00 | -100,00 | 0,00 | 0,0000 | |||||
| ABBV / AbbVie Inc. | 0,00 | -100,00 | 0,00 | 0,0000 | |||||
| SR / Spire Inc. | 0,00 | -100,00 | 0,00 | 0,0000 | |||||
| VGK / Vanguard International Equity Index Funds - Vanguard FTSE Europe ETF | 0,00 | -100,00 | 0,00 | 0,0000 | |||||
| ICLR / ICON Public Limited Company | 0,00 | -100,00 | 0,00 | 0,0000 |